Hey,
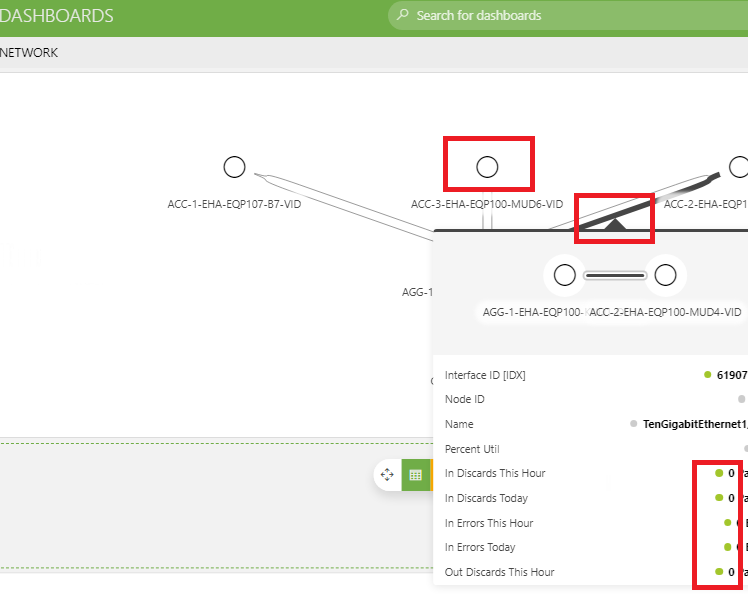
We created a dashboard using: "Node Edge Graph" to visualize the state of the network.
We would like the "Nodes" and "Lines" in the generated graph (See snapshot below) to inherit the colors of the parameters that it is representing.
Today using this dashboard the operators need to click on each Node \ Line to see if there are any errors \ alerts on it.
Thank you.
Hi Guy,
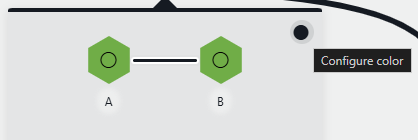
You can do so by clicking in the top-right corner of the pop-up:
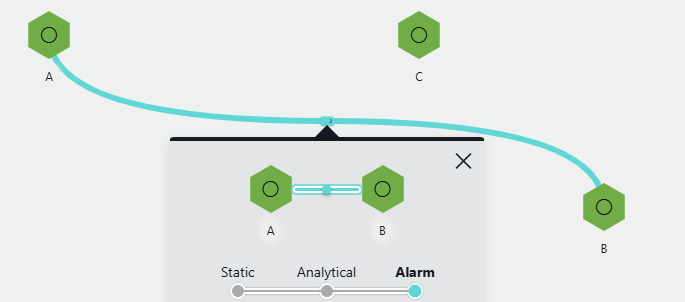
Followed by setting the coloring to 'Alarm':
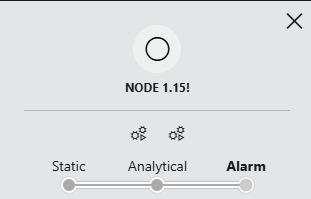
For the nodes, the approach will be similar, however, it’s important to note that this requires including an alarmed parameter as a column for the nodes.
Hi Guy,
Thanks for your question.
When you hover over a node or an edge in the graph, you’ll see an option in the top right corner to configure the color.
There are three available color modes:
- Static: a fixed color.
- Analytical: lets you define colors based on specific values.
- Alarm: automatically sets the color based on the highest severity level among all values associated with that node or edge.
In this use case, I would recommend using the alarm mode since this will automatically show the highest severity color.
Hope this helps! Let us know if you need further assistance.
Perfect. That is exactly what we were looking for.
Thank you for your help.
Perfect. That is exactly what we were looking for.
Thank you for your help.