Can we feed table data into gauge and map to columns or for selected rows?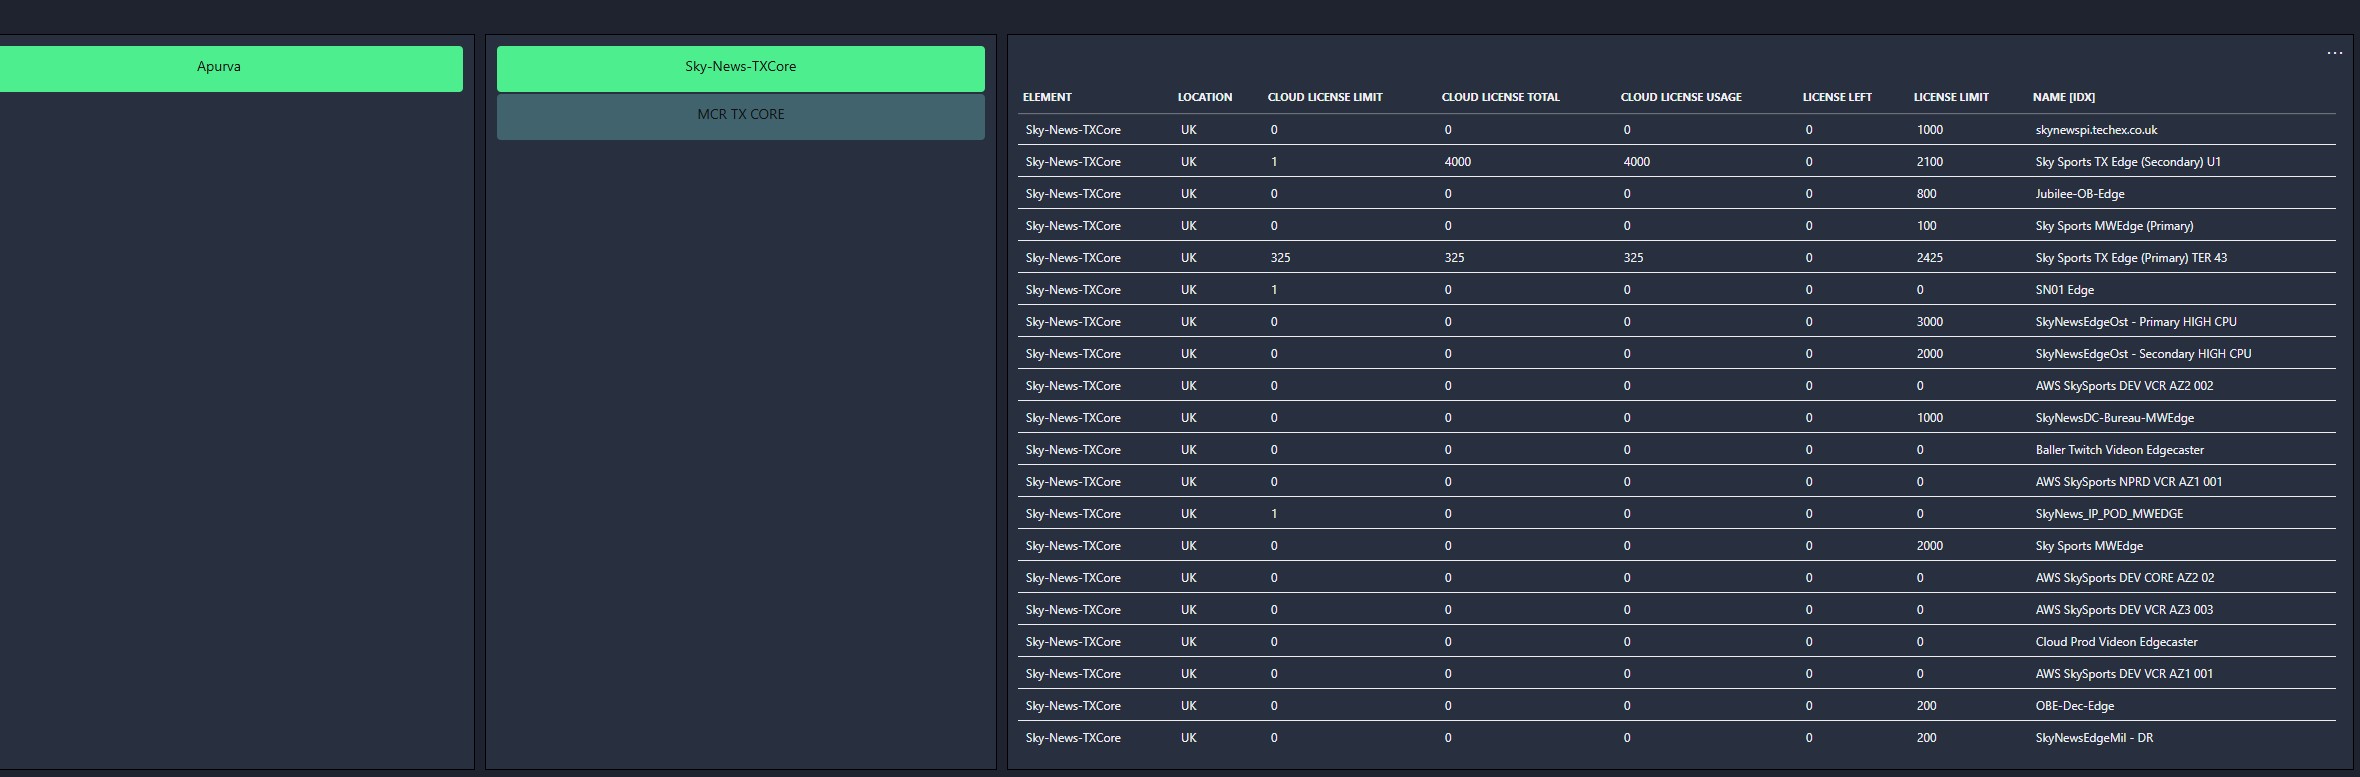
This table can be dynamic
Marieke Goethals [SLC] [DevOps Catalyst] Selected answer as best
As this question has now been inactive for a very long time, I will close it. If you still want more information about this, could you post a new question?
Hi Apurva,
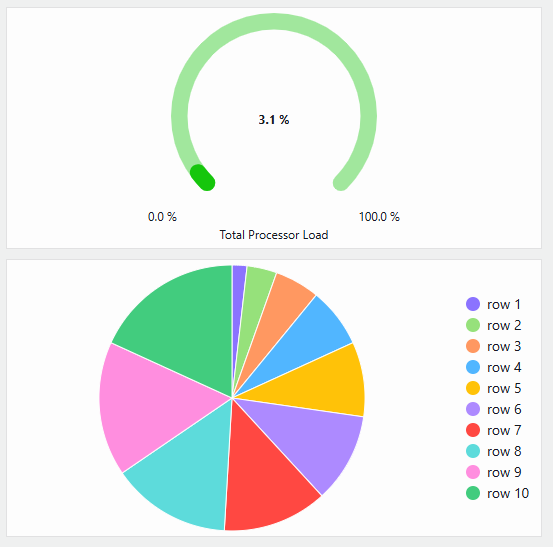
The Gauge component doesn’t accept query data, only parameter data. What type of data are you trying to visualize? The Gauge component is meant for a value between a min/max (eg: Total processor load in %). A Pie/Donut chart can visualize the relation between multiple values that make up a total and can work with tables.
Marieke Goethals [SLC] [DevOps Catalyst] Selected answer as best
I see that this question has been inactive for some time. Do you still need help with this? If not, could you select the answer (using the ✓ icon) to indicate that no further follow-up is needed?