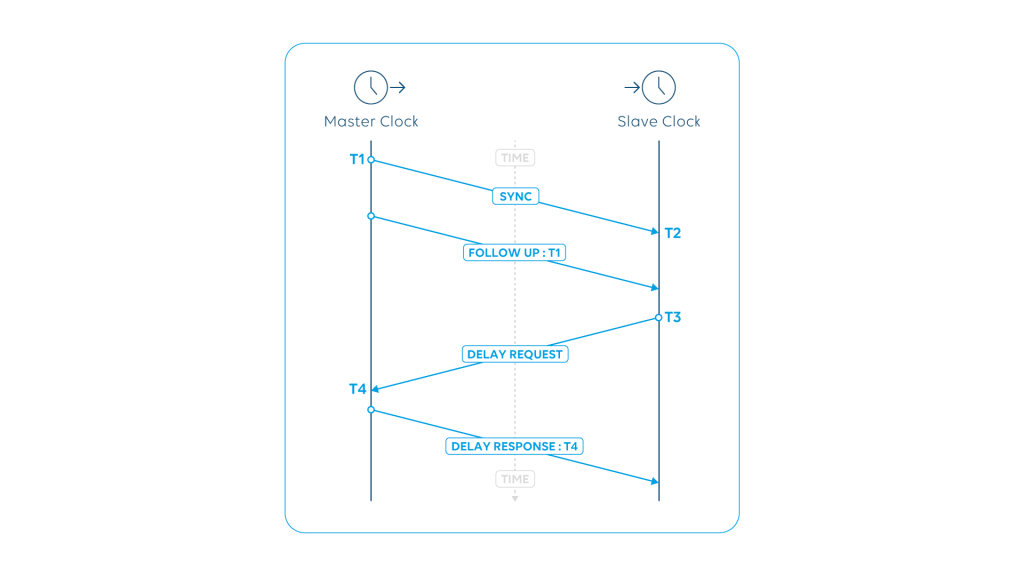
With the migration to IP in the media and broadband industry, legacy and mostly analog synchronization signals like Black and Burst, Tri-level Sync, DARS, 10MHz or 1PPS are getting replaced with the IEEE1588 Precision Time Protocol (PTP).
With PTP being a flexible protocol and not just a signal, new challenges arise: the PTP setup needs to be engineered well to assure accurate frequency and time transfer from an external time reference such as GPS to all media nodes within the all-IP infrastructure.
Want to know more about the basics of how clock synchronization works with PTP, including 9 tips to efficiently manage and monitor clock synchronization? Then read “How does clock synchronization work“.
The PTP protocol offers ample room to fine-tune and adjust its performance to the requirements of specific use cases via PTP profiles. The media industry mostly uses the AES67 and SMPTE ST-2059-2 profiles to synchronize clocks and optimize the precision of time at the endpoint.
Nevertheless, like every other standard, the PTP standard also makes assumptions, such as that no packet delay variation (PDV) occurs in the network, that there is no network asymmetry (internal switch asymmetry or transmission asymmetry), and that all timestamps are perfect.
Mechanisms to alleviate those sources of errors need to be implemented: timestamps are created in hardware, use Quality of Service to prioritize PTP traffic, and not only pick the right profile but fine-tune your PTP settings toward every single deployment. But as reality shows, even in very well-engineered environments, things can—and do—go wrong. That’s why monitoring and actively managing your PTP infrastructure 24/7, end to end, has simply become a must.

Common Sources Of PTP Trouble
PTP issues might originate from the misconfiguration of grandmasters, boundary clocks, transparent clocks, or PTP slave devices. Often device provisioning and configuration is still a manual task for many media companies. With the fact that plenty of PTP parameters need to be set on each PTP node, like BMCA settings, messaging rate intervals, or the PTP communication mode, this leaves plenty of room for human errors.
Also, once in operation, PTP behavior can change over time: GPS reception failure, issues with PTP grandmaster devices, as well as with any boundary clocks, problems that can occur in the network (e.g. network congestion or asymmetry leading to missing or corrupted PTP messages or increased packet delay variation).
PTP Under Control
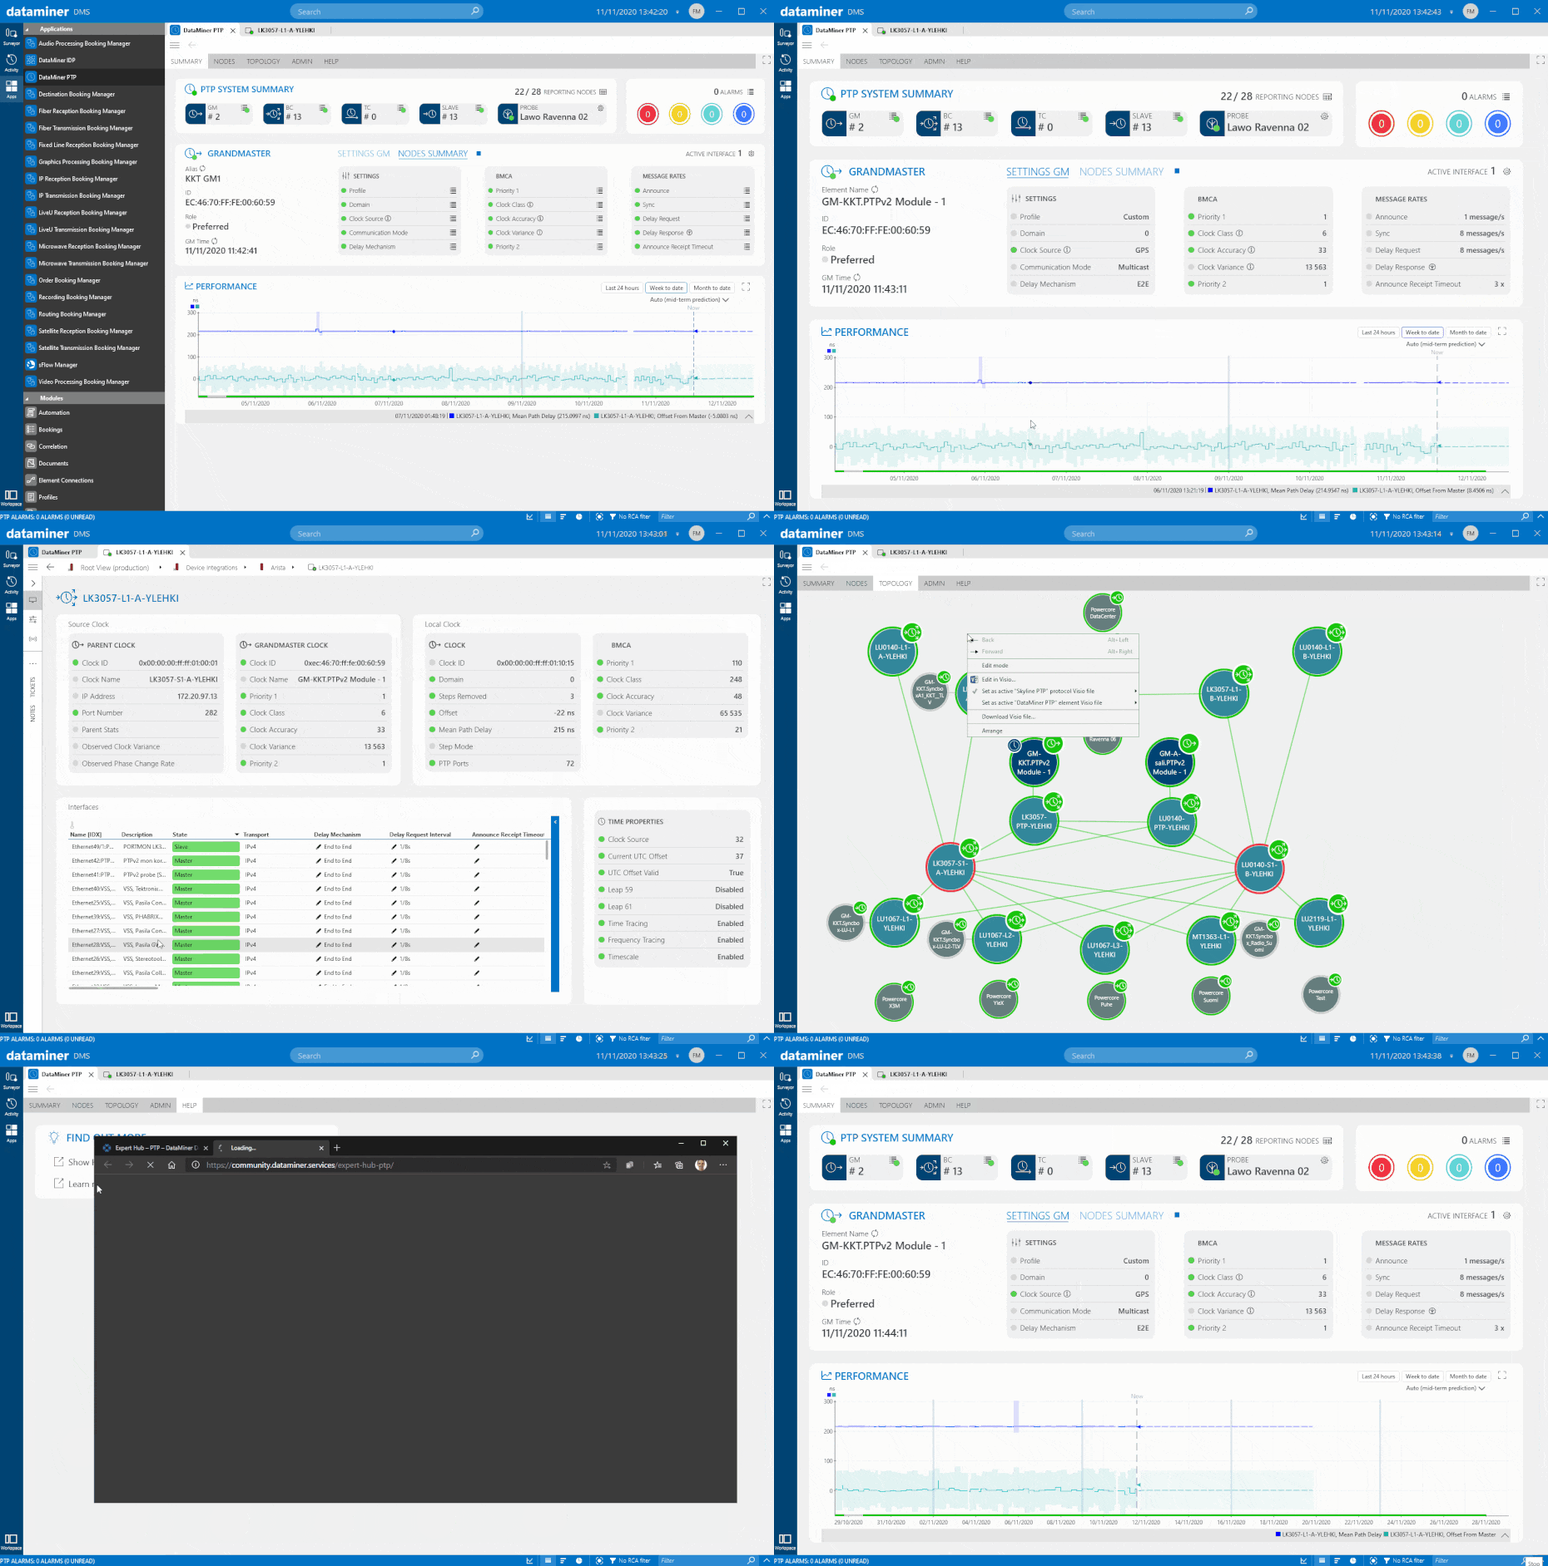
As is clear to see, it is key to first automate the PTP configuration process as much as possible and afterward monitor every PTP node including the PTP network traffic thoroughly. This includes every single PTP metric on all grandmasters, boundary clocks and PTP slaves to get a full picture on the PTP performance of all PTP nodes and the network as well as the PTP messaging rate statistics of each PTP port to easily detect network degradations.
A 360° PTP monitoring solution should also apply additional PTP security mechanisms, such as to prevent PTP slave devices from becoming a PTP grandmaster. Some slave devices support a “Slave Only” flag. Additional security can be achieved by using the Acceptable Master Tables (AMT) from the IEEE1588 standard to ensure that PTP nodes only accept PTP Announcement Messages from validated sources. Another solution is offered by switch vendors and allows to set a PTP interface on a boundary clock to “PTP role master”. The latter blocks unwanted PTP announcement messages on ports where only slave devices will be connected.
A good PTP monitoring solution combines all the above features, supports any vendor and protocol, and offers an easy-to-use operator interface to troubleshoot the overall PTP system.
If you have any questions about PTP monitoring and management, don’t hesitate to send an email to thomas.gunkel@skyline.be.
You might also like
* Please note that you need to be logged in to access our use case & video library: in the top-right corner of the screen, click LOG IN and authenticate yourself with your corporate email address.


