example Use Case
Meinberg Network Management System (mbgNMS)
Meinberg
The Meinberg Network Management System (mbgNMS) is an out-of-the-box solution tailored specifically to manage, monitor and control an entire Meinberg ecosystem end to end.
Key functionalities include:
- inventory and device management
- configuration management
- firmware management
- monitoring & control
Have a look at this use case to learn more about the Meinberg Network Management System. And for more information, check out our Meinberg partner page.
USE CASE DETAILS
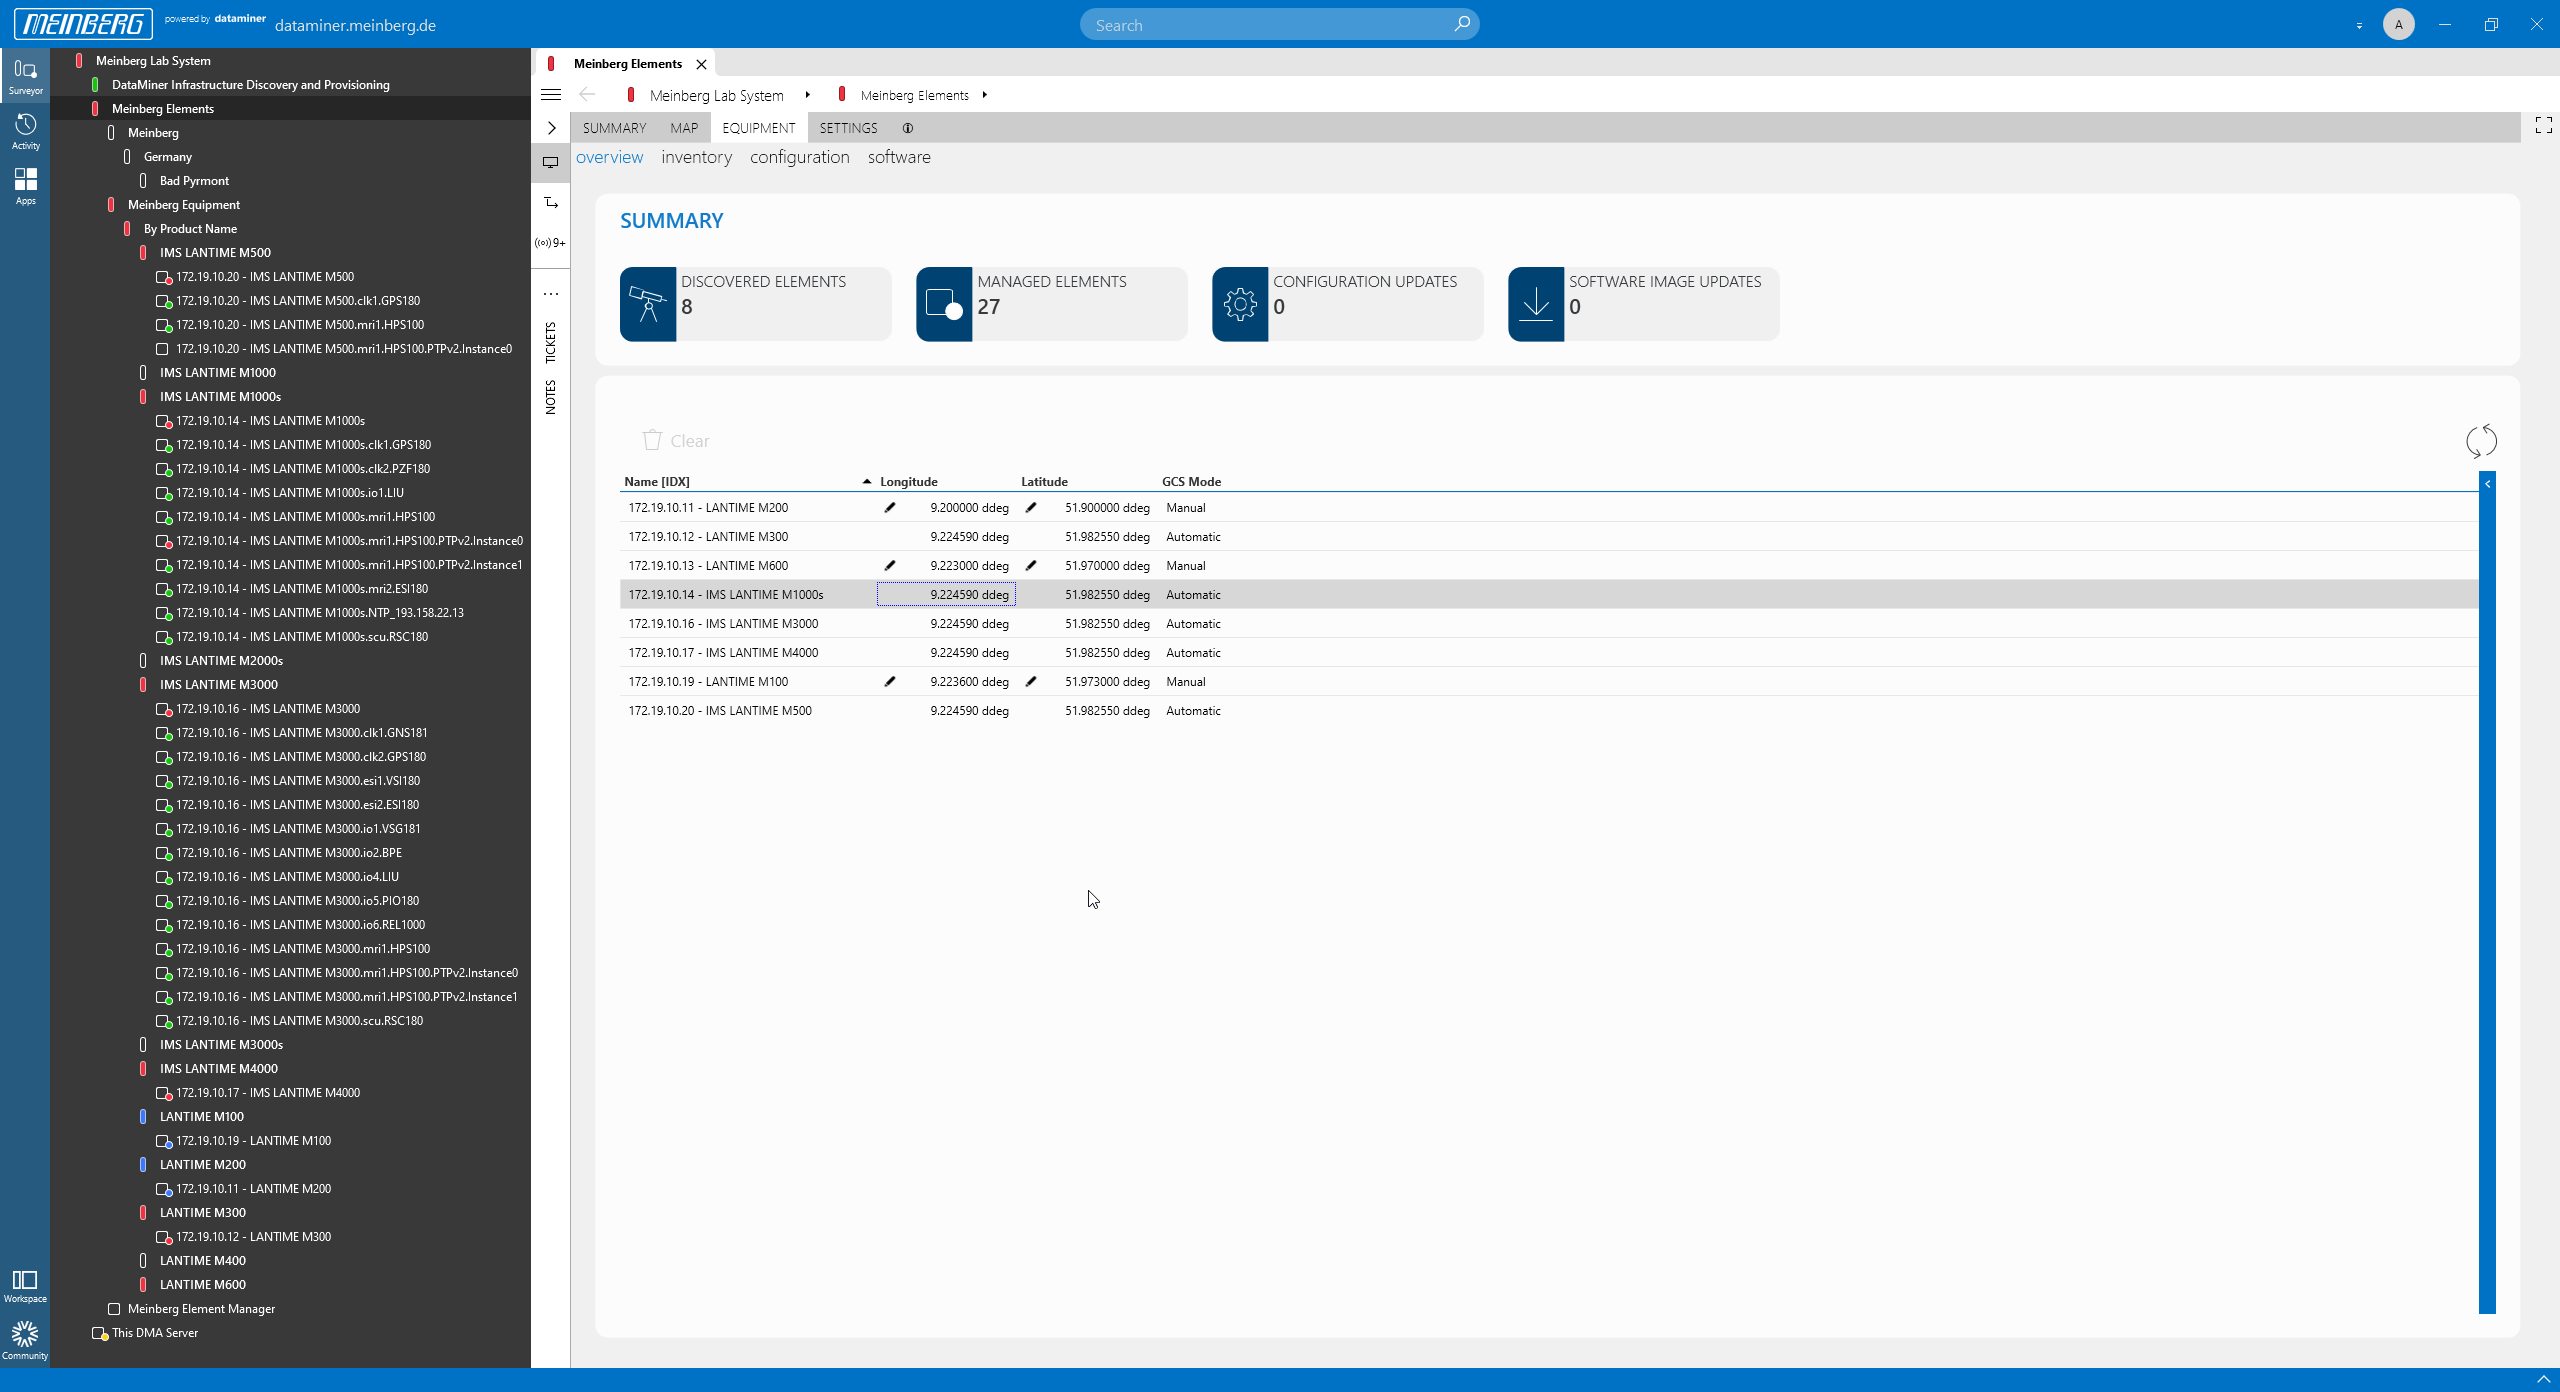
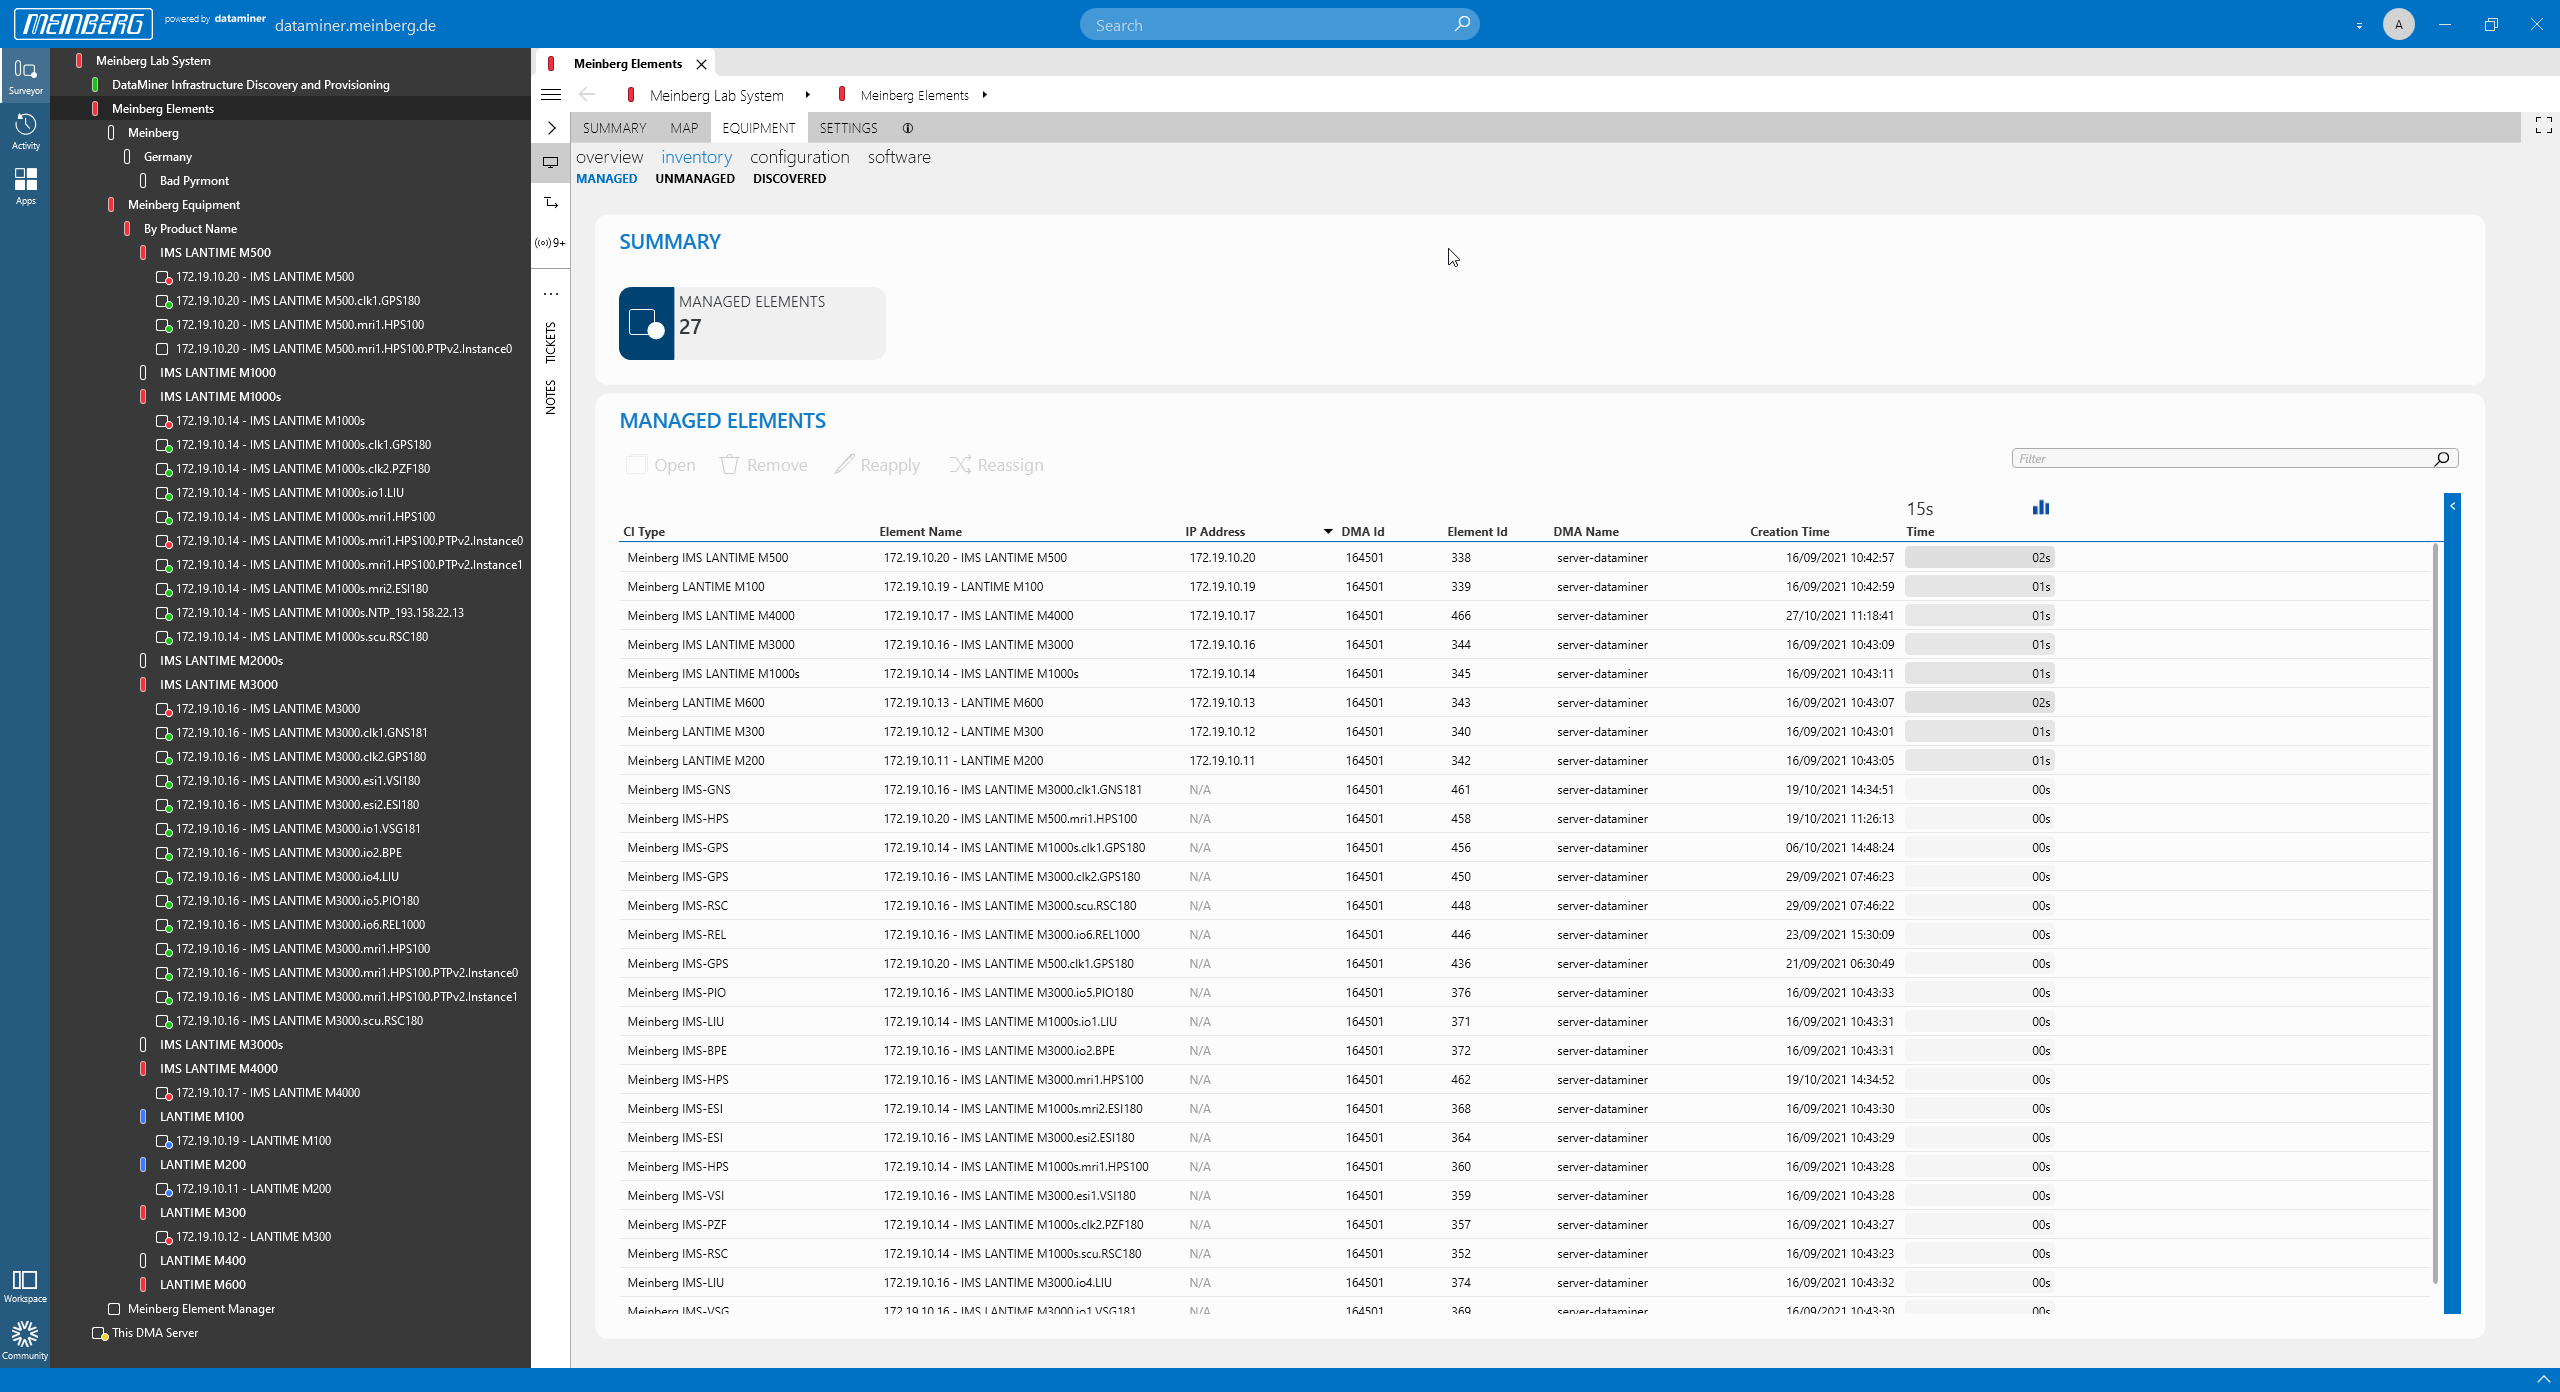 Before we look into the monitoring and control functionality, let's start with the automatic device detection, provisioning, configuration and firmware management.
The "managed" inventory page shows all devices and cards that have already been automatically detected and added (provisioned) to DataMiner.
Before we look into the monitoring and control functionality, let's start with the automatic device detection, provisioning, configuration and firmware management.
The "managed" inventory page shows all devices and cards that have already been automatically detected and added (provisioned) to DataMiner.
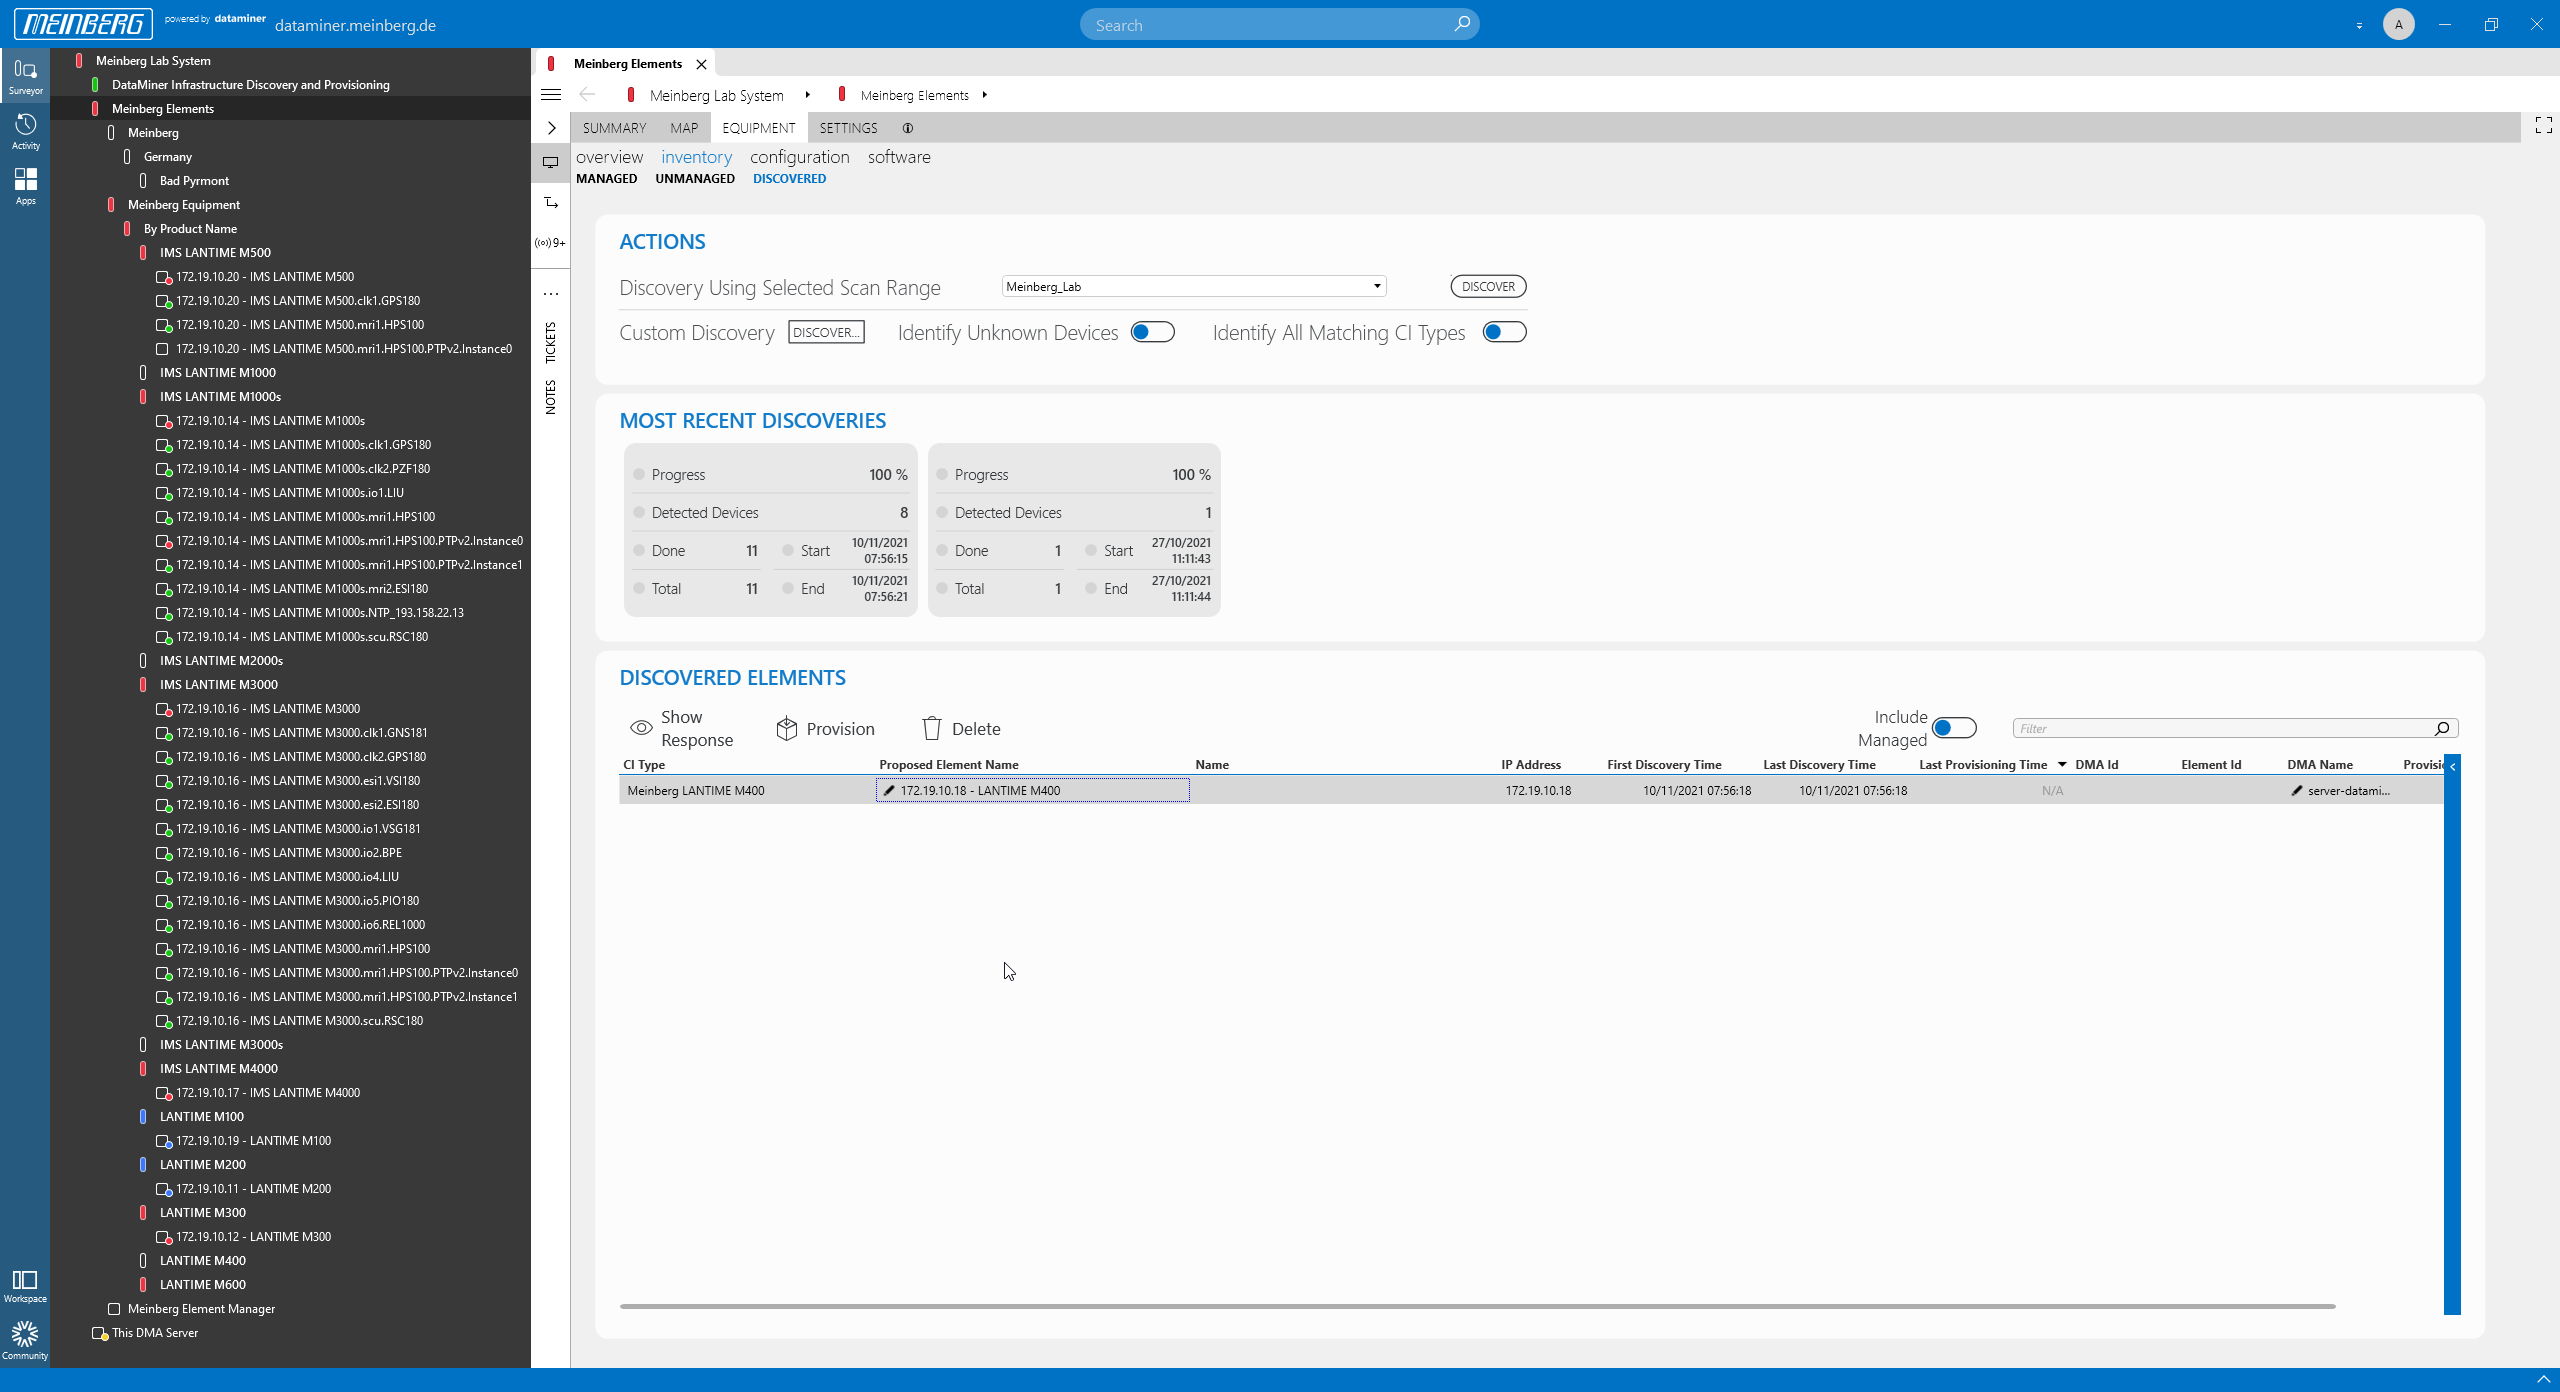 To discover new Meinberg devices in your network, either define an IP address range or select one of your templates and click the "Discover" button. In our example, mbgNMS has detected a LANTIME M400 device.
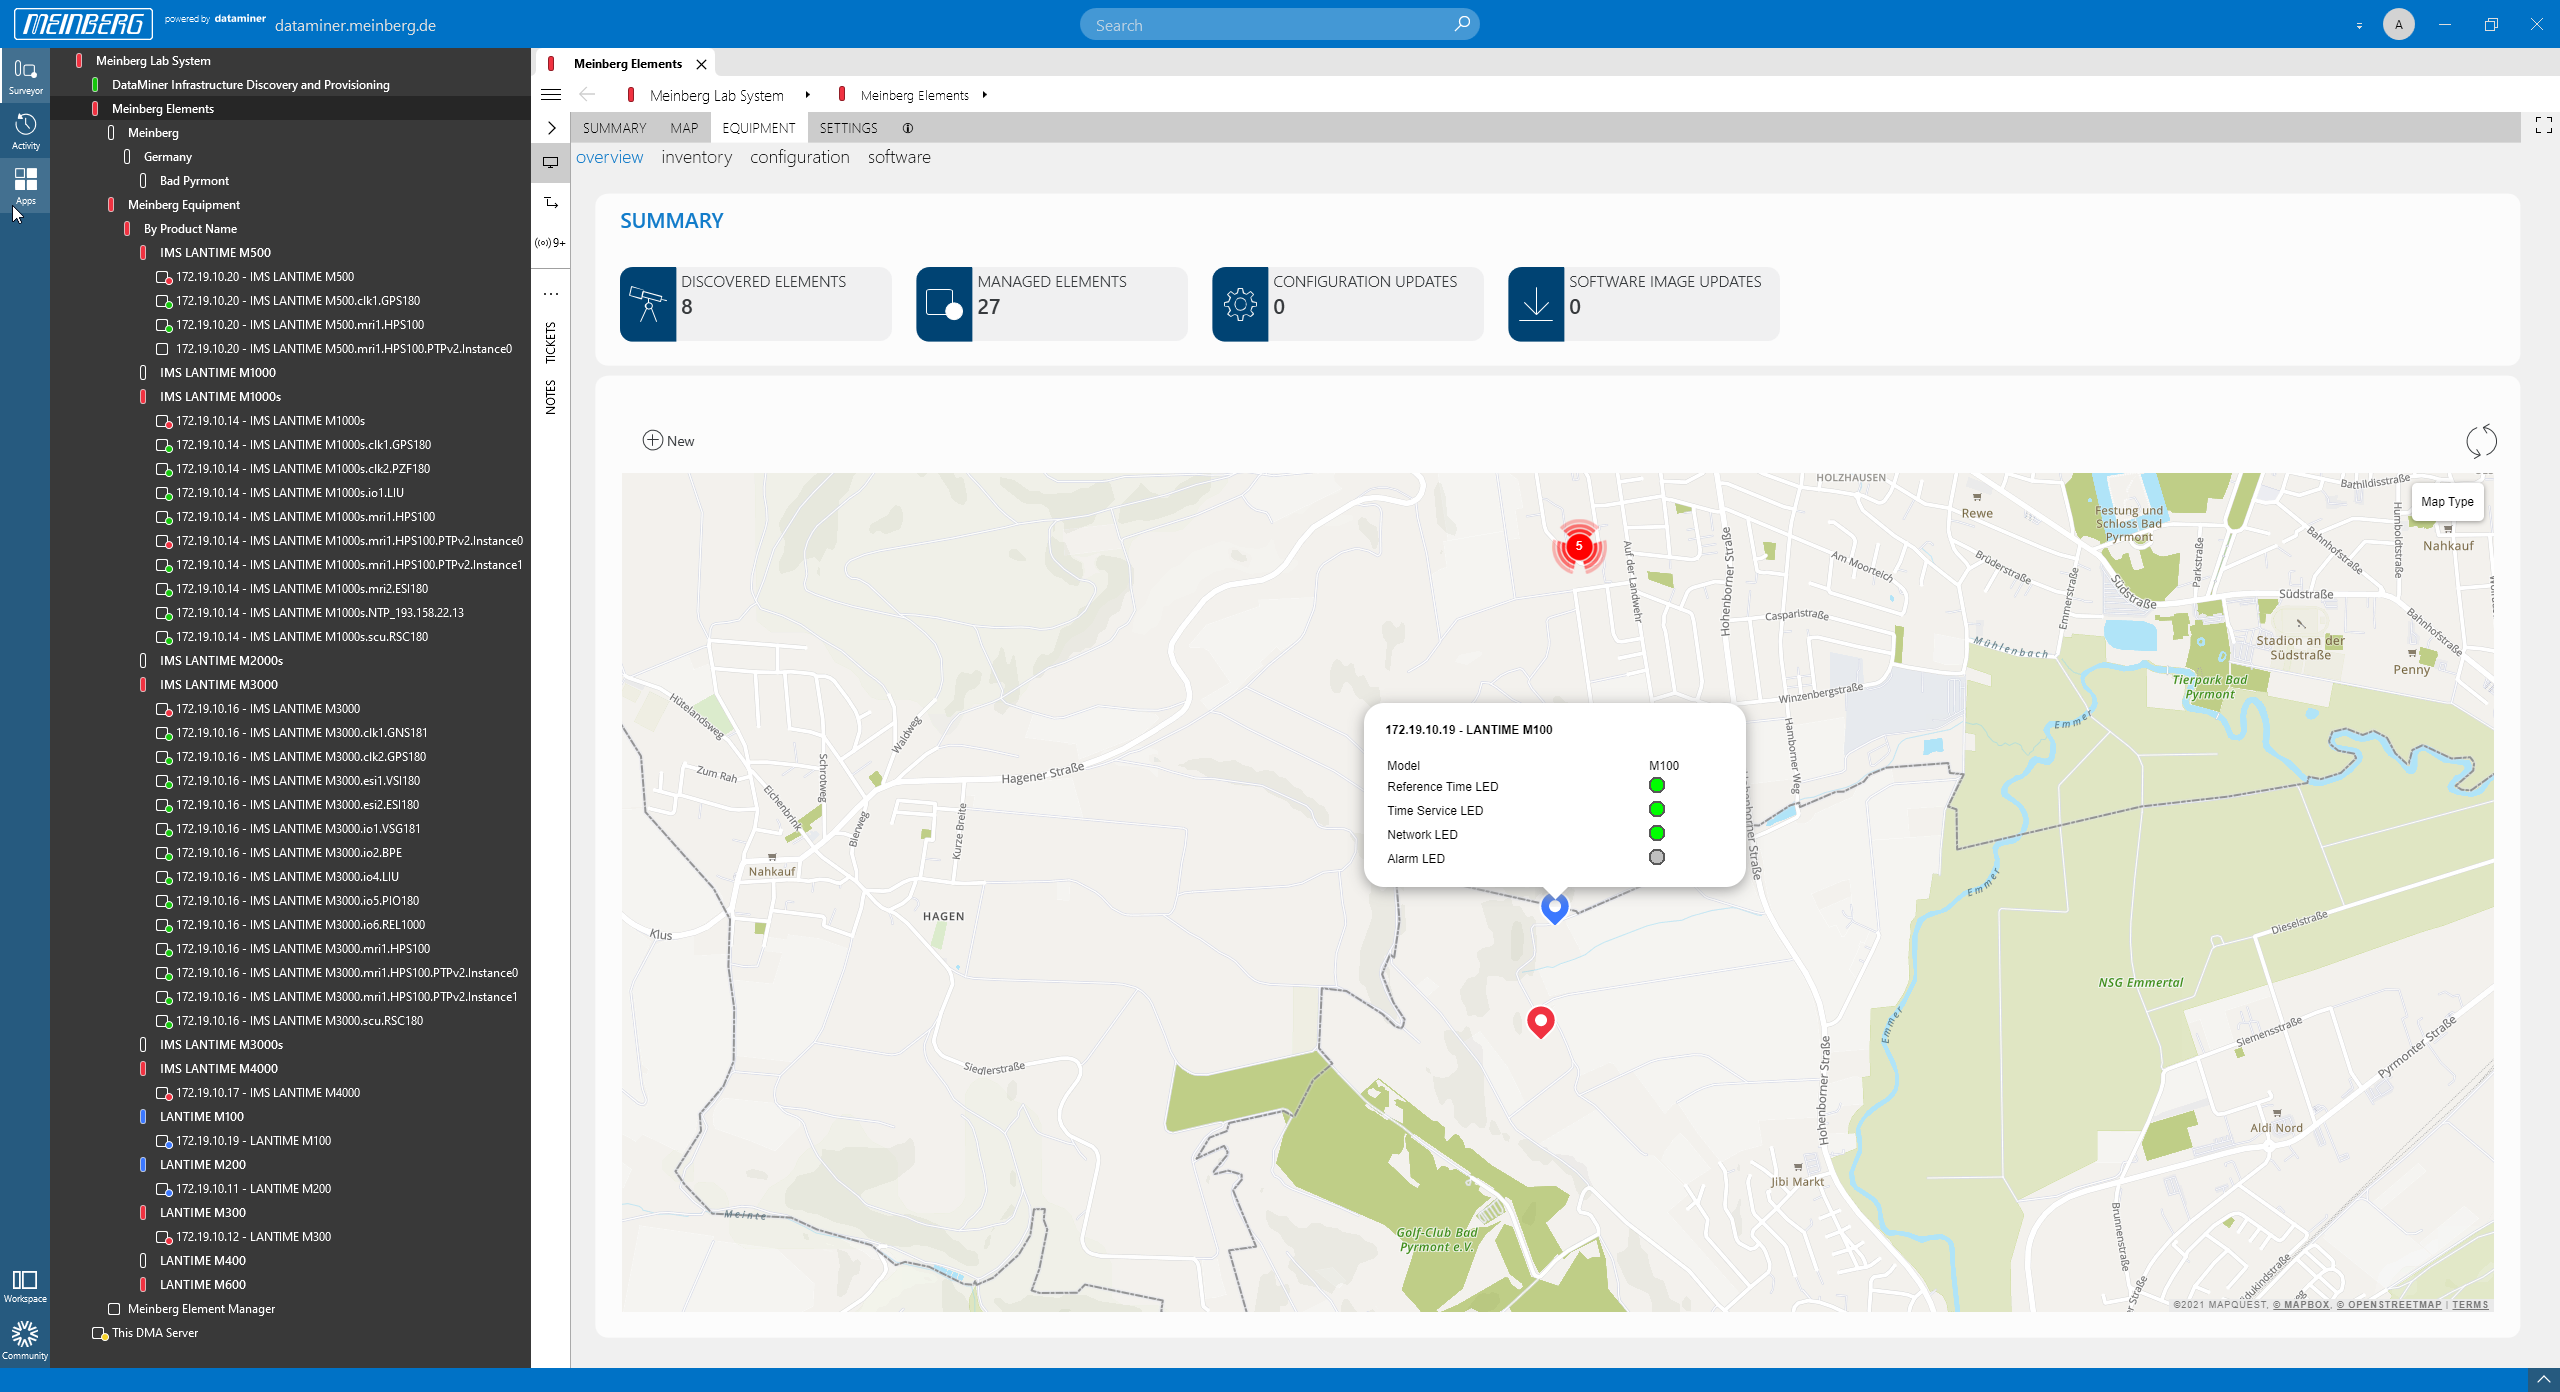 Devices are automatically placed on a map. Hover over the marker to get more information for each device.
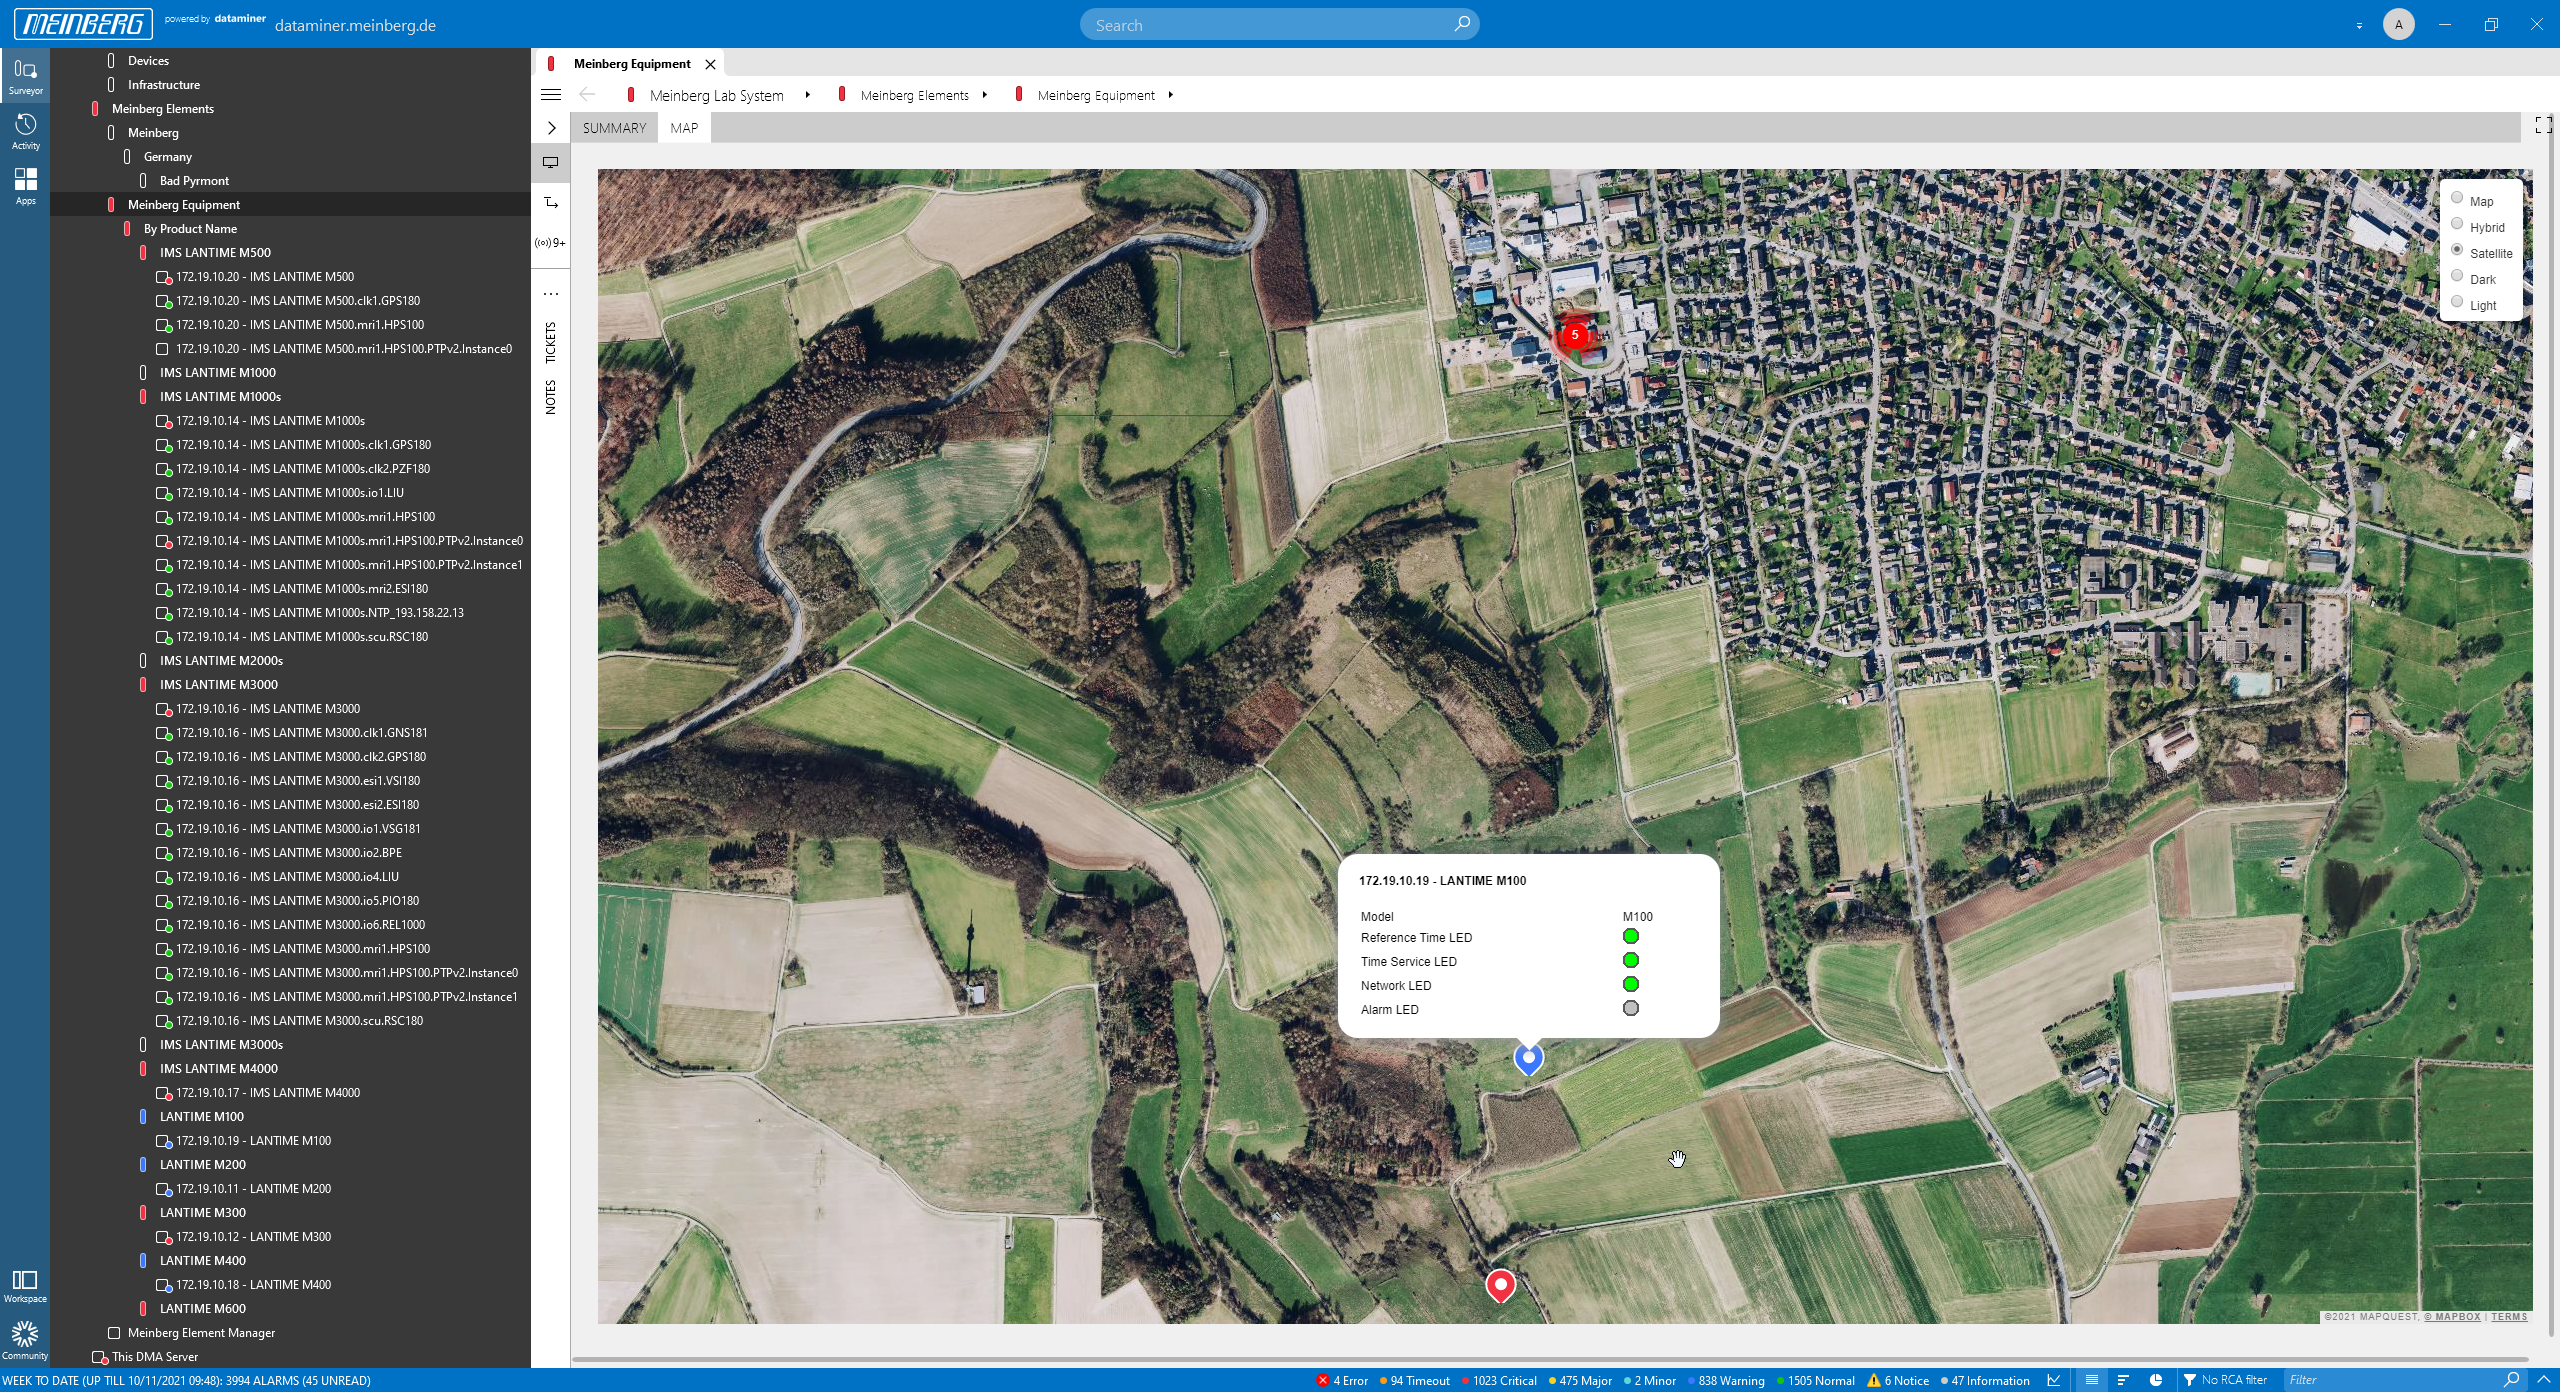 Do you prefer a different map or view? This is included as well.
 If devices do not get their position via the attached GNSS receiver, you can position them manually on the map by simply adding the GPS coordinates.
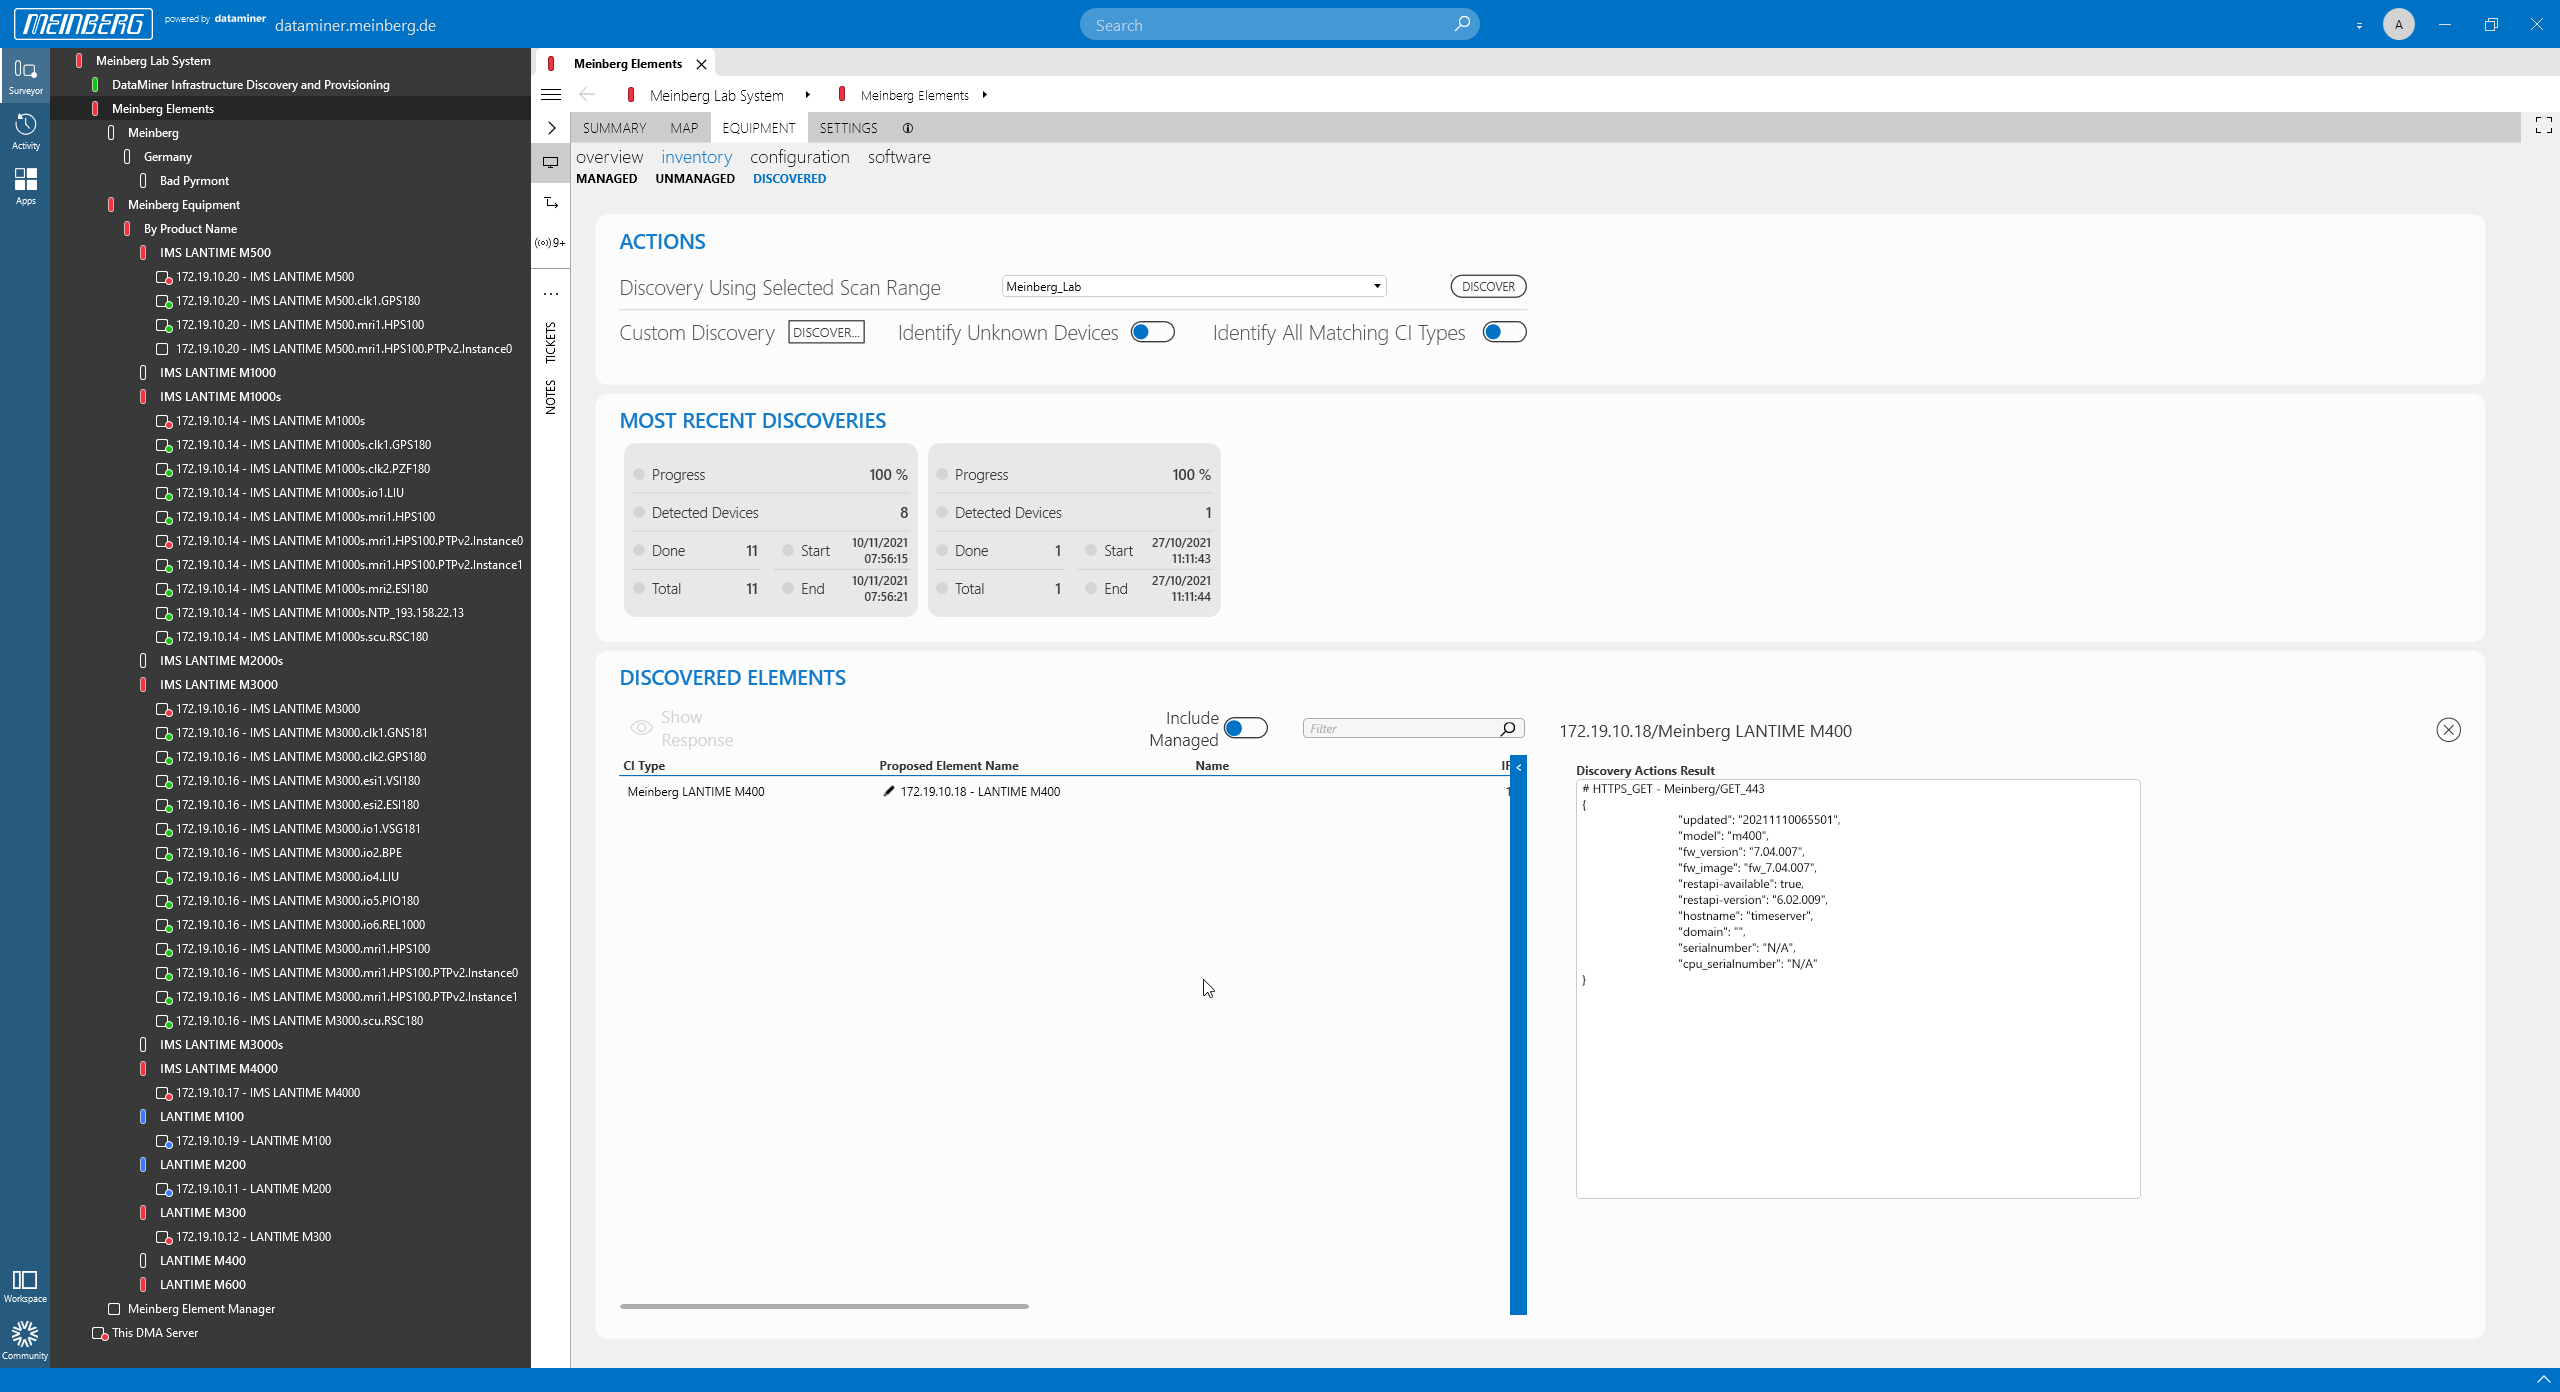 This screenshot shows the HTTP device response. Based on this, the mbgNMS knows the exact Meinberg device type. It can then pick the right protocol, alarm template and trend template, and it also places the new device into the right folder in the Surveyor. All you need to do as a user is click the "Provision" button.
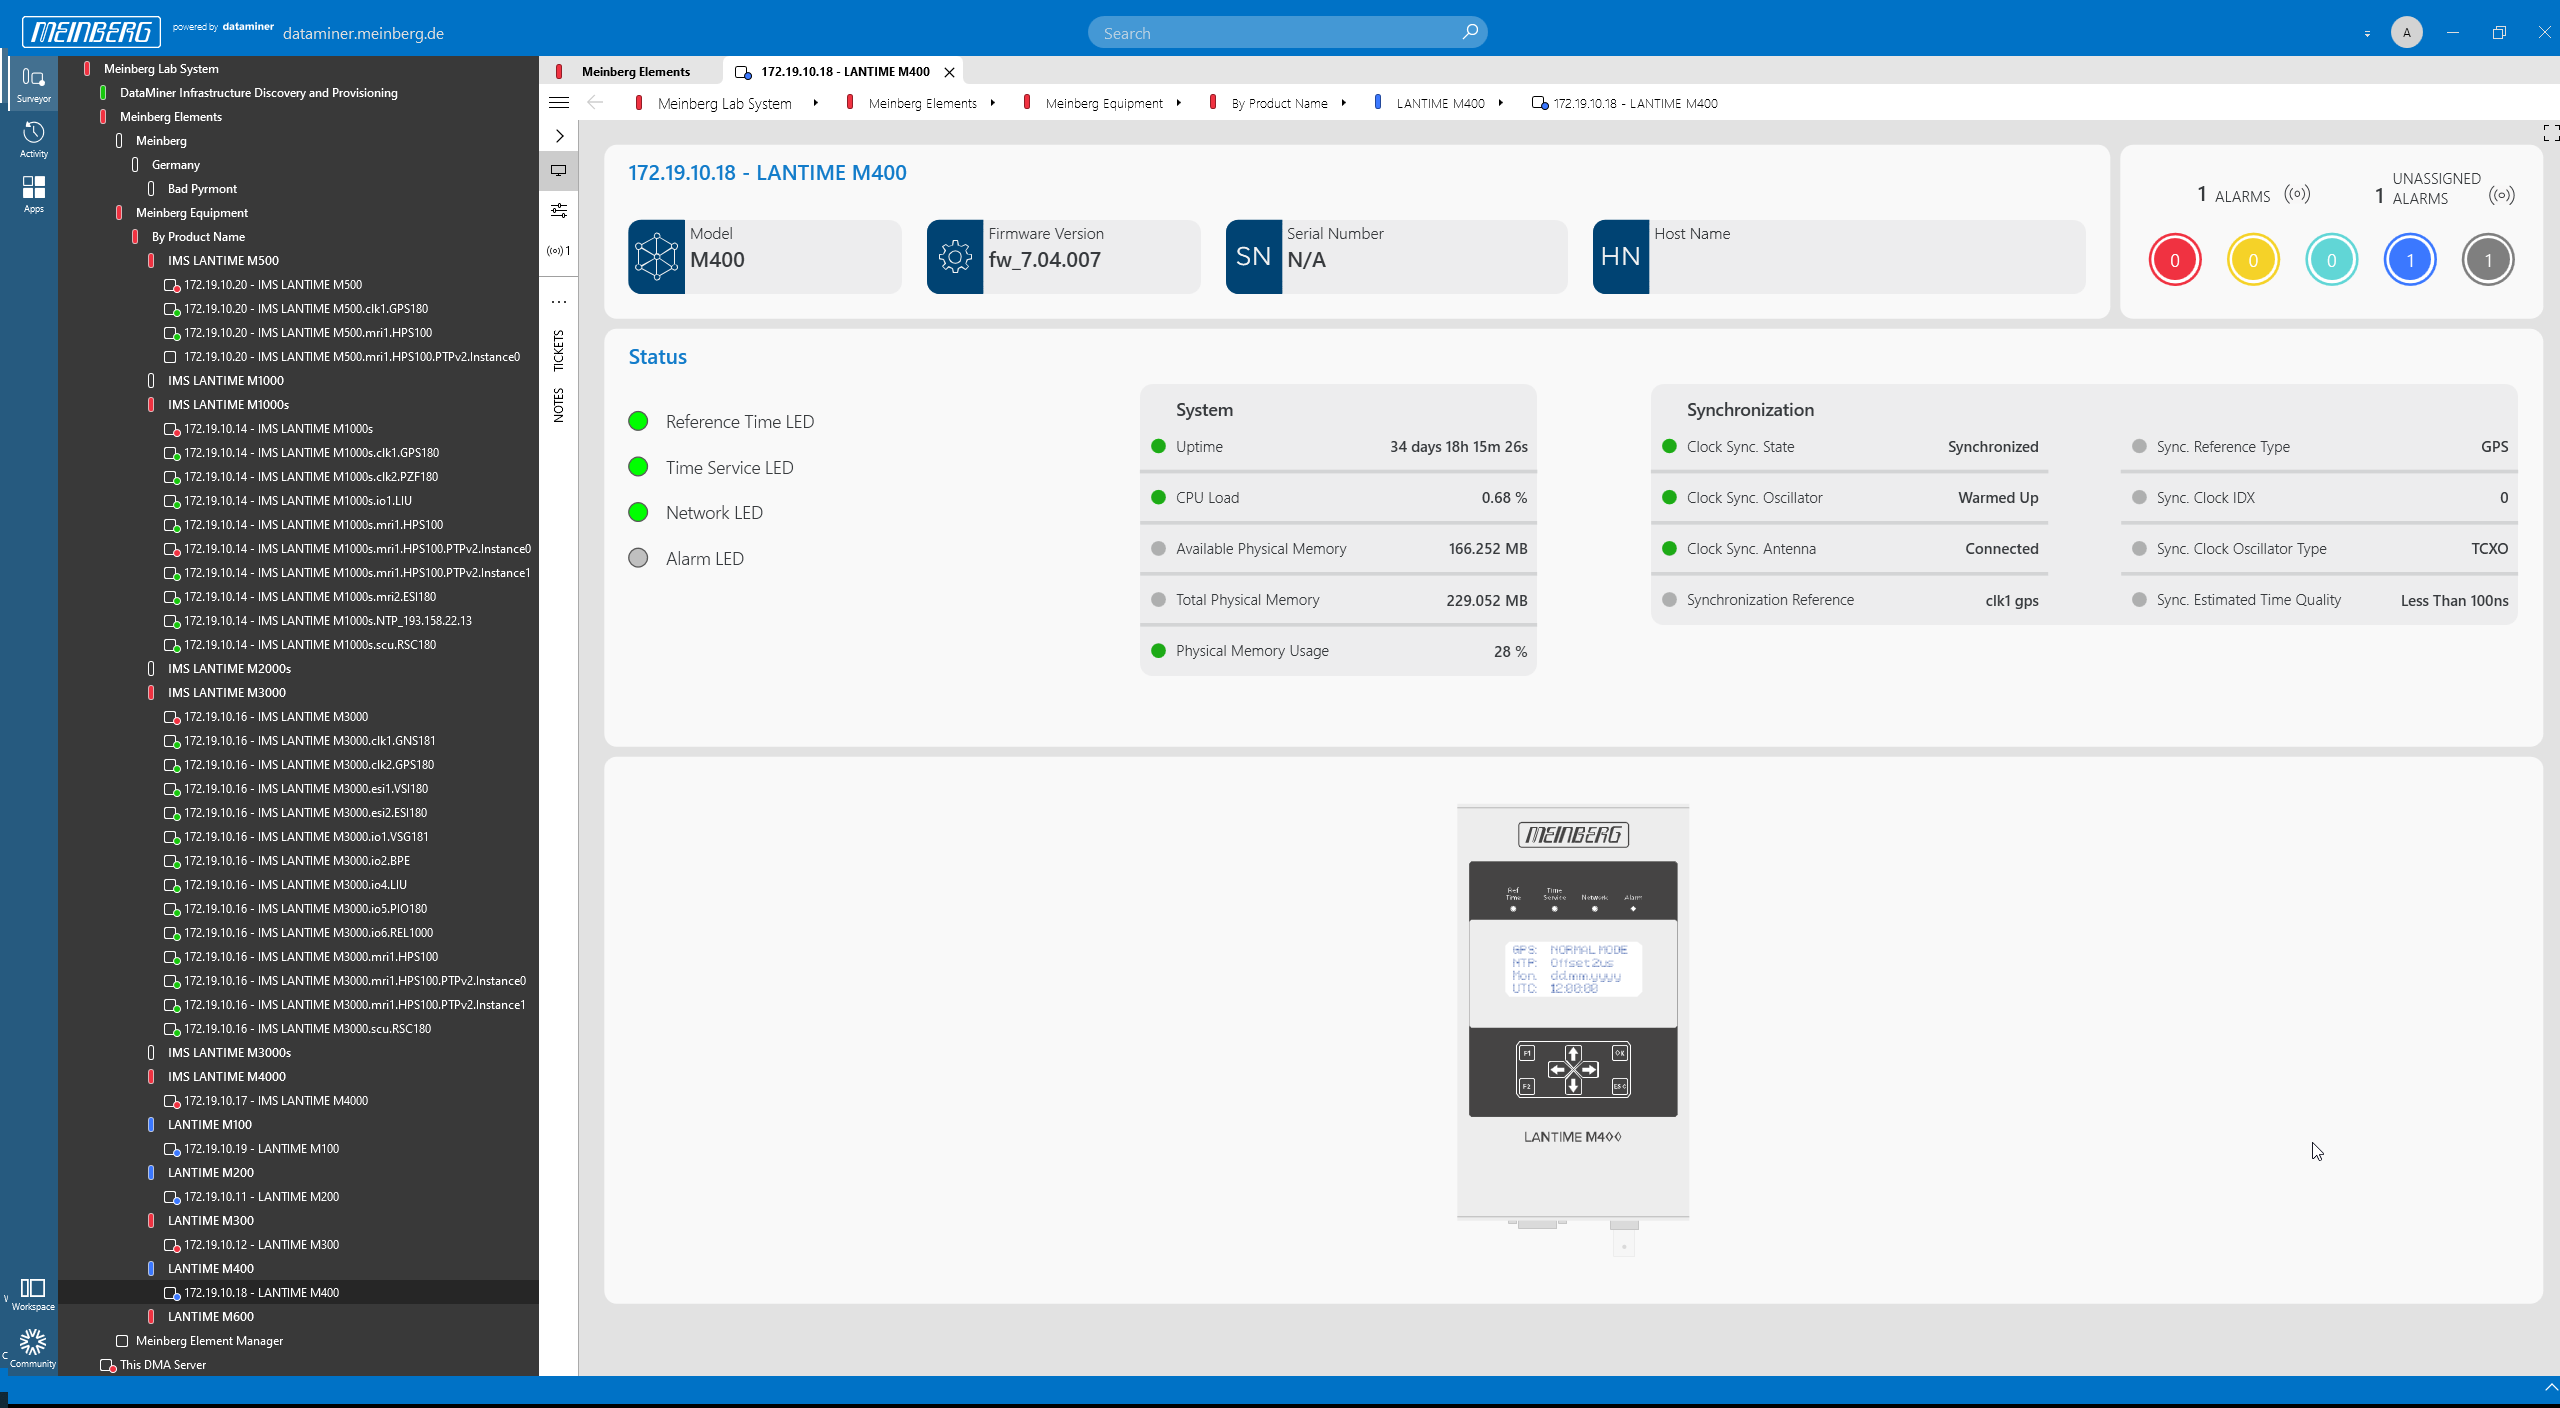 As a result of the provisioning process, the M400 will immediately be monitored and controlled.
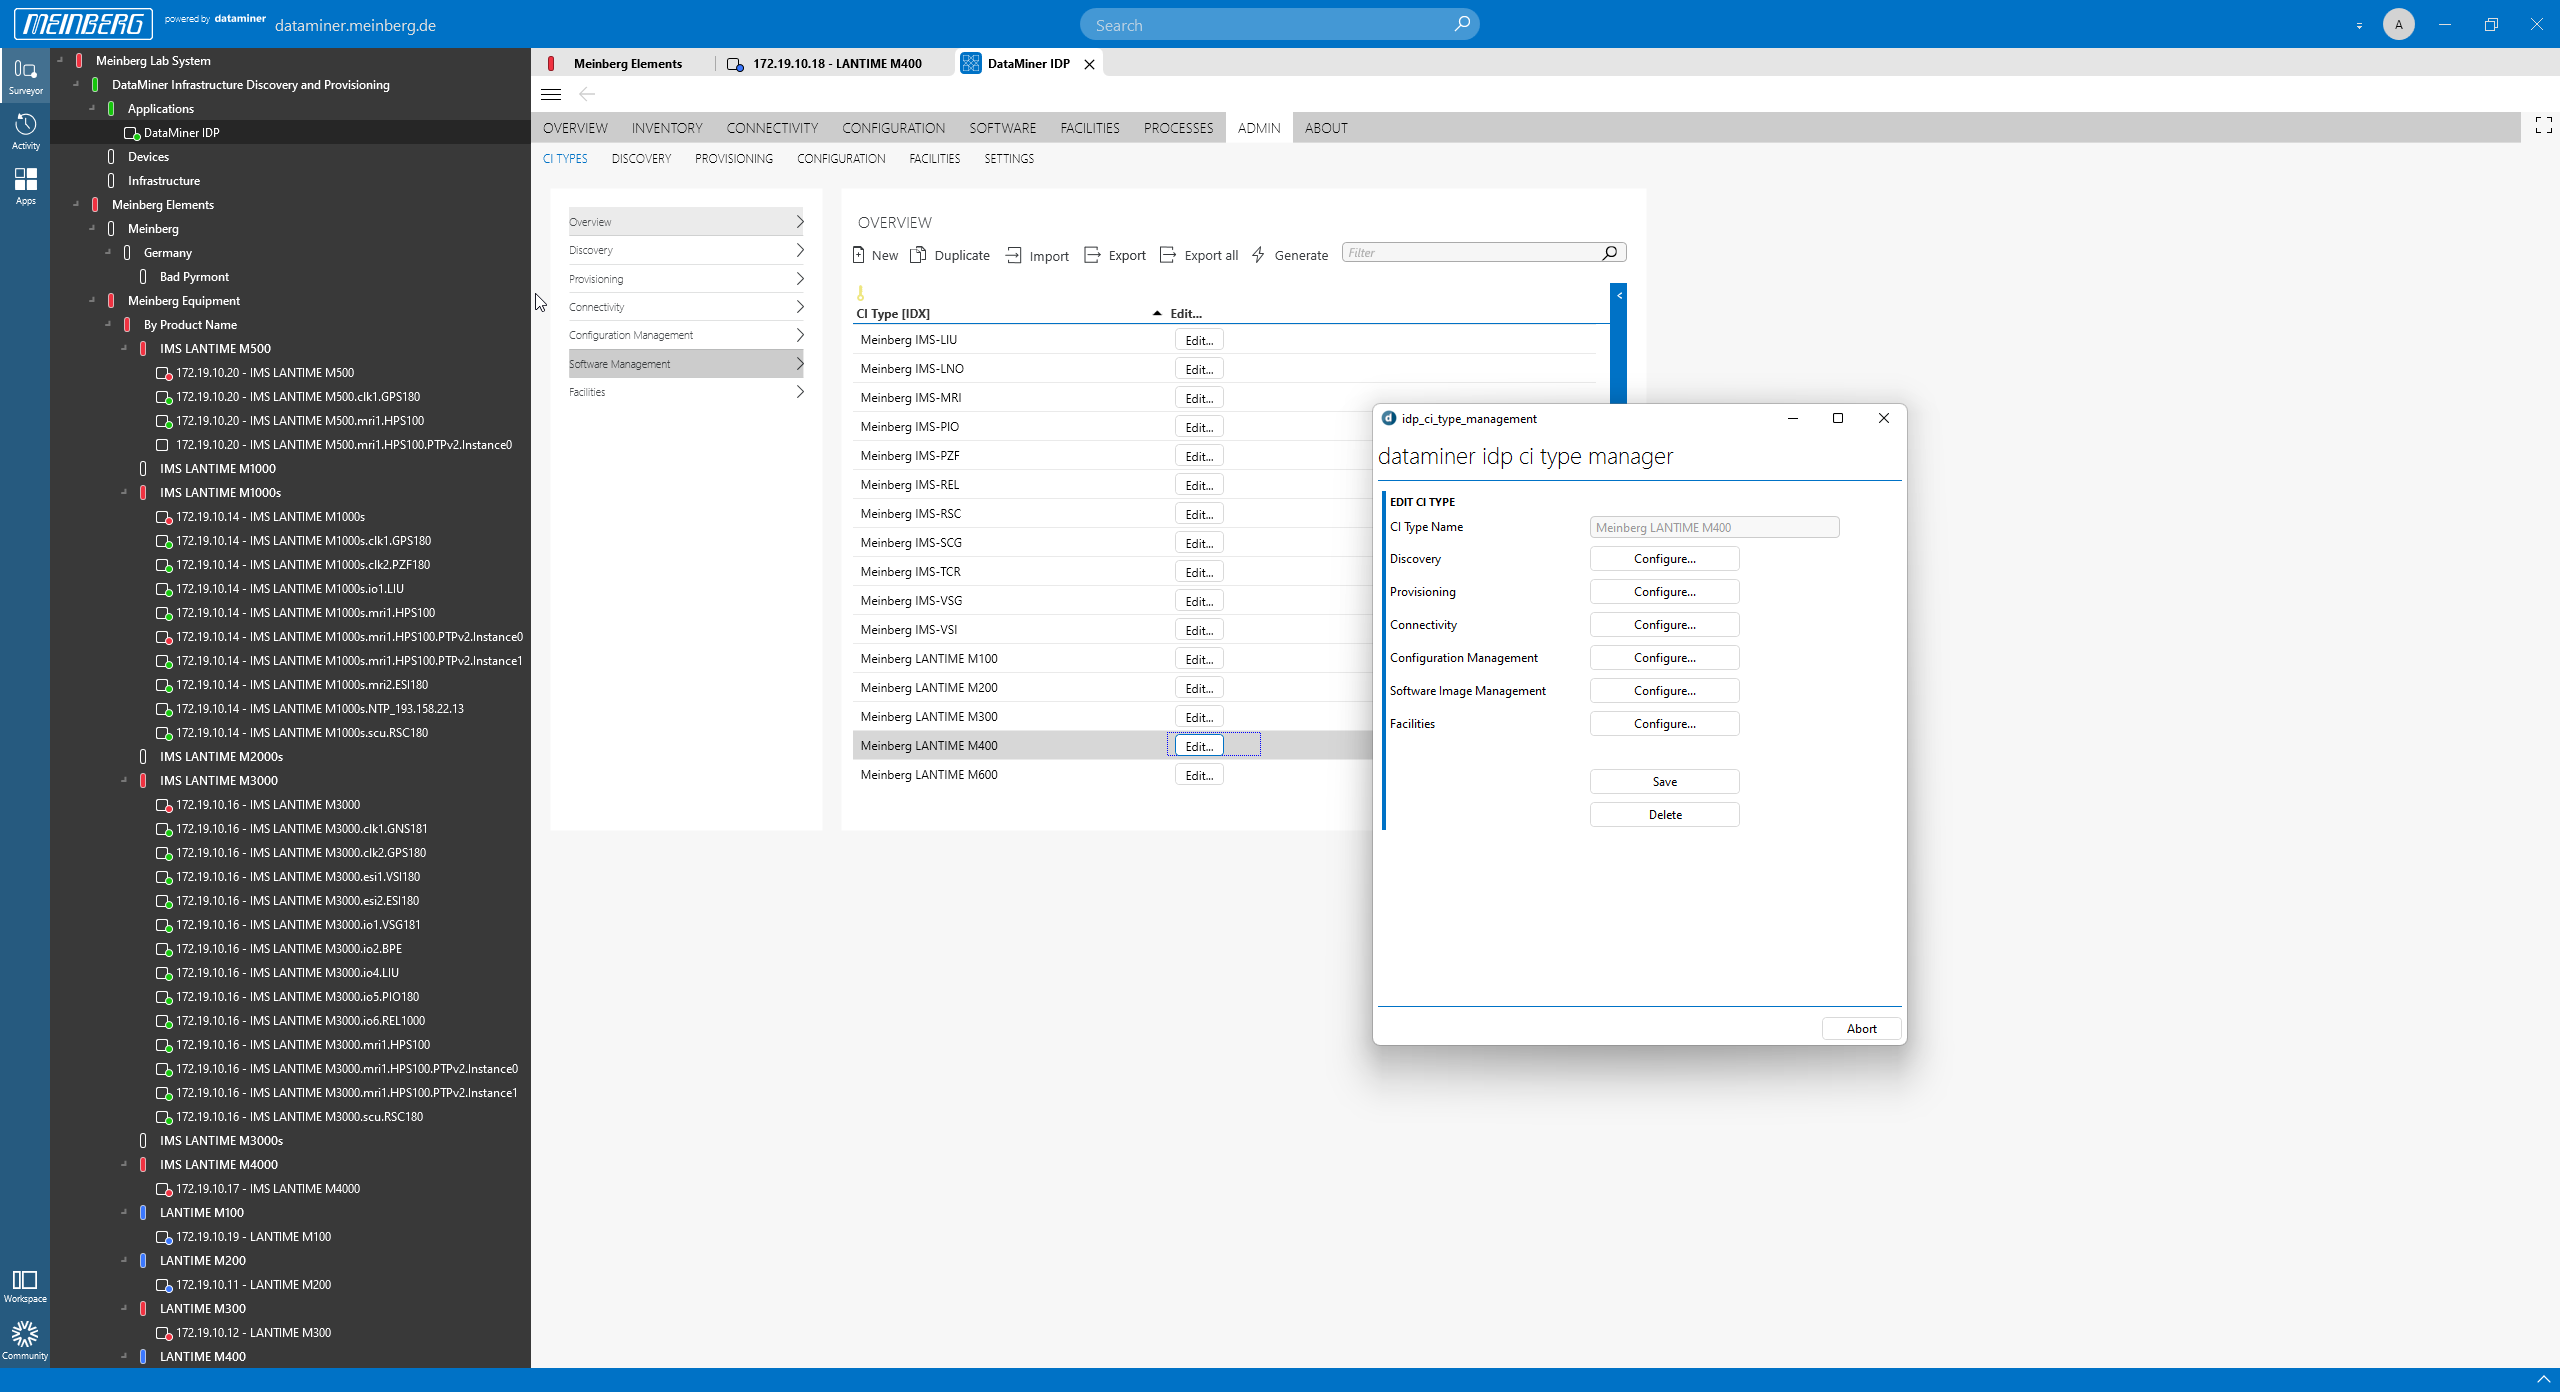 Wondering what happens in the background? The mbgNMS uses configuration items (CI Types) that include a predefined set of rules to automatically discover and provision devices, but also to manage configurations and firmware images. All of this comes preconfigured with every mbgNMS.
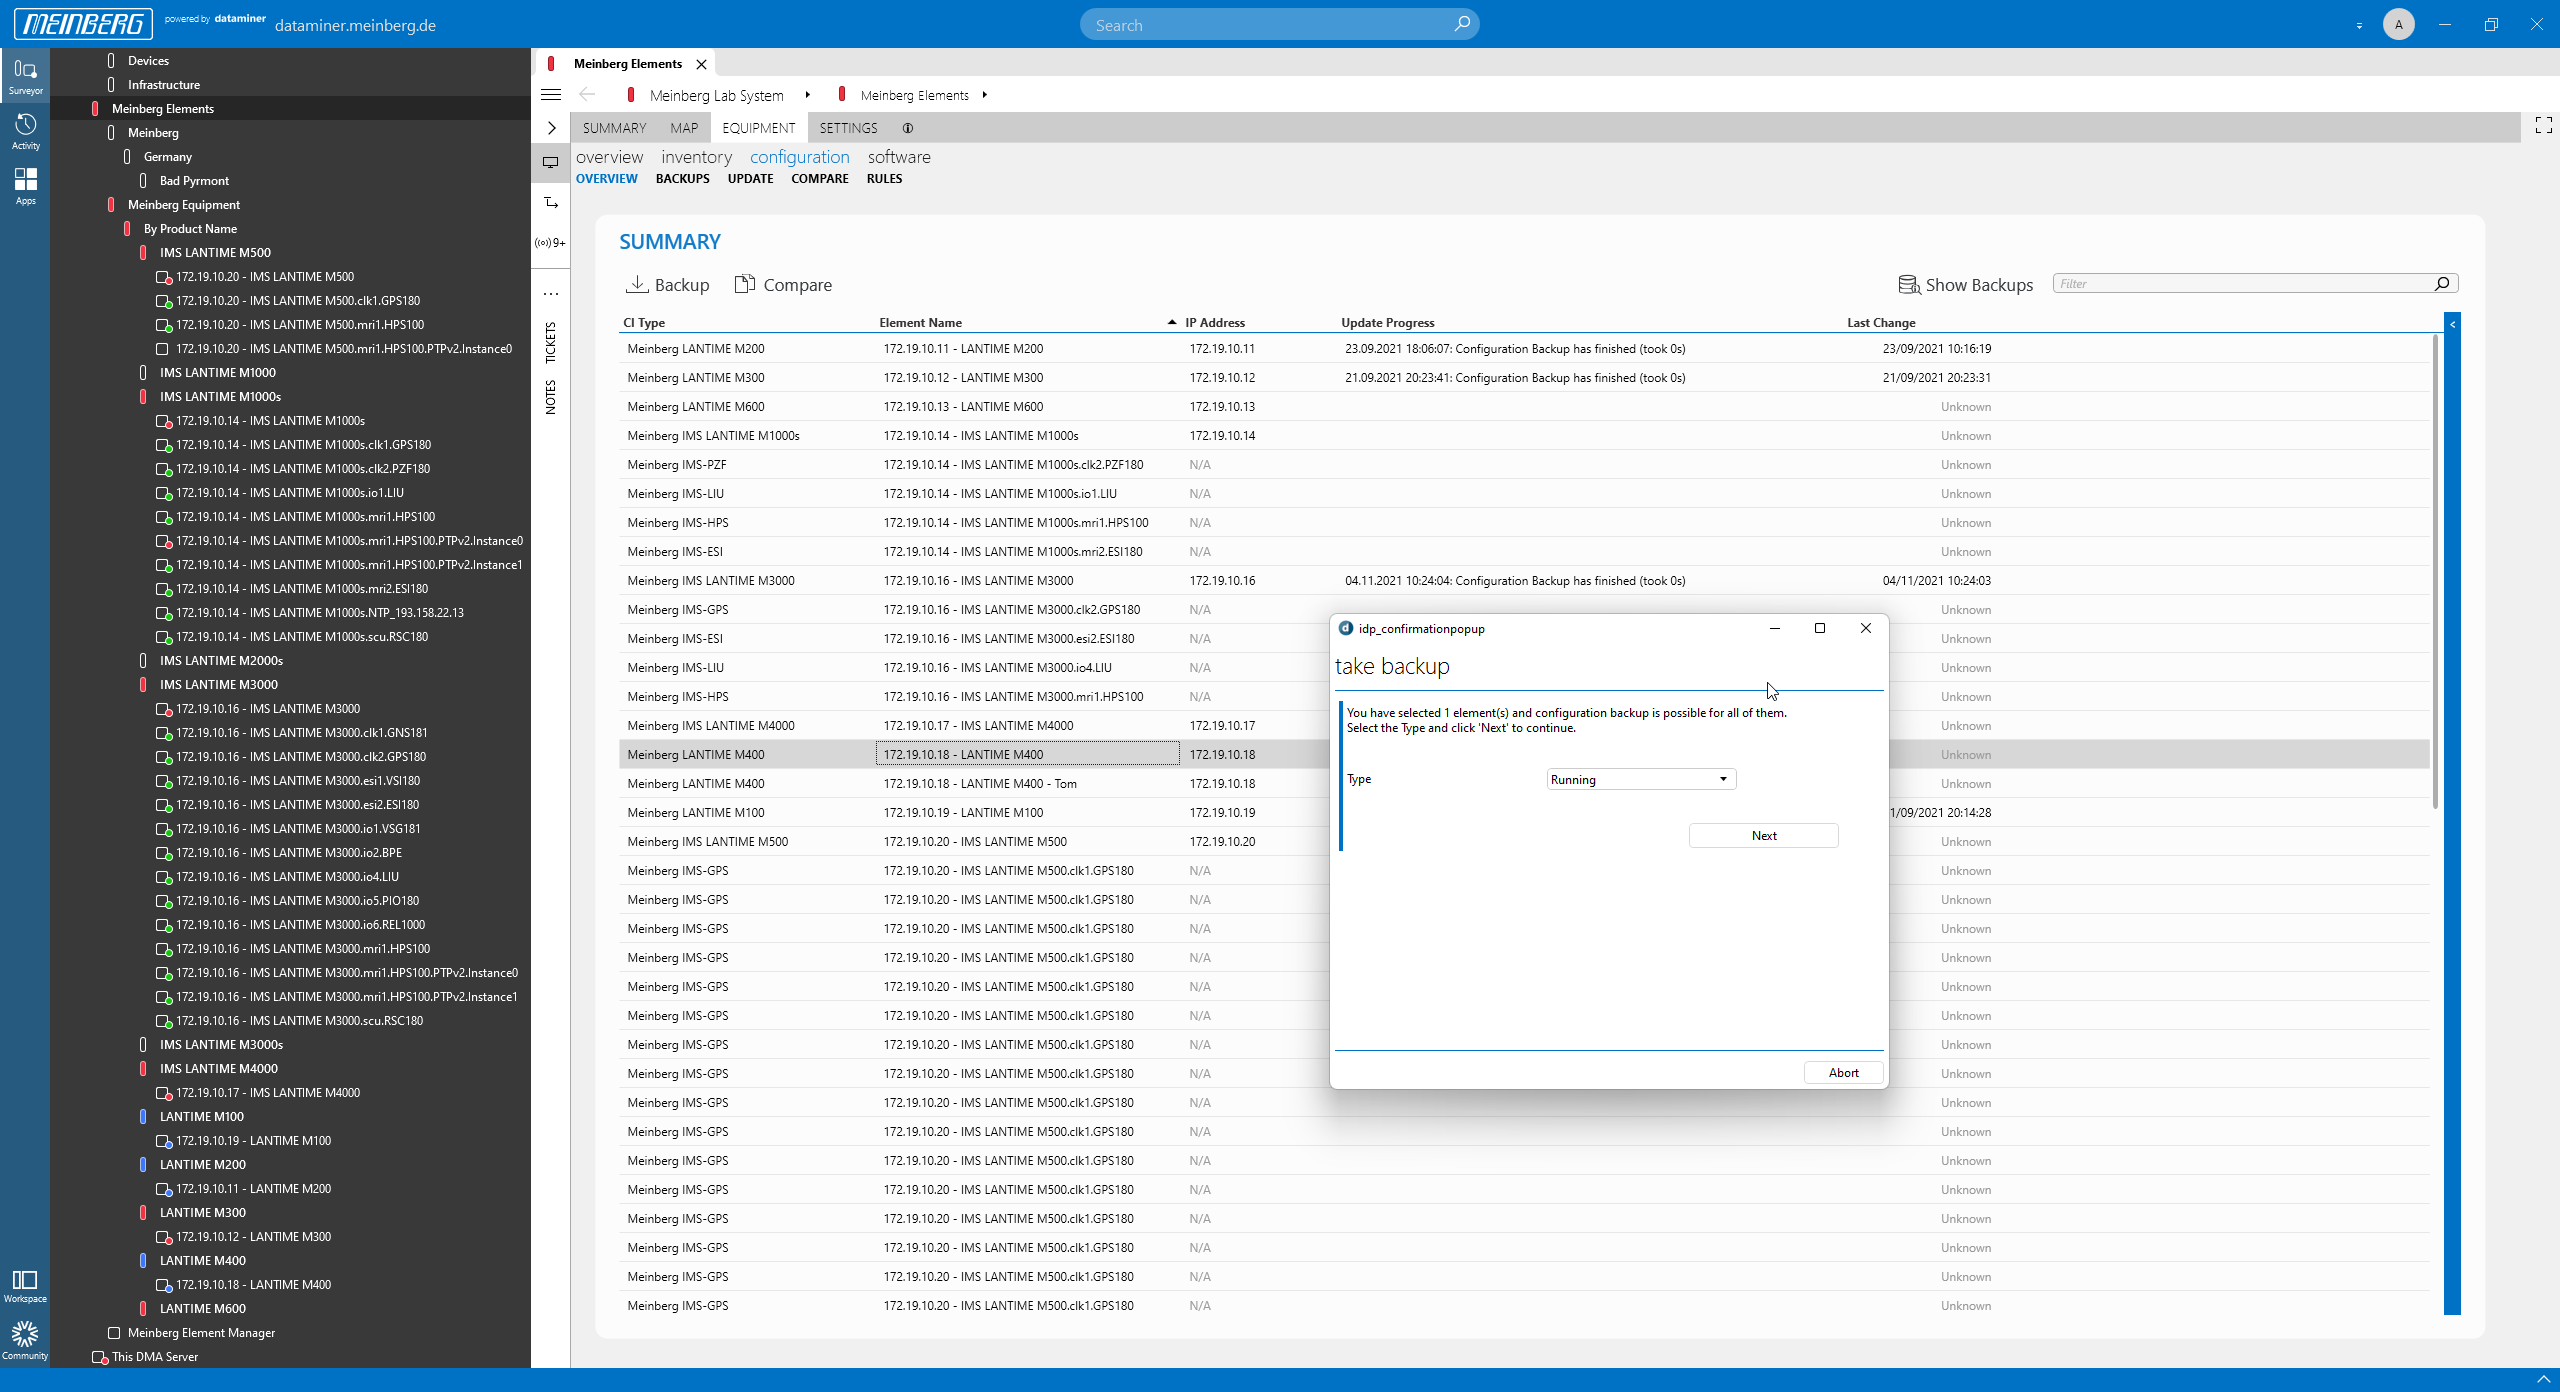 You can take either a "running" or a "golden" backup. While a running backup consists of a full backup of your devices, a "golden" backup usually only includes a subset of your configuration. The latter is especially used for mass configuration of many devices of the same type, for example to apply the same NTP server settings with a single click.
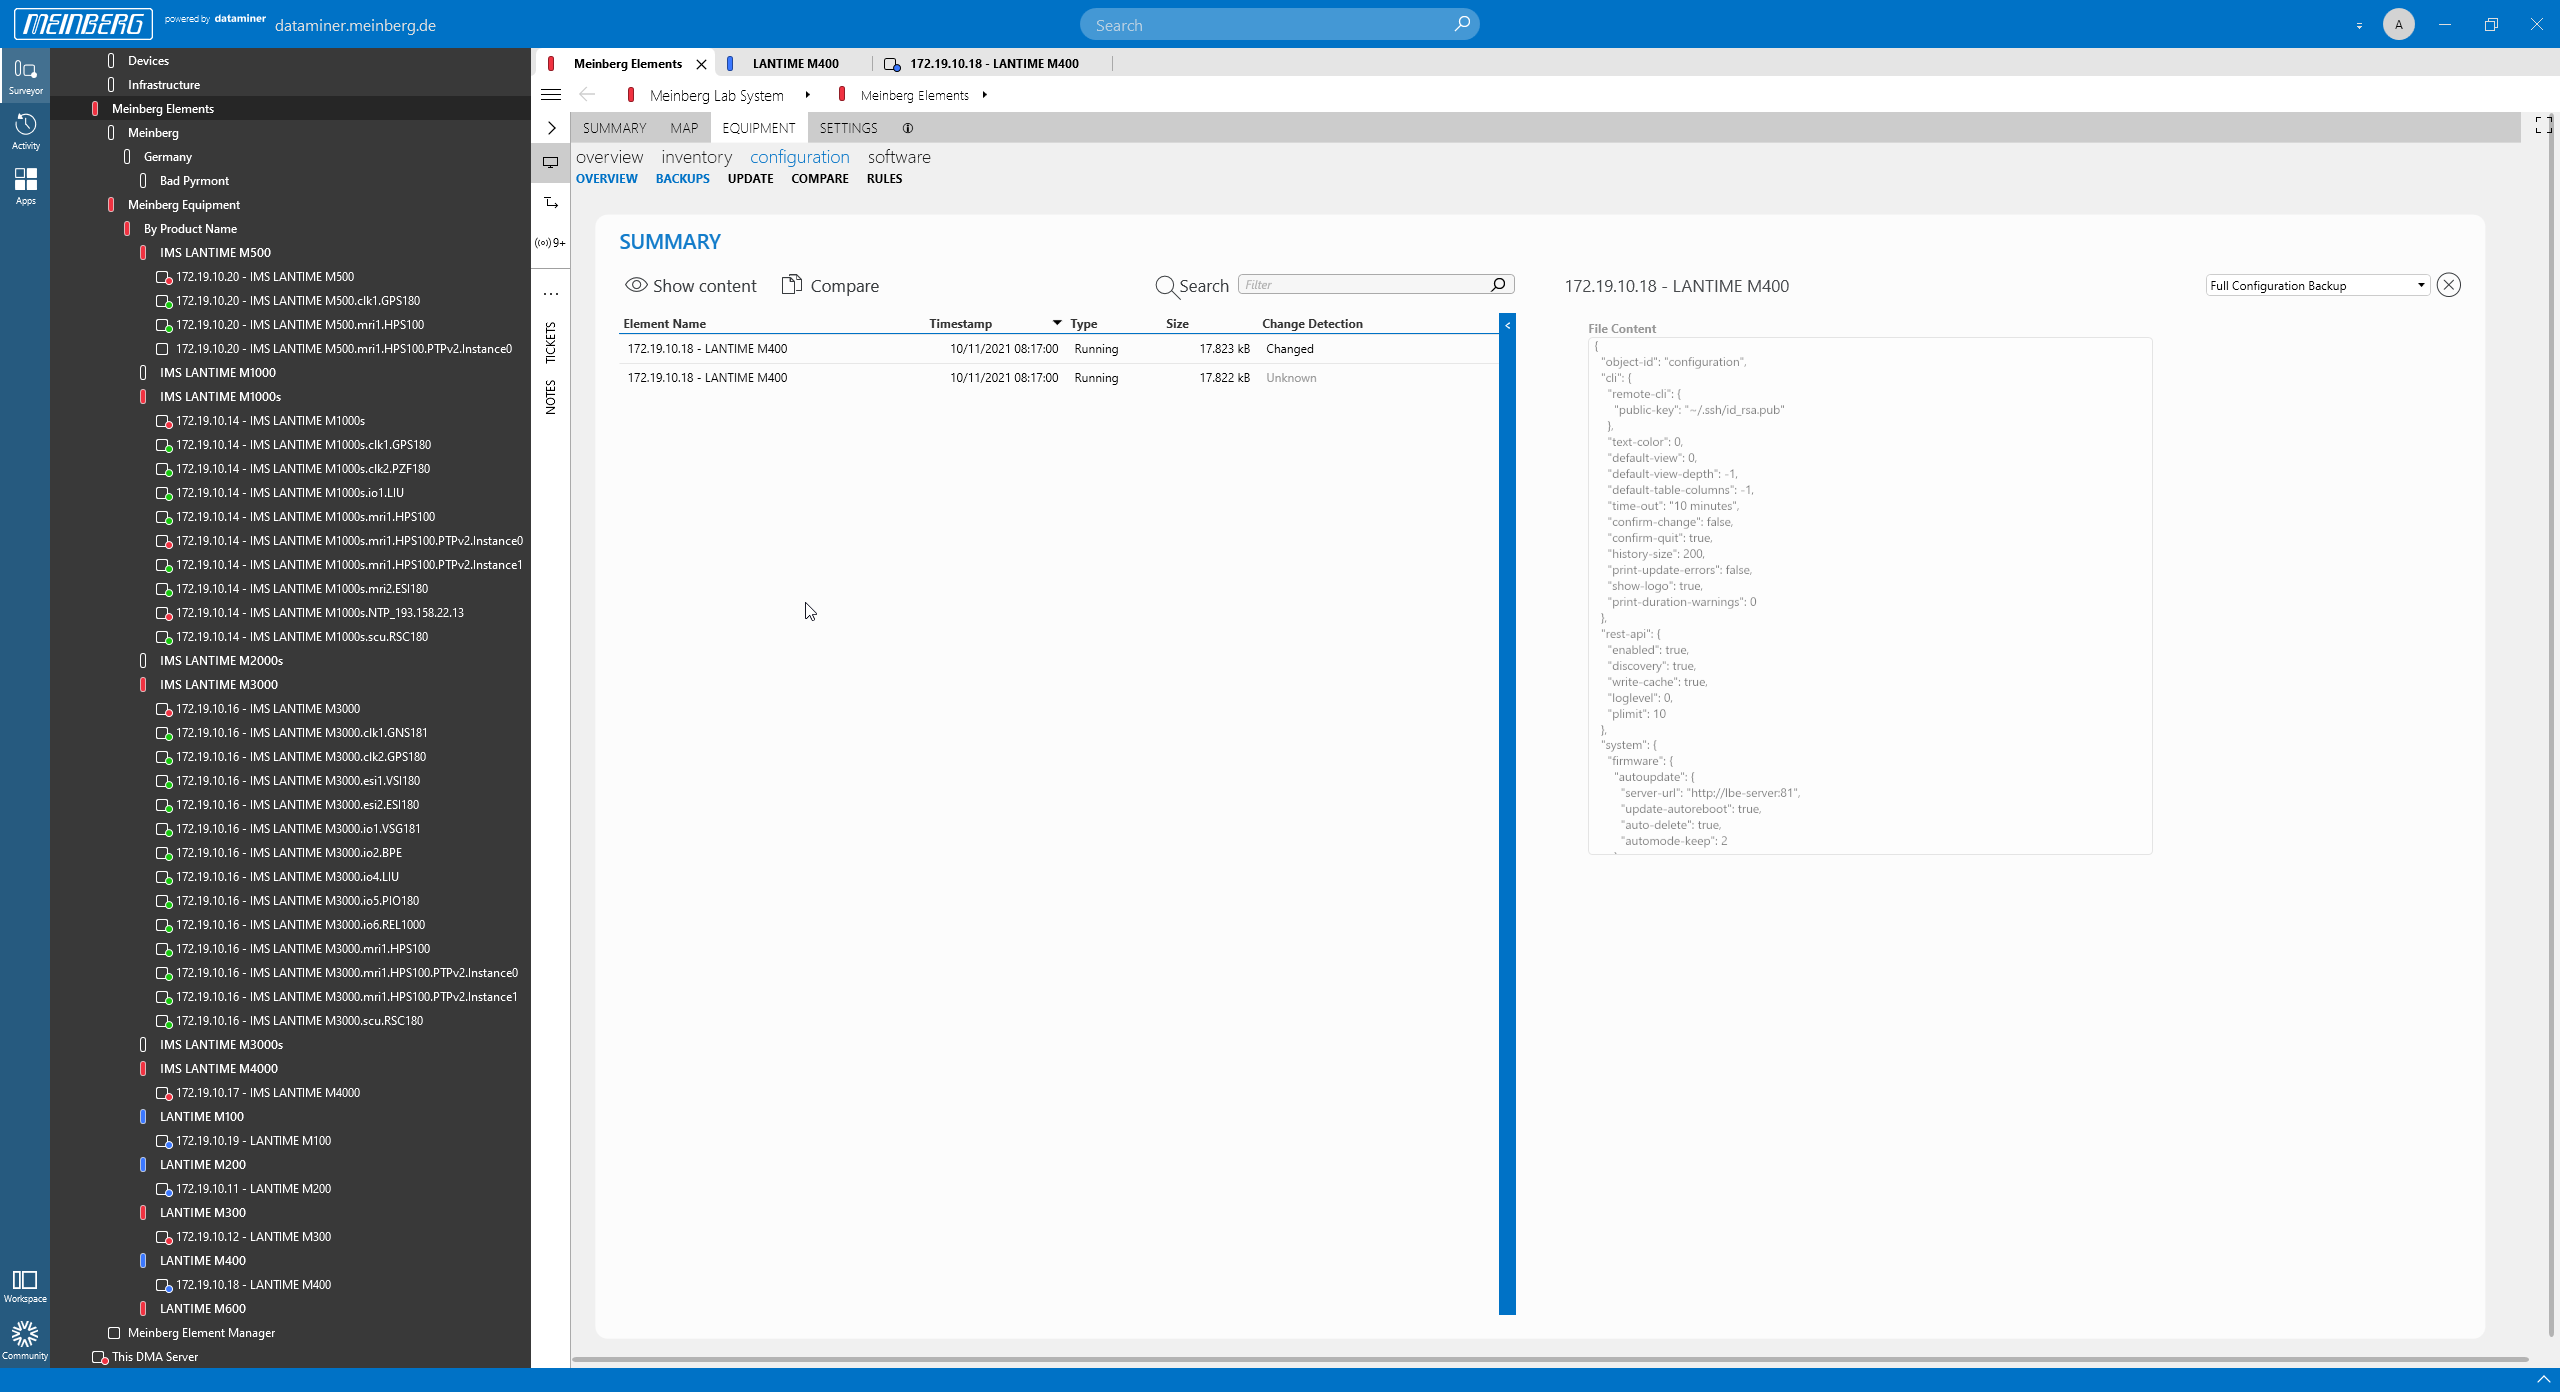 This screenshot shows the backup history of the M400 device. A difference between the backups is indicated. On the right, you can see the content of one backup.
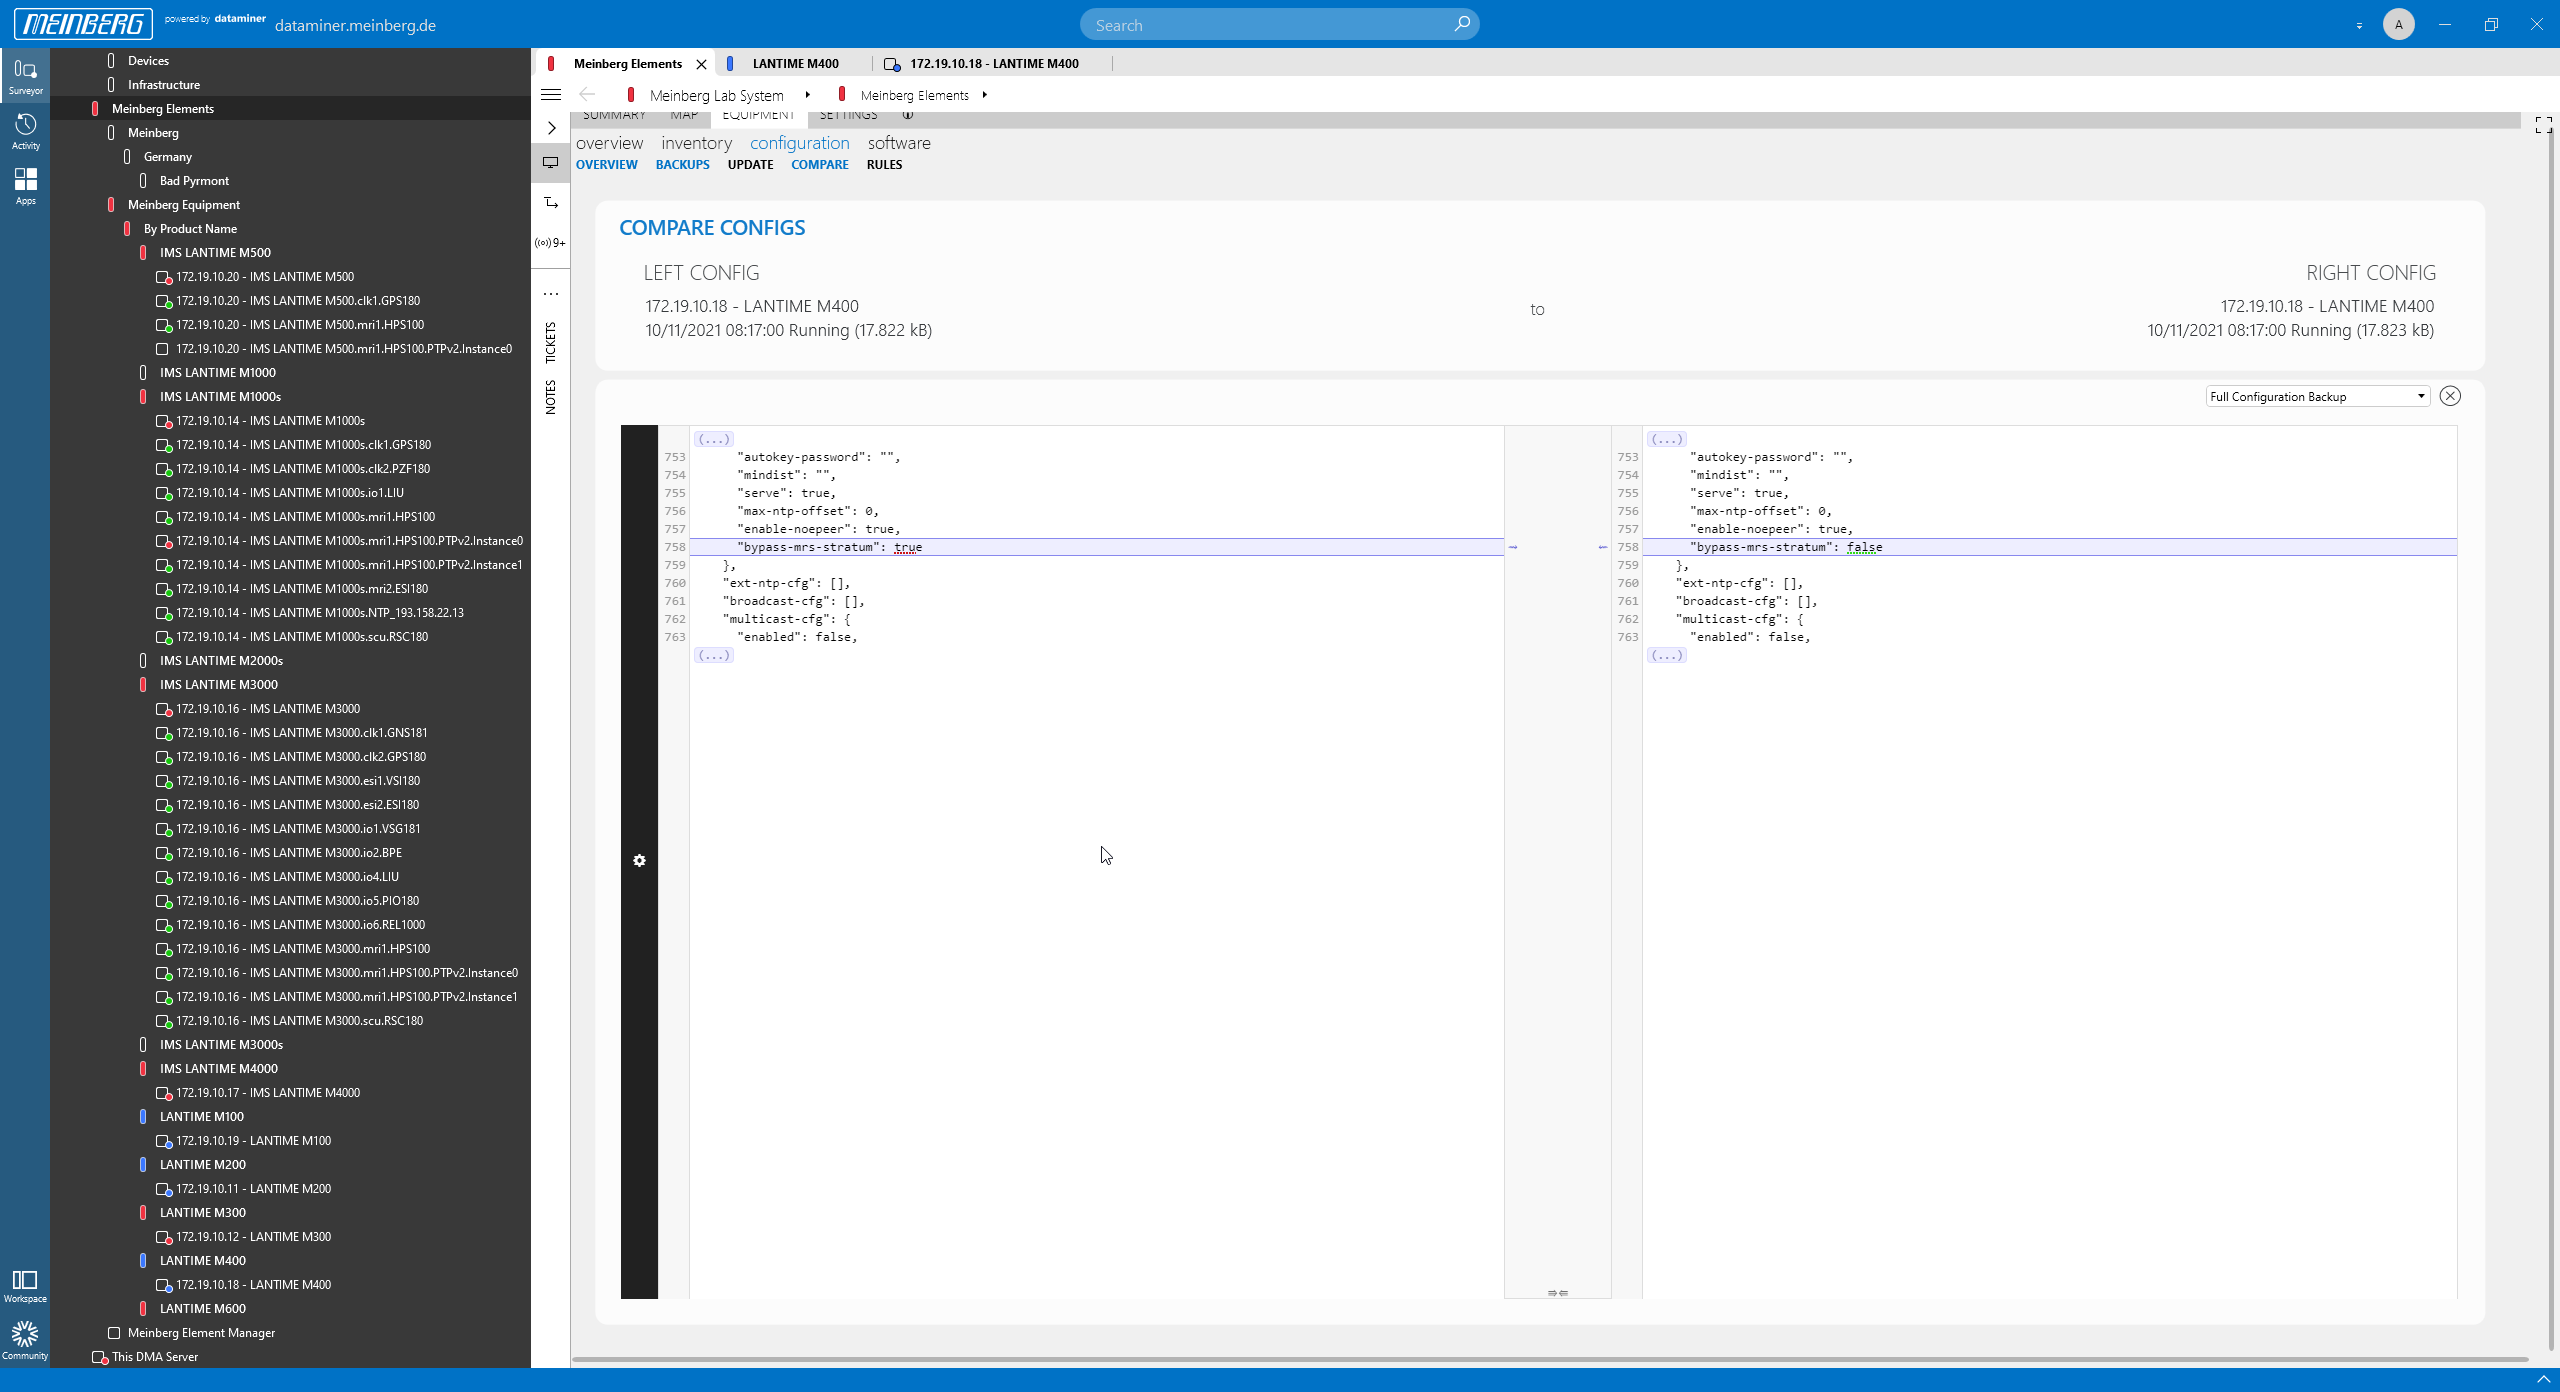 You can also compare two backups, and the mbgNMS will immediately point out the differences between them.
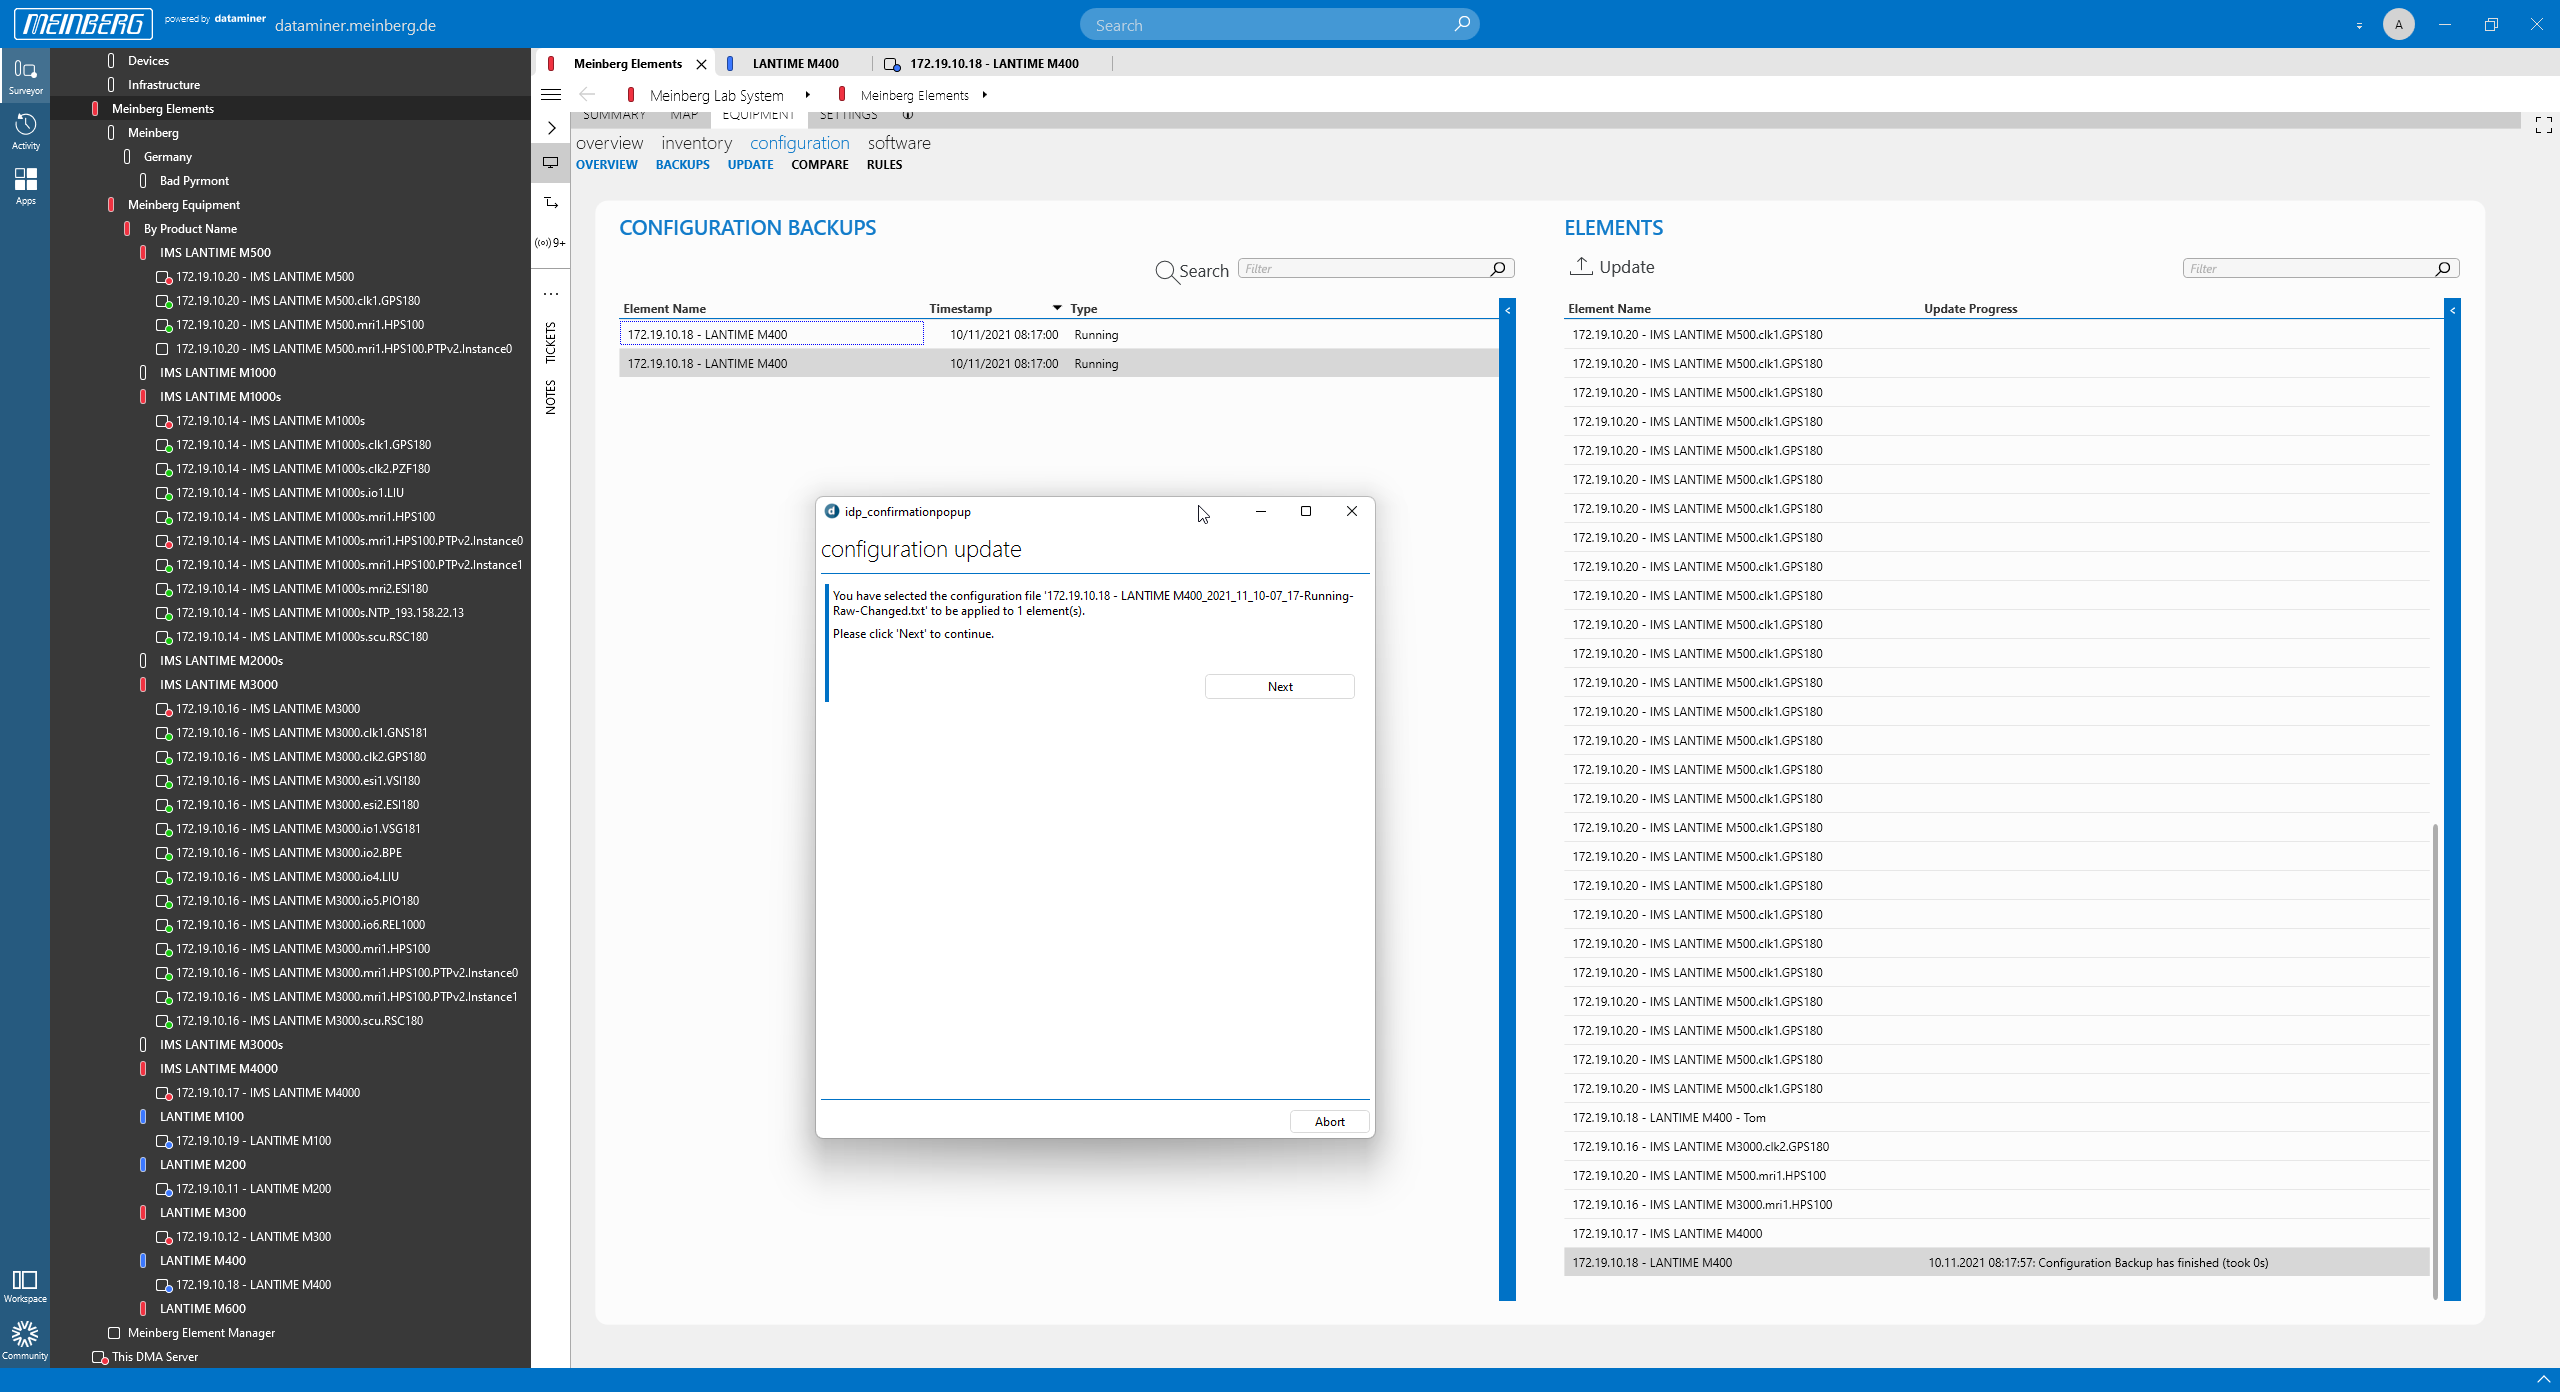 To update a device, just pick any of your backups and click the "Update" button.
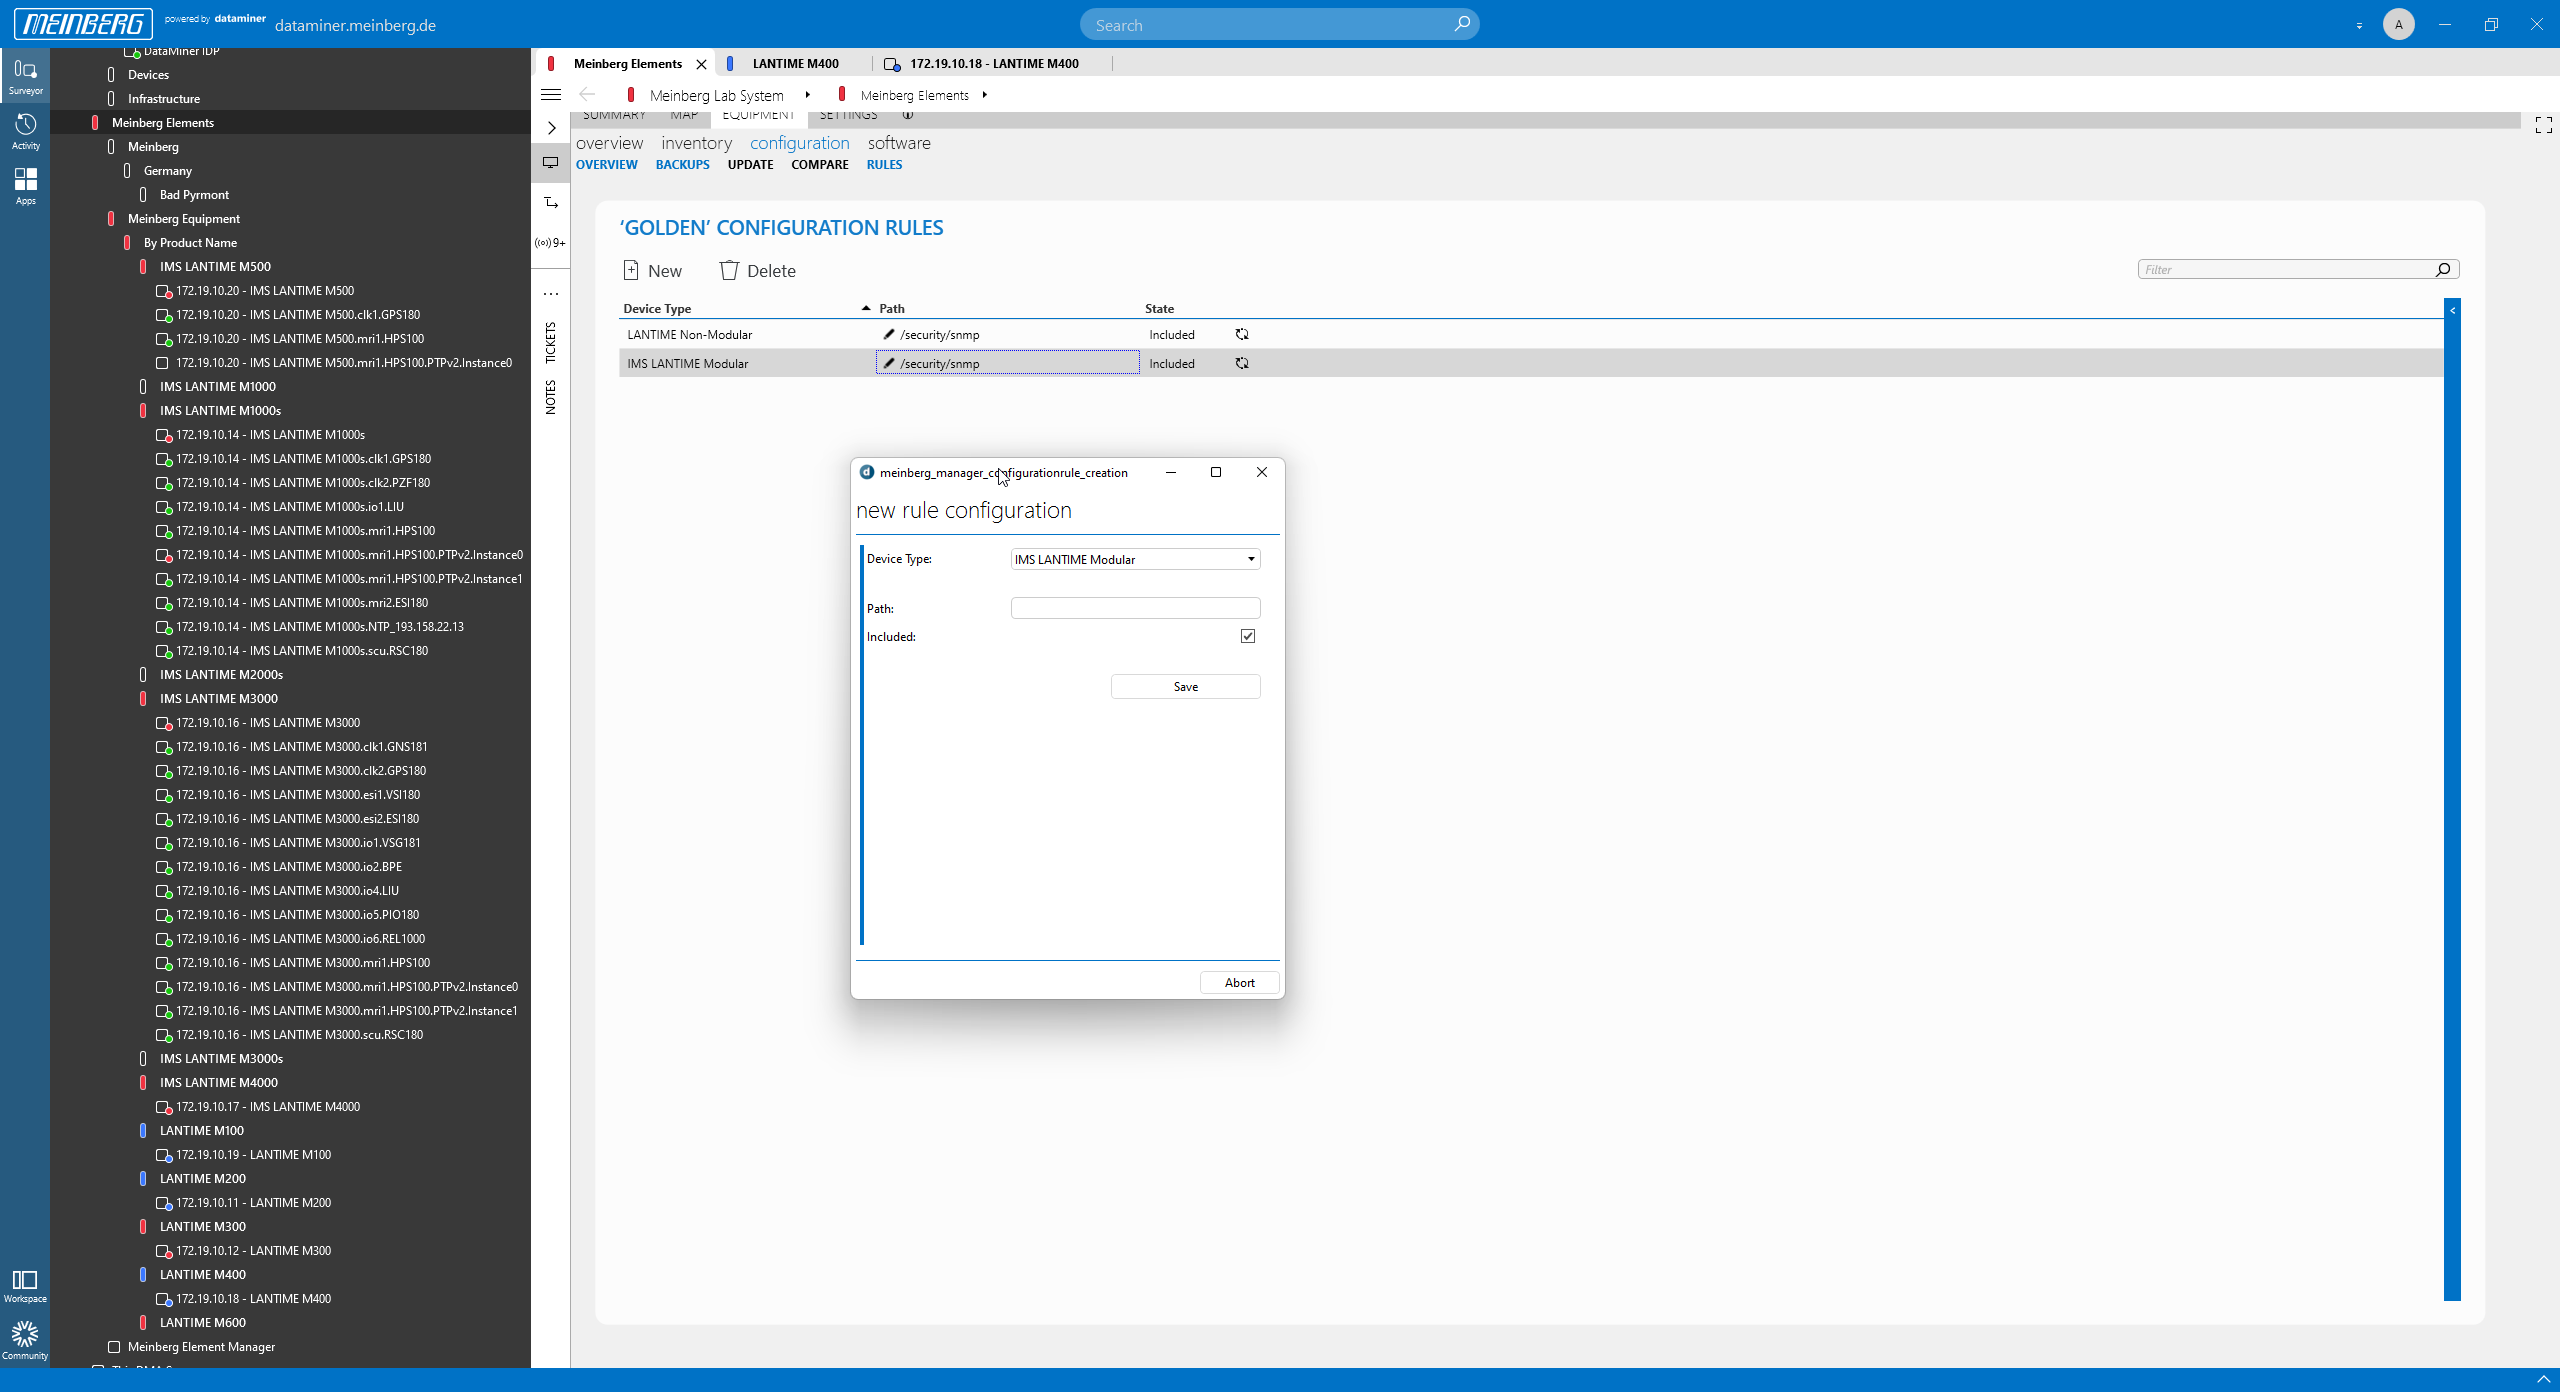 Here you can set up rules to define your "golden" configuration files. You need to specify a path that can be either included or excluded when you take the next "golden" backup.
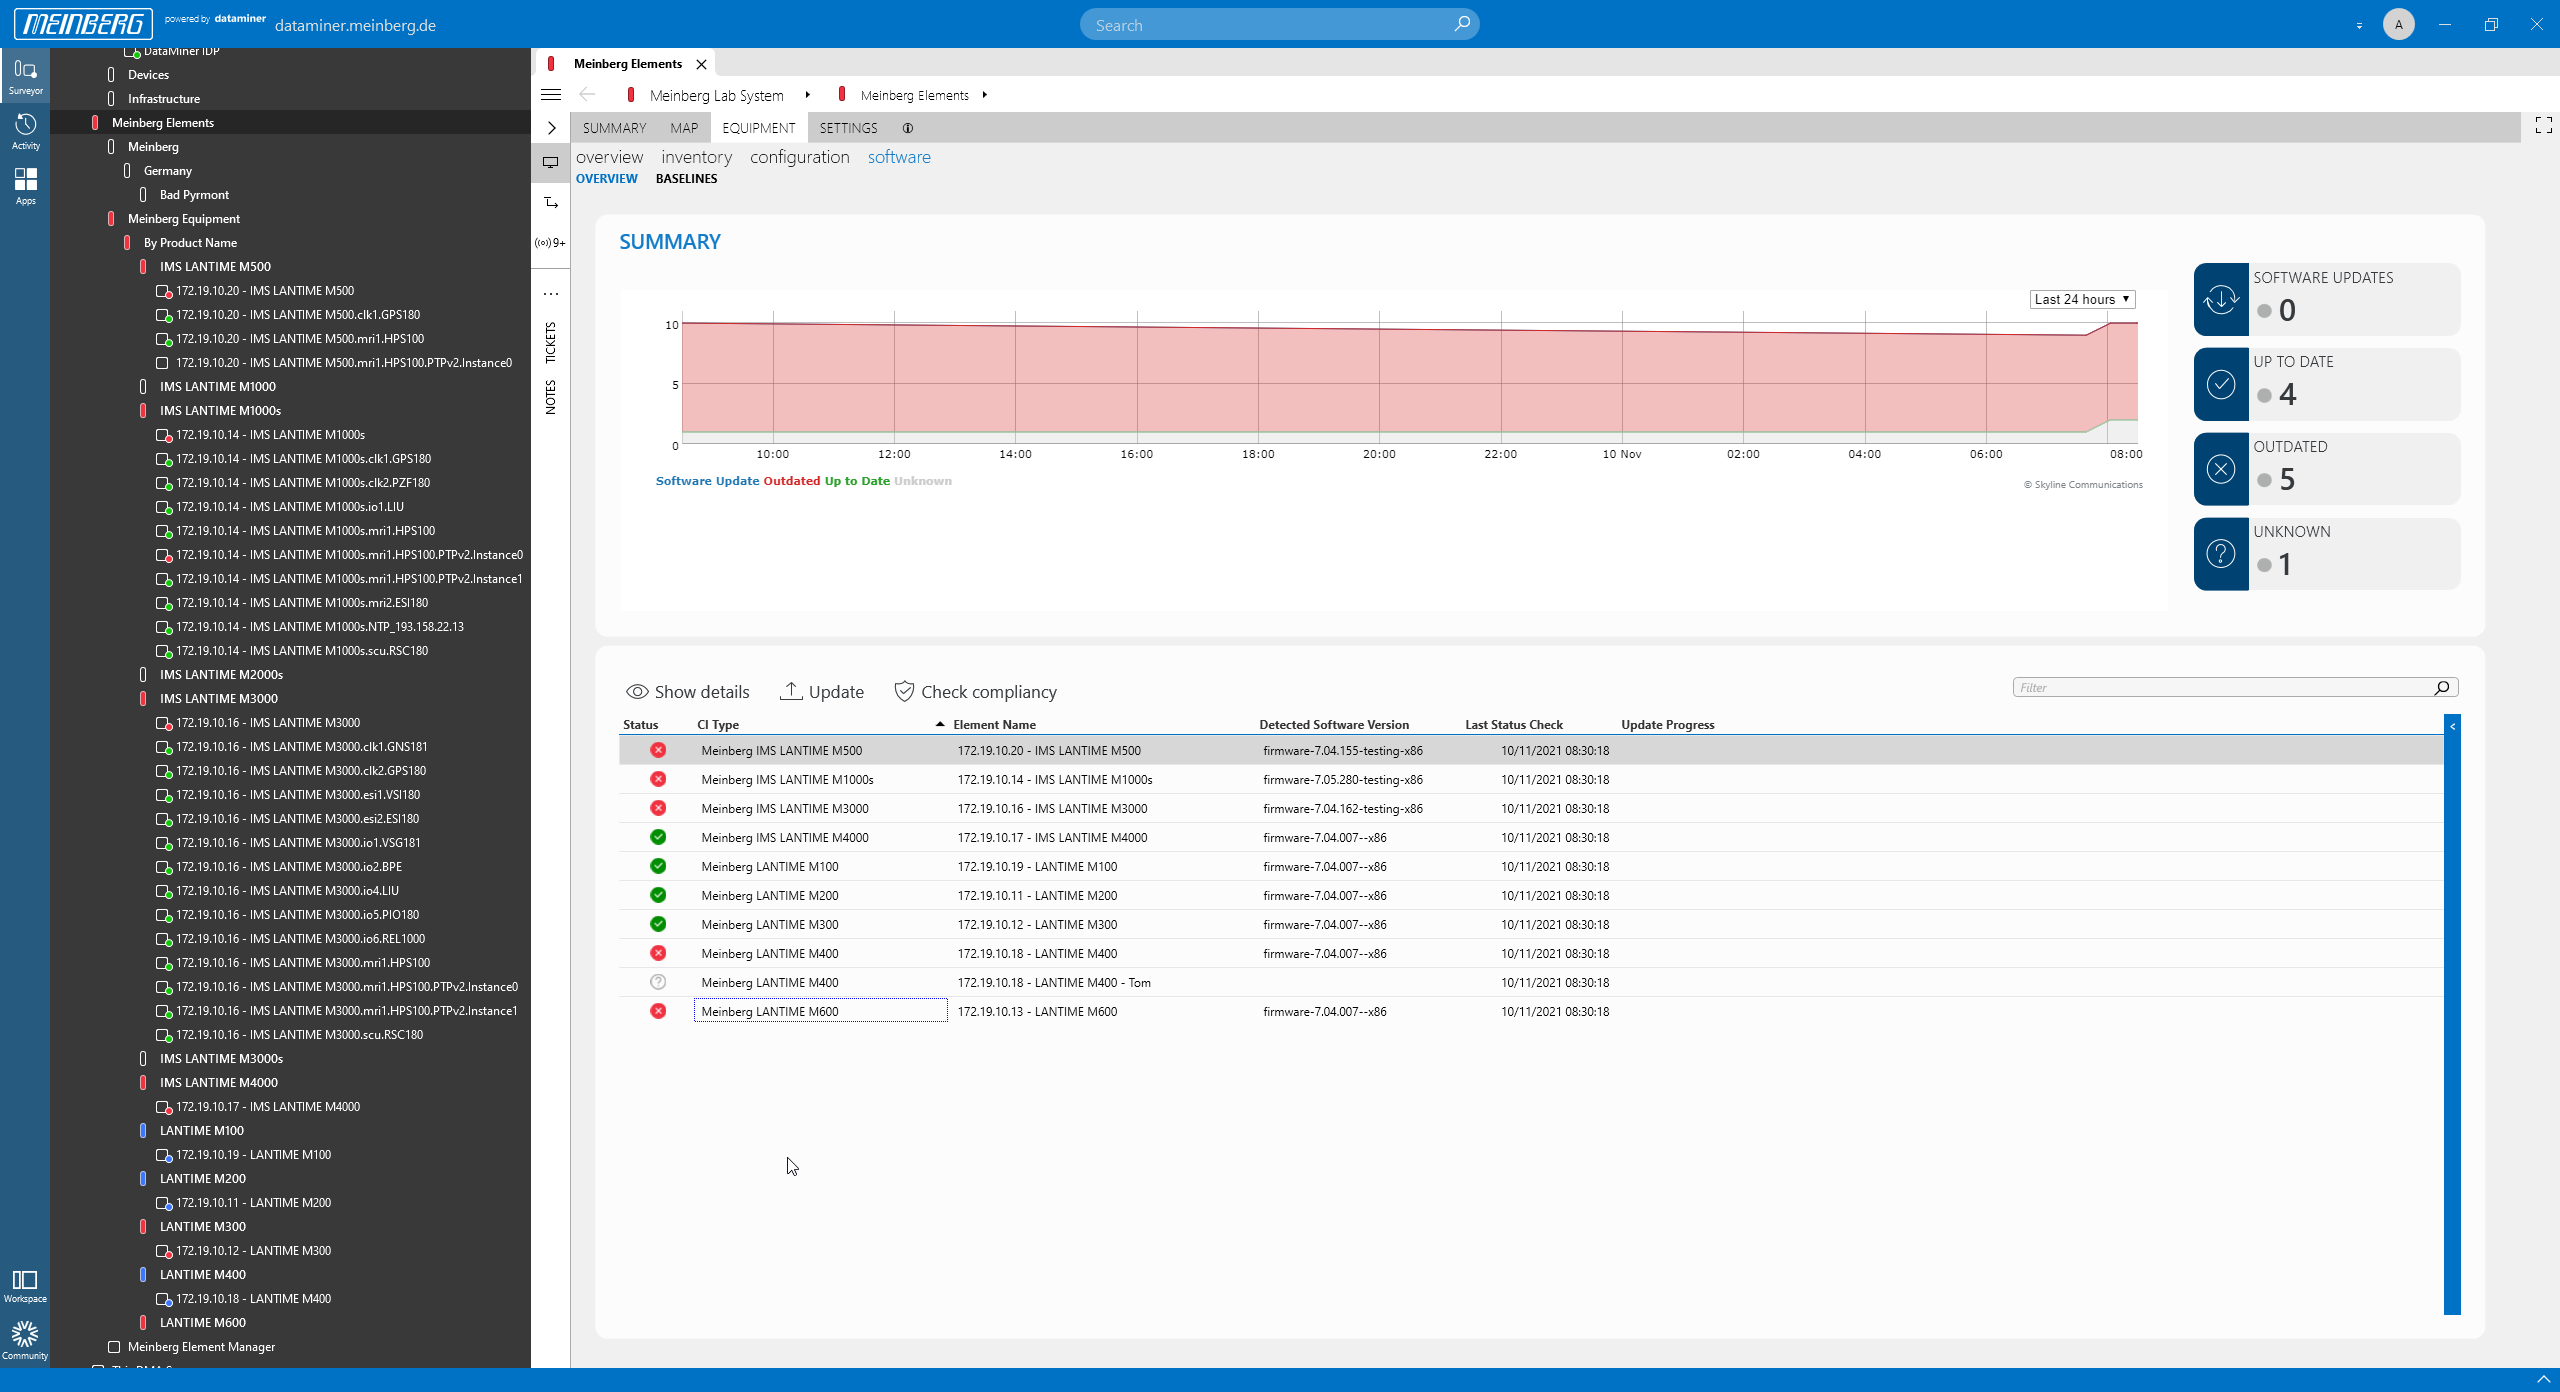 Managing firmware is also easy. The mbgNMS compares the detected firmware version with the baseline (i.e. the desired) firmware version. Any mismatch gets flagged.
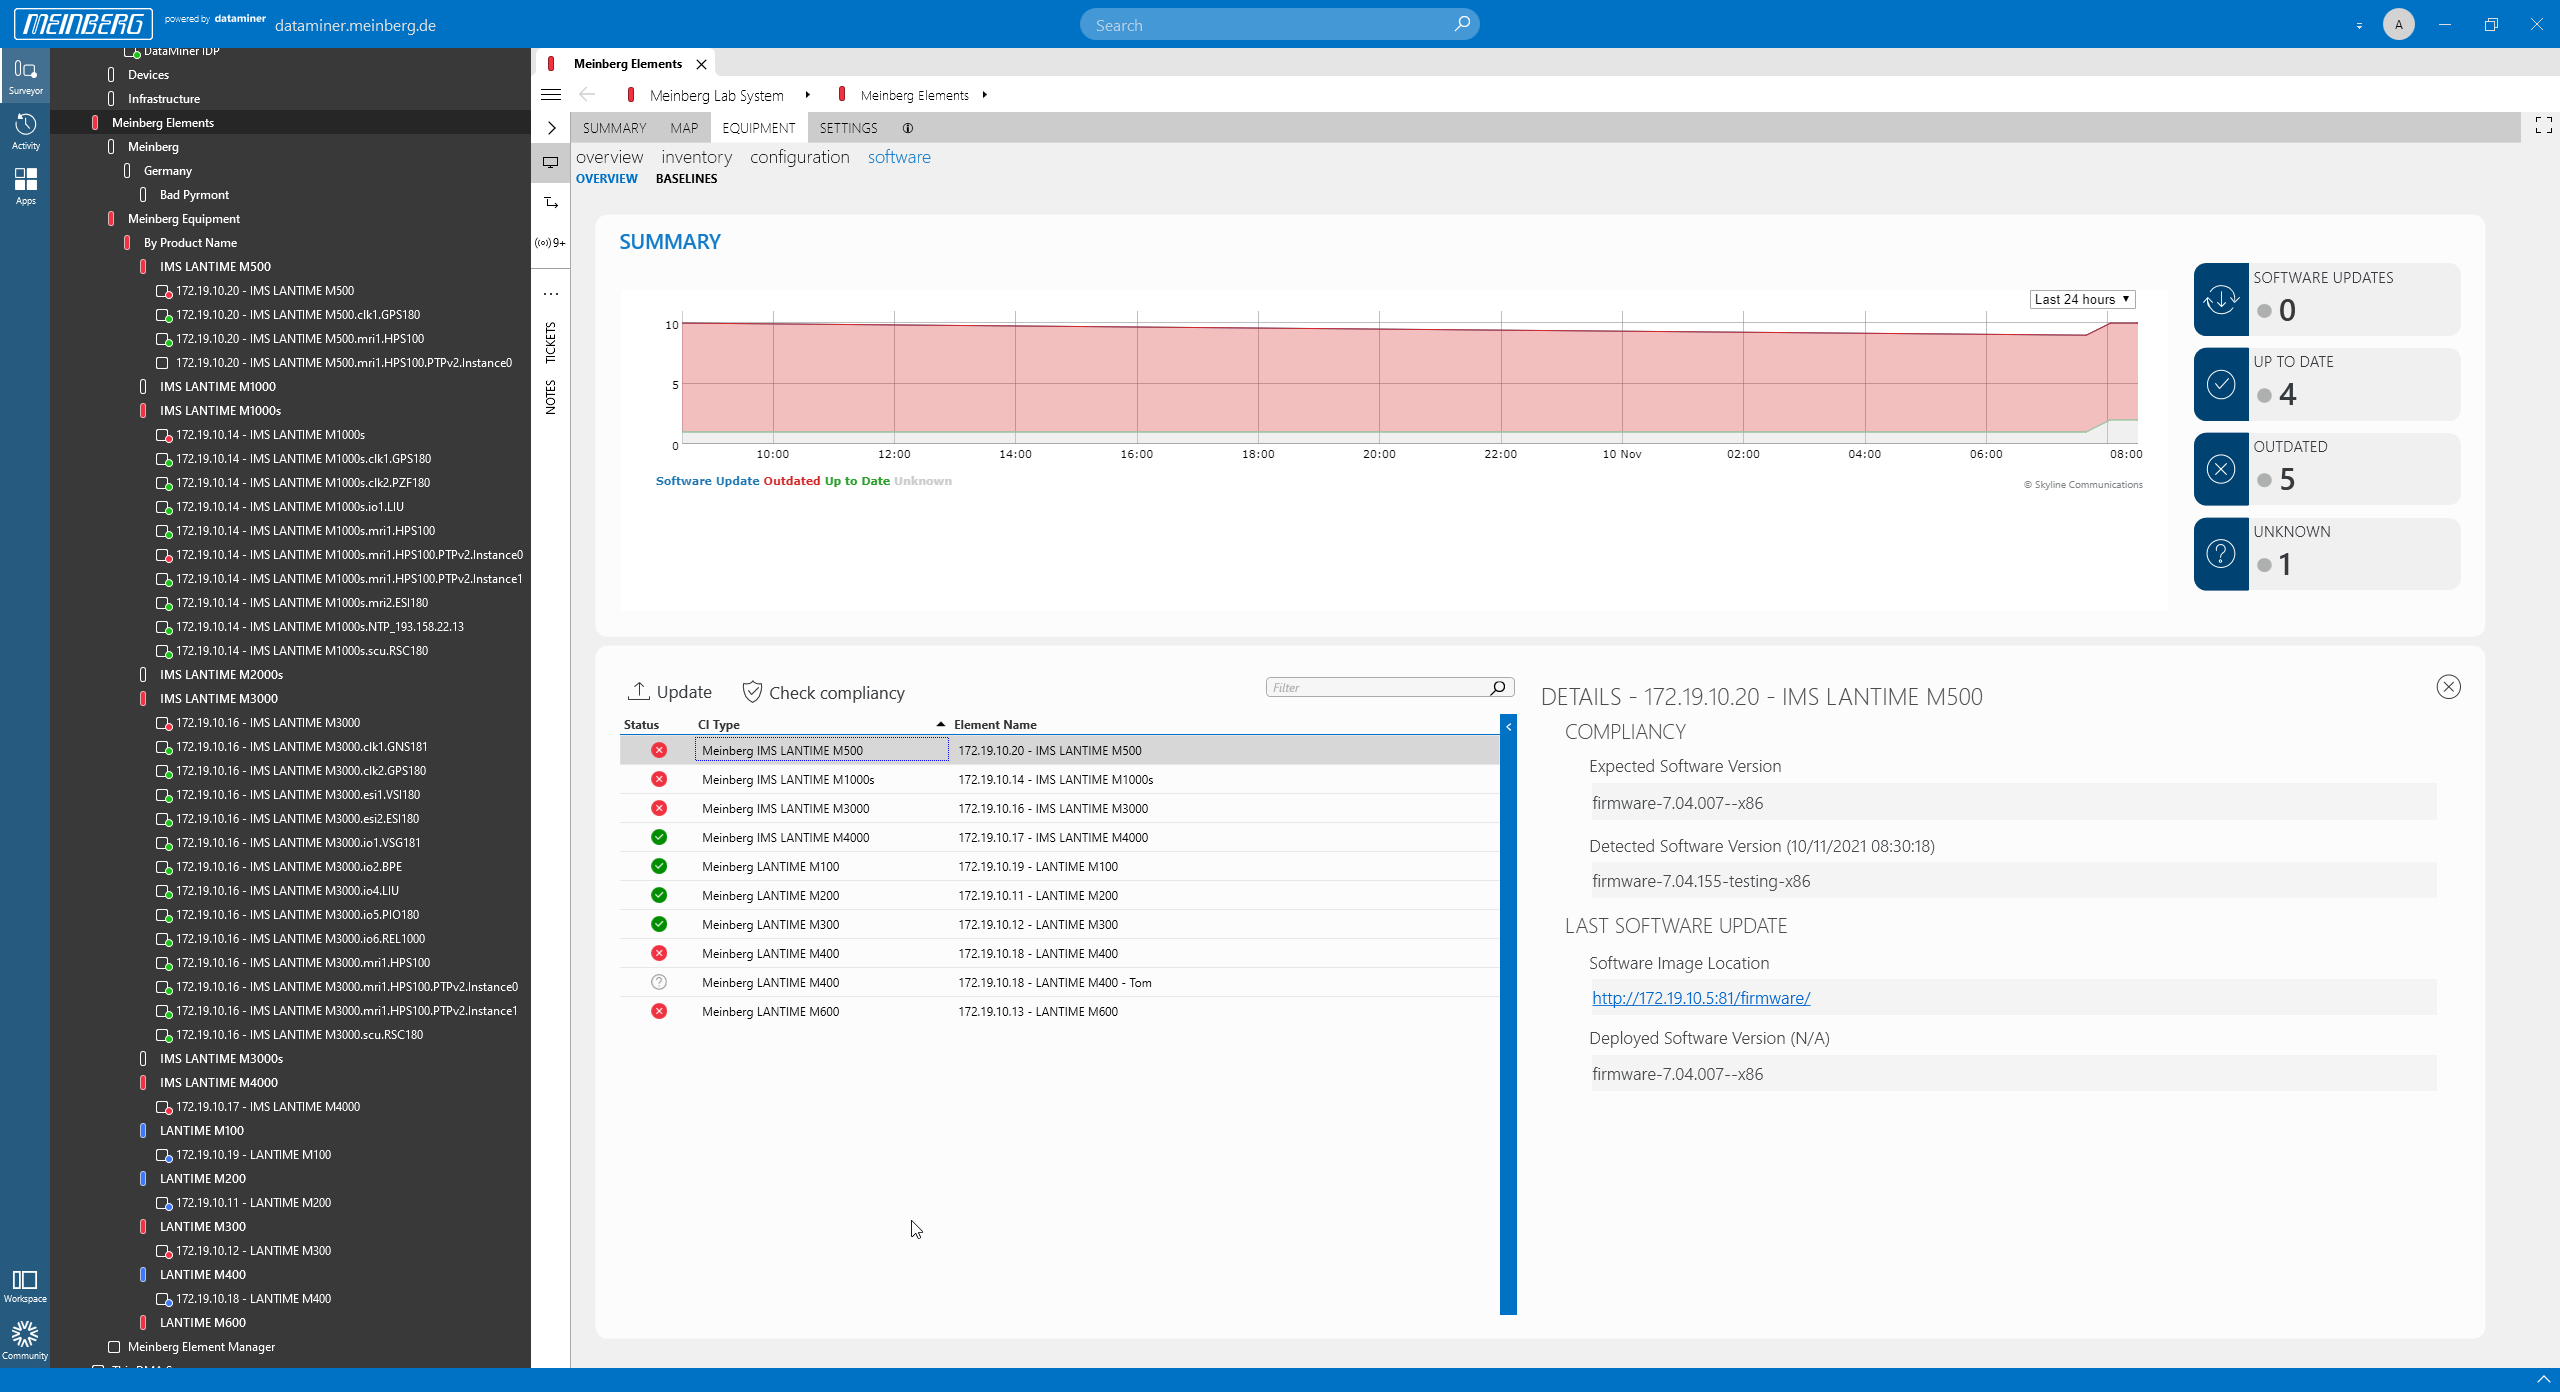 Click the "Show details" button to see what the expected firmware version is for a specific device. Then you can just click "Update". The firmware will be updated and the device will reboot.
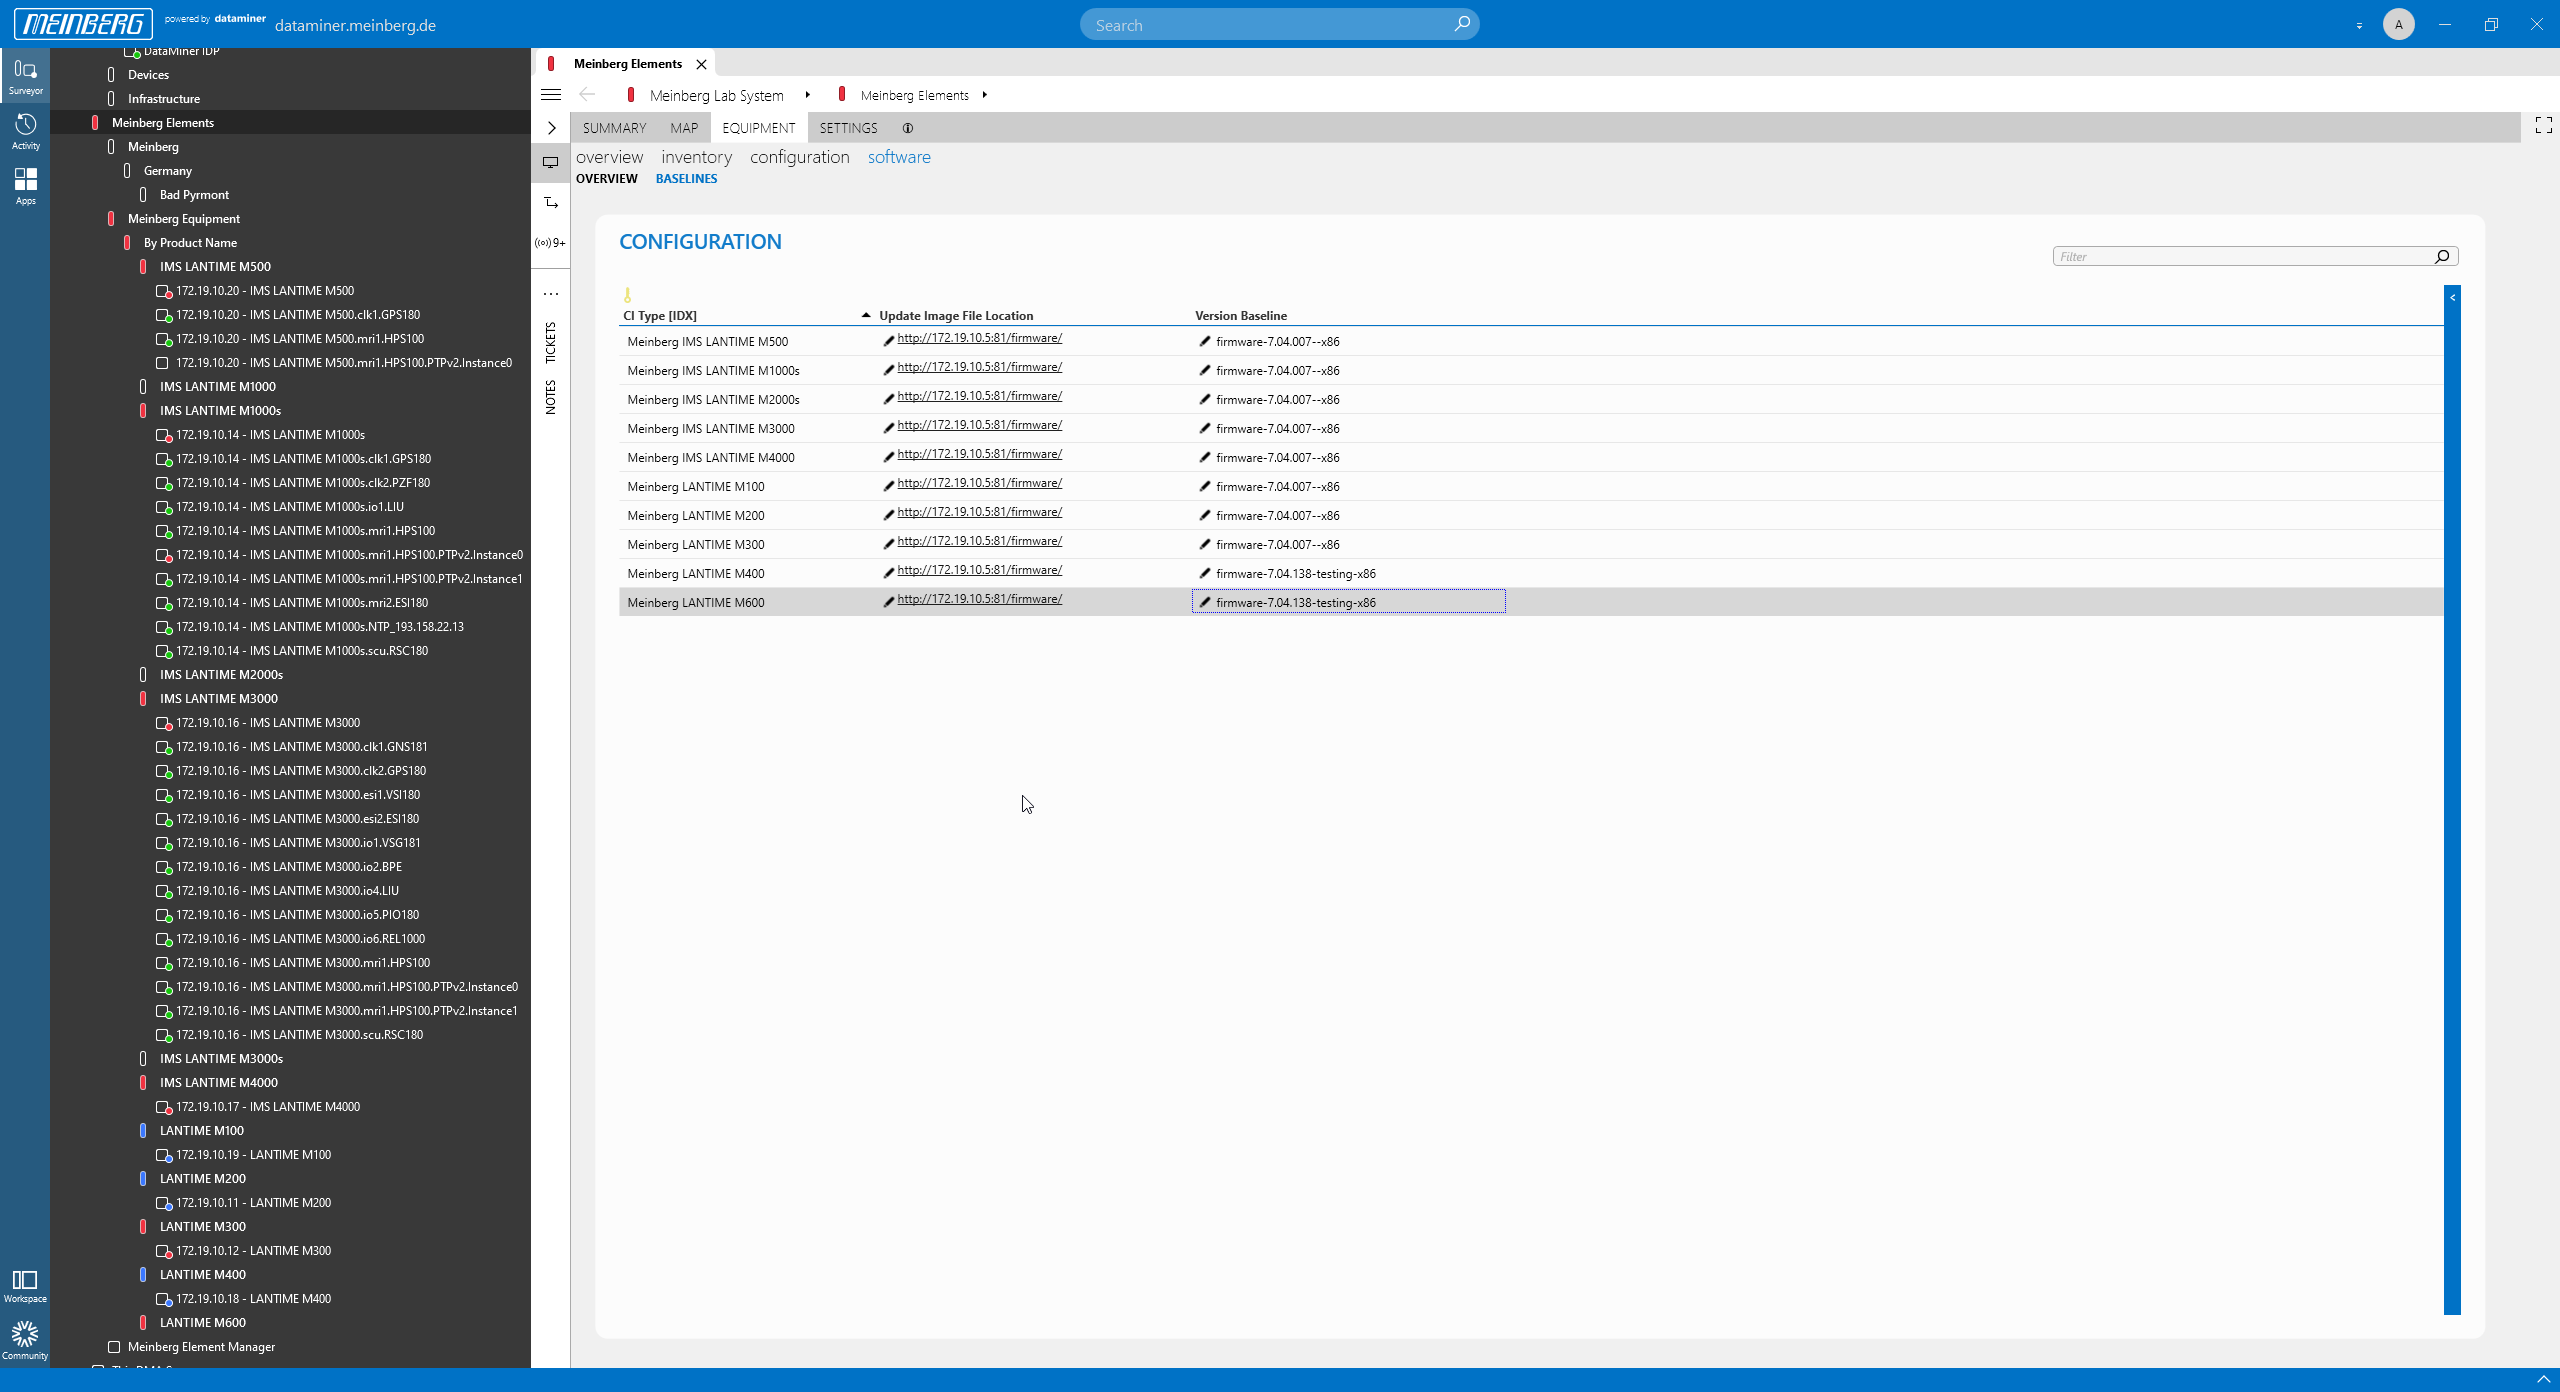 For each device type, you can specify the baseline firmware version and the firmware location.
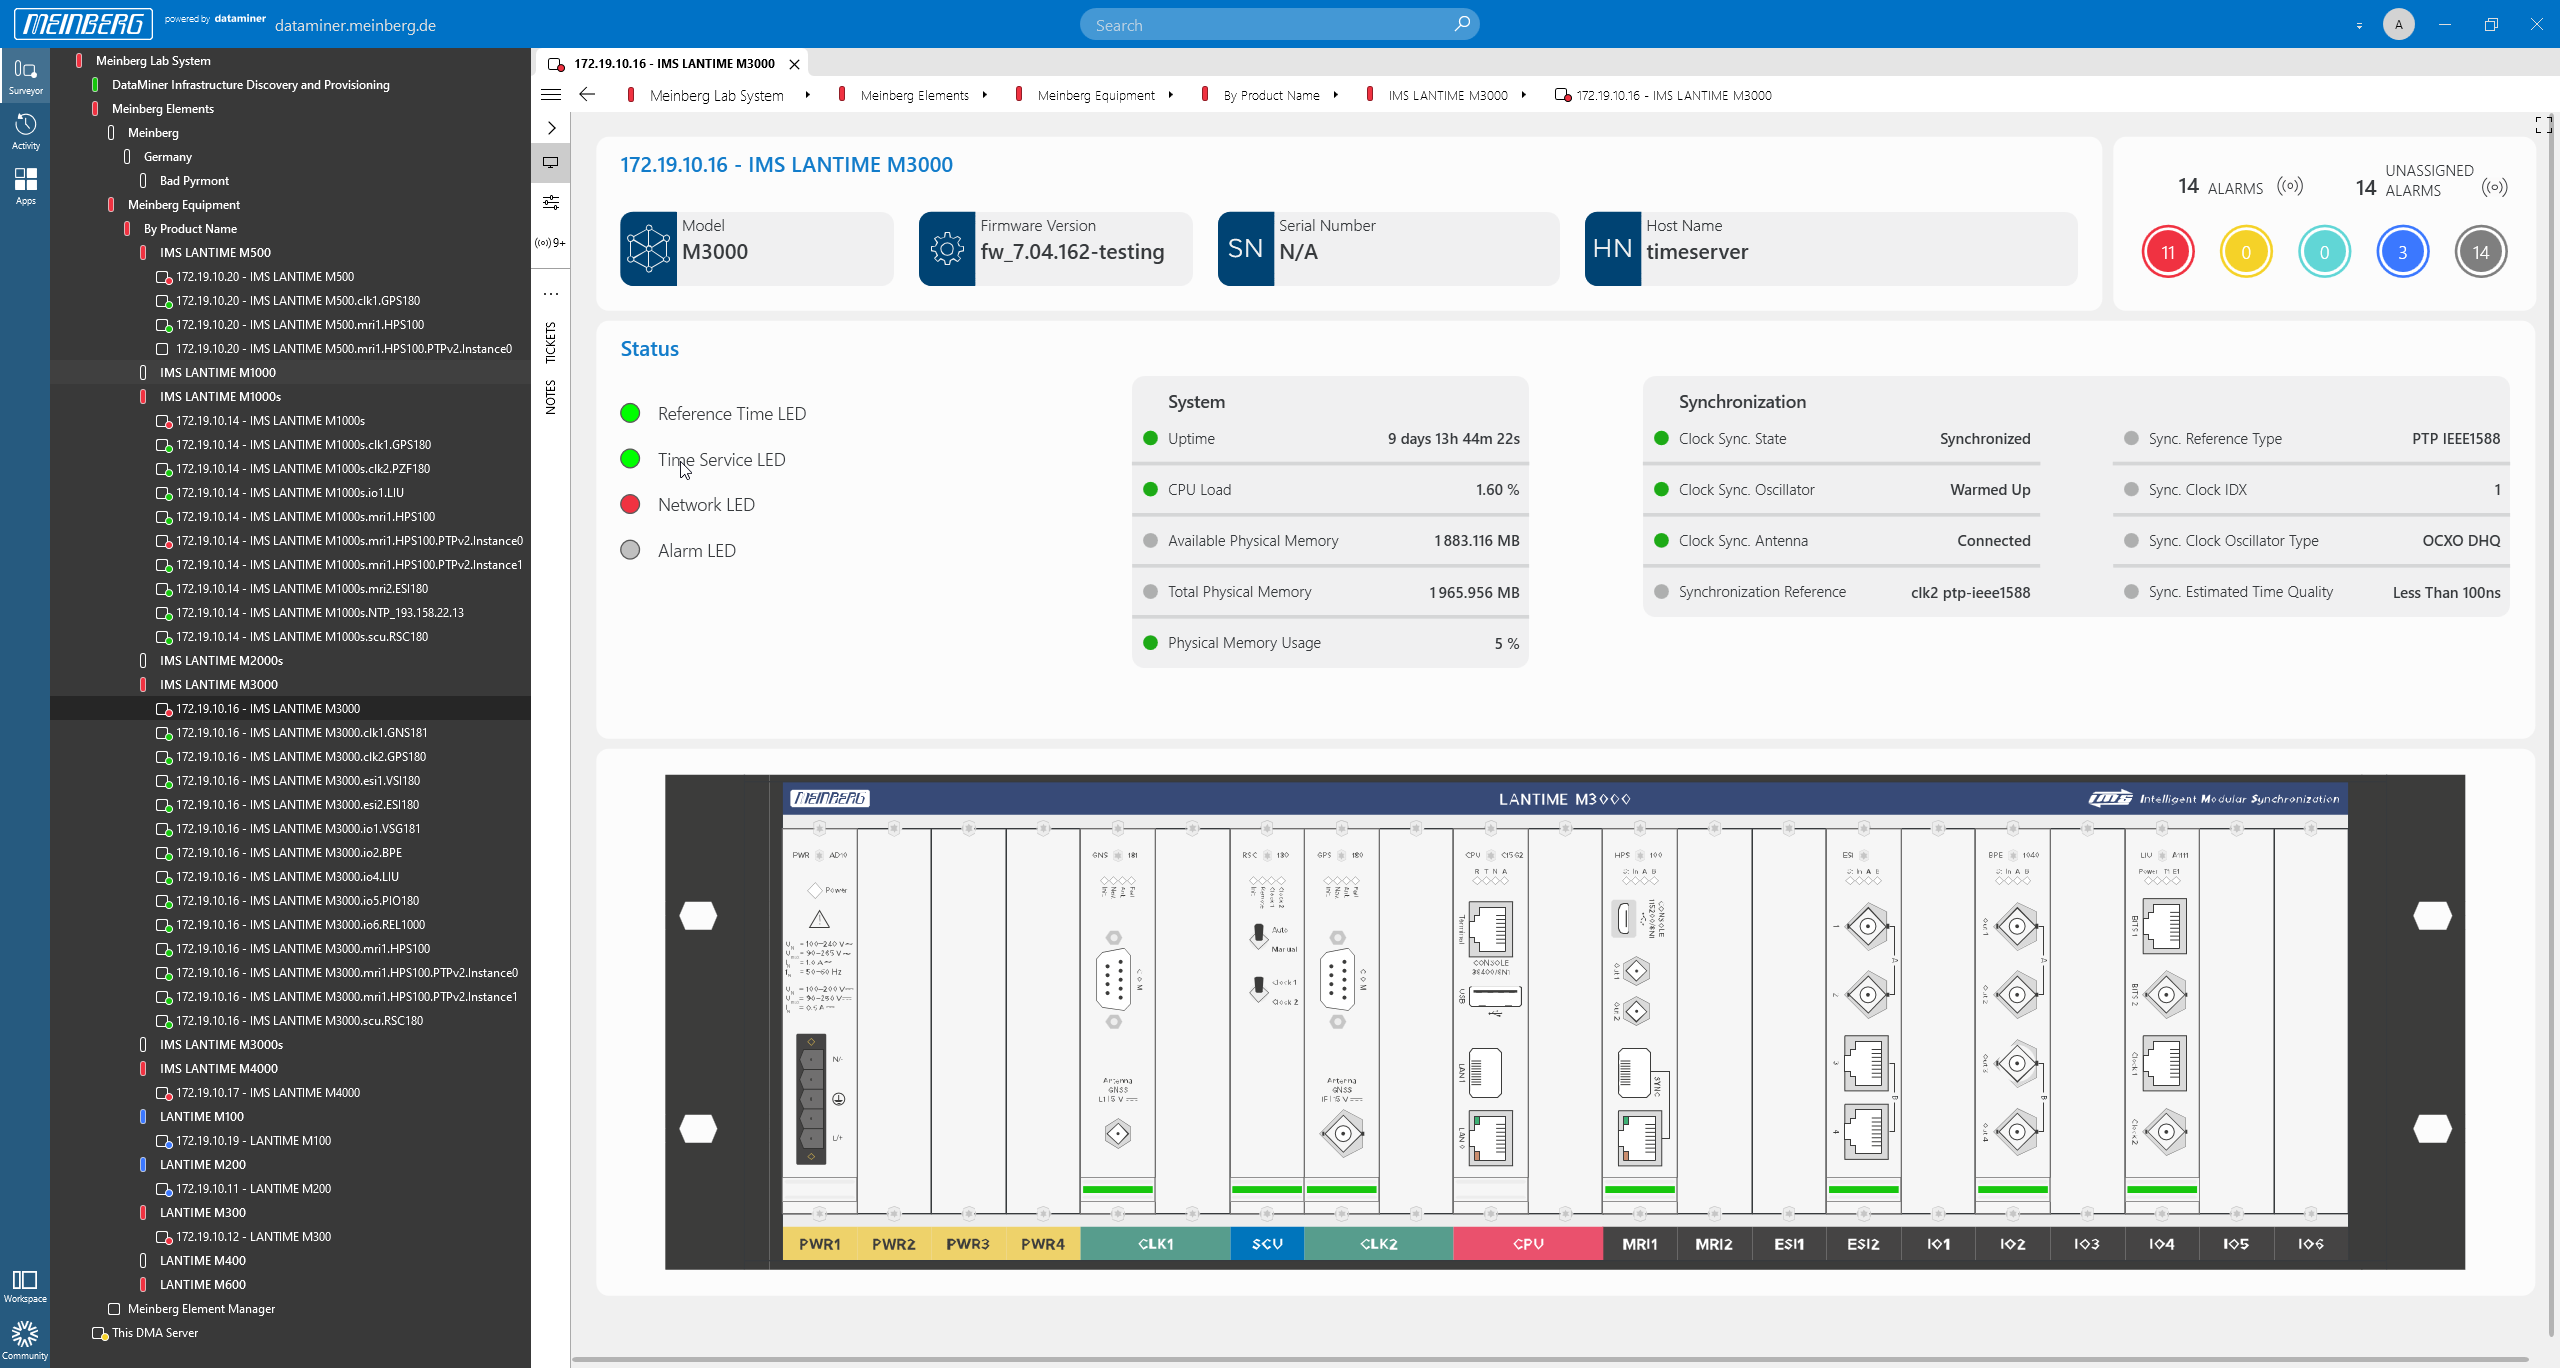
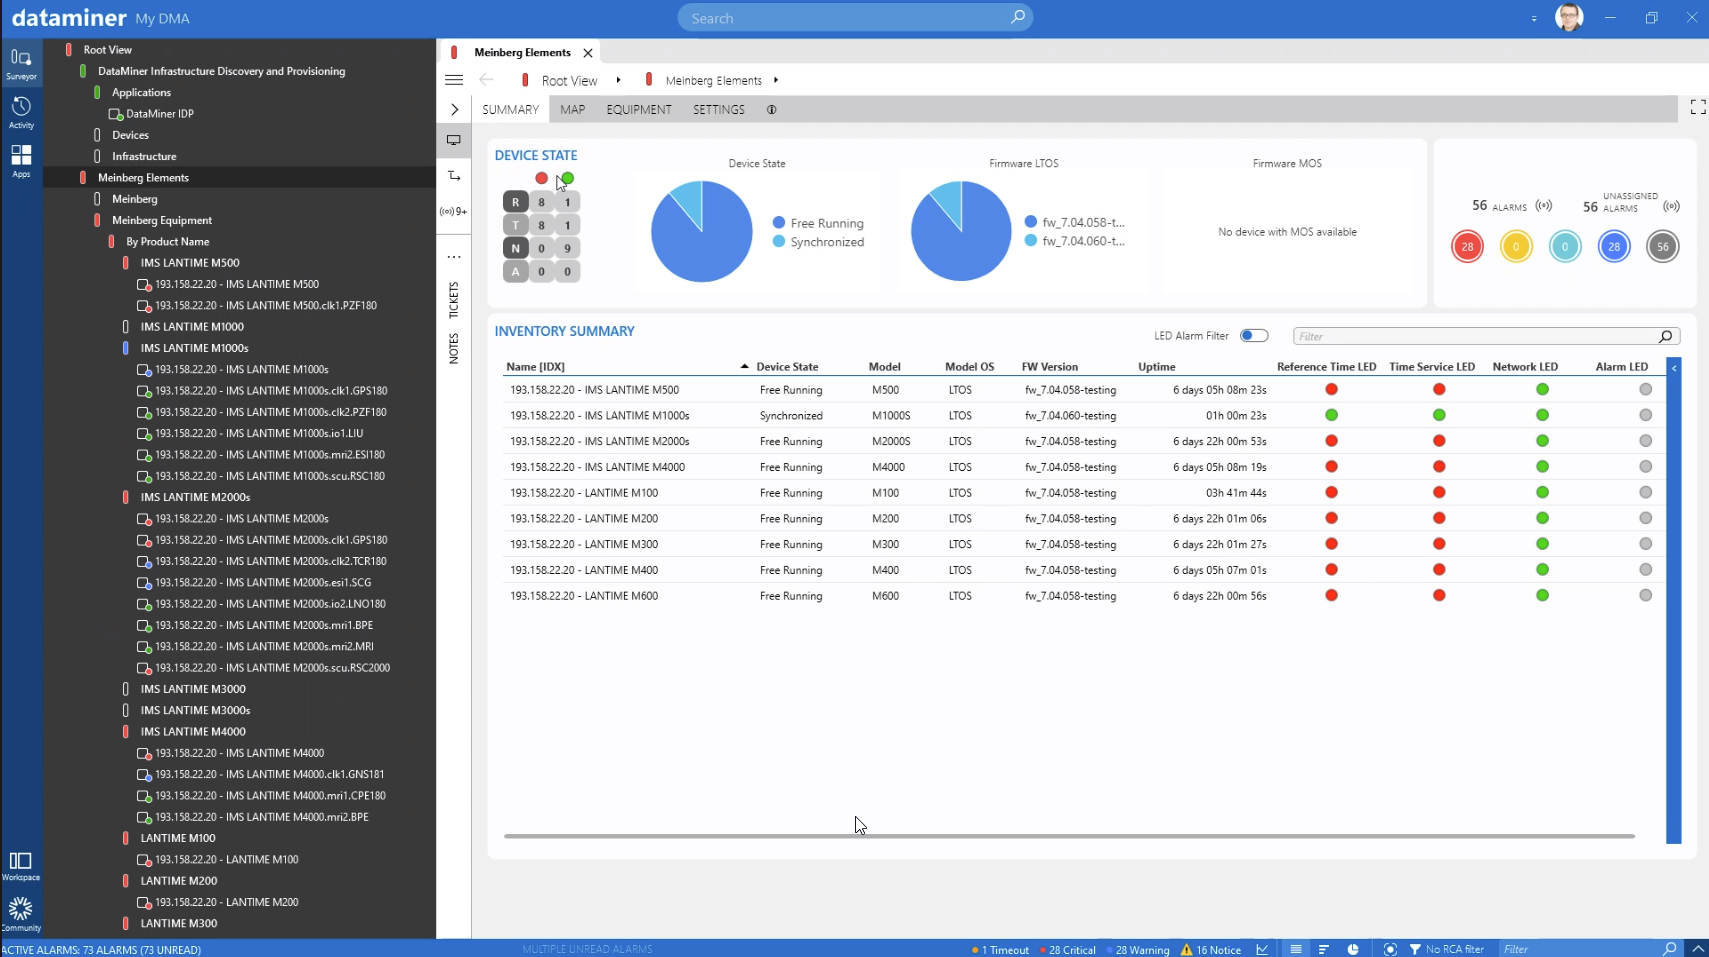 The mbgNMS landing page shows all provisioned devices, including key information such as the firmware, uptime and LED states.
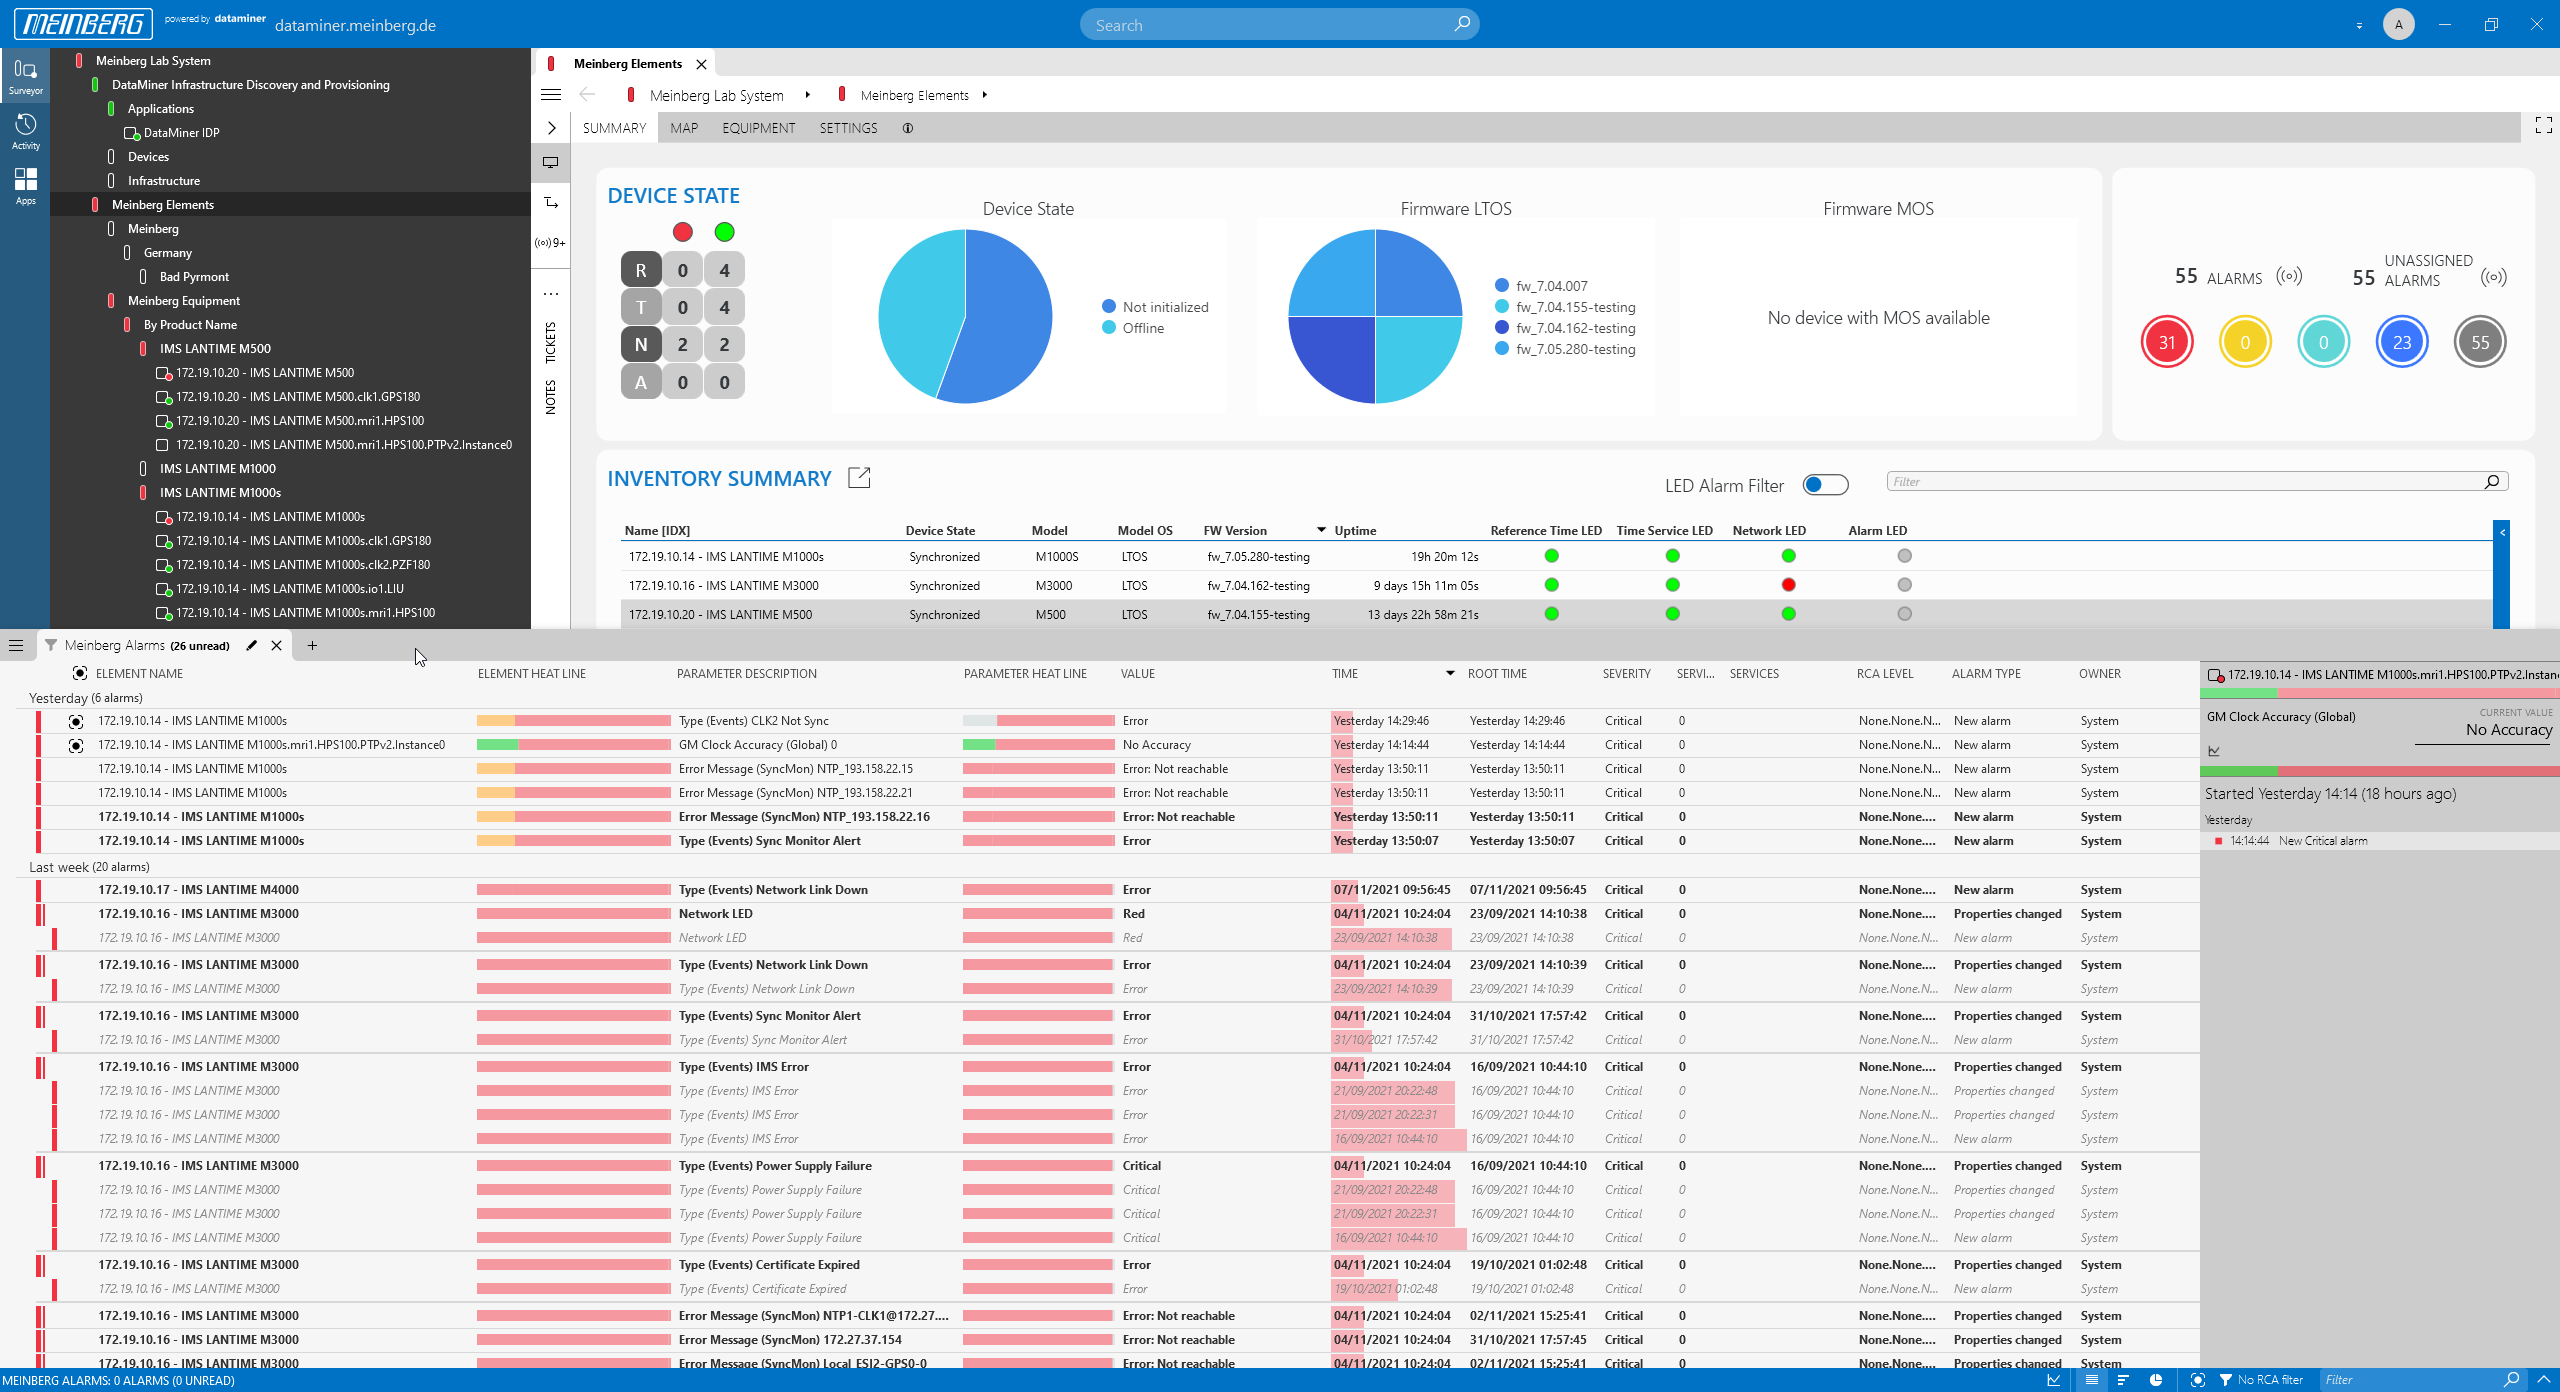 Click any of the "alarm circles" in the top-right corner to open the mbgNMS Alarm Console and see all current alarms and warnings.
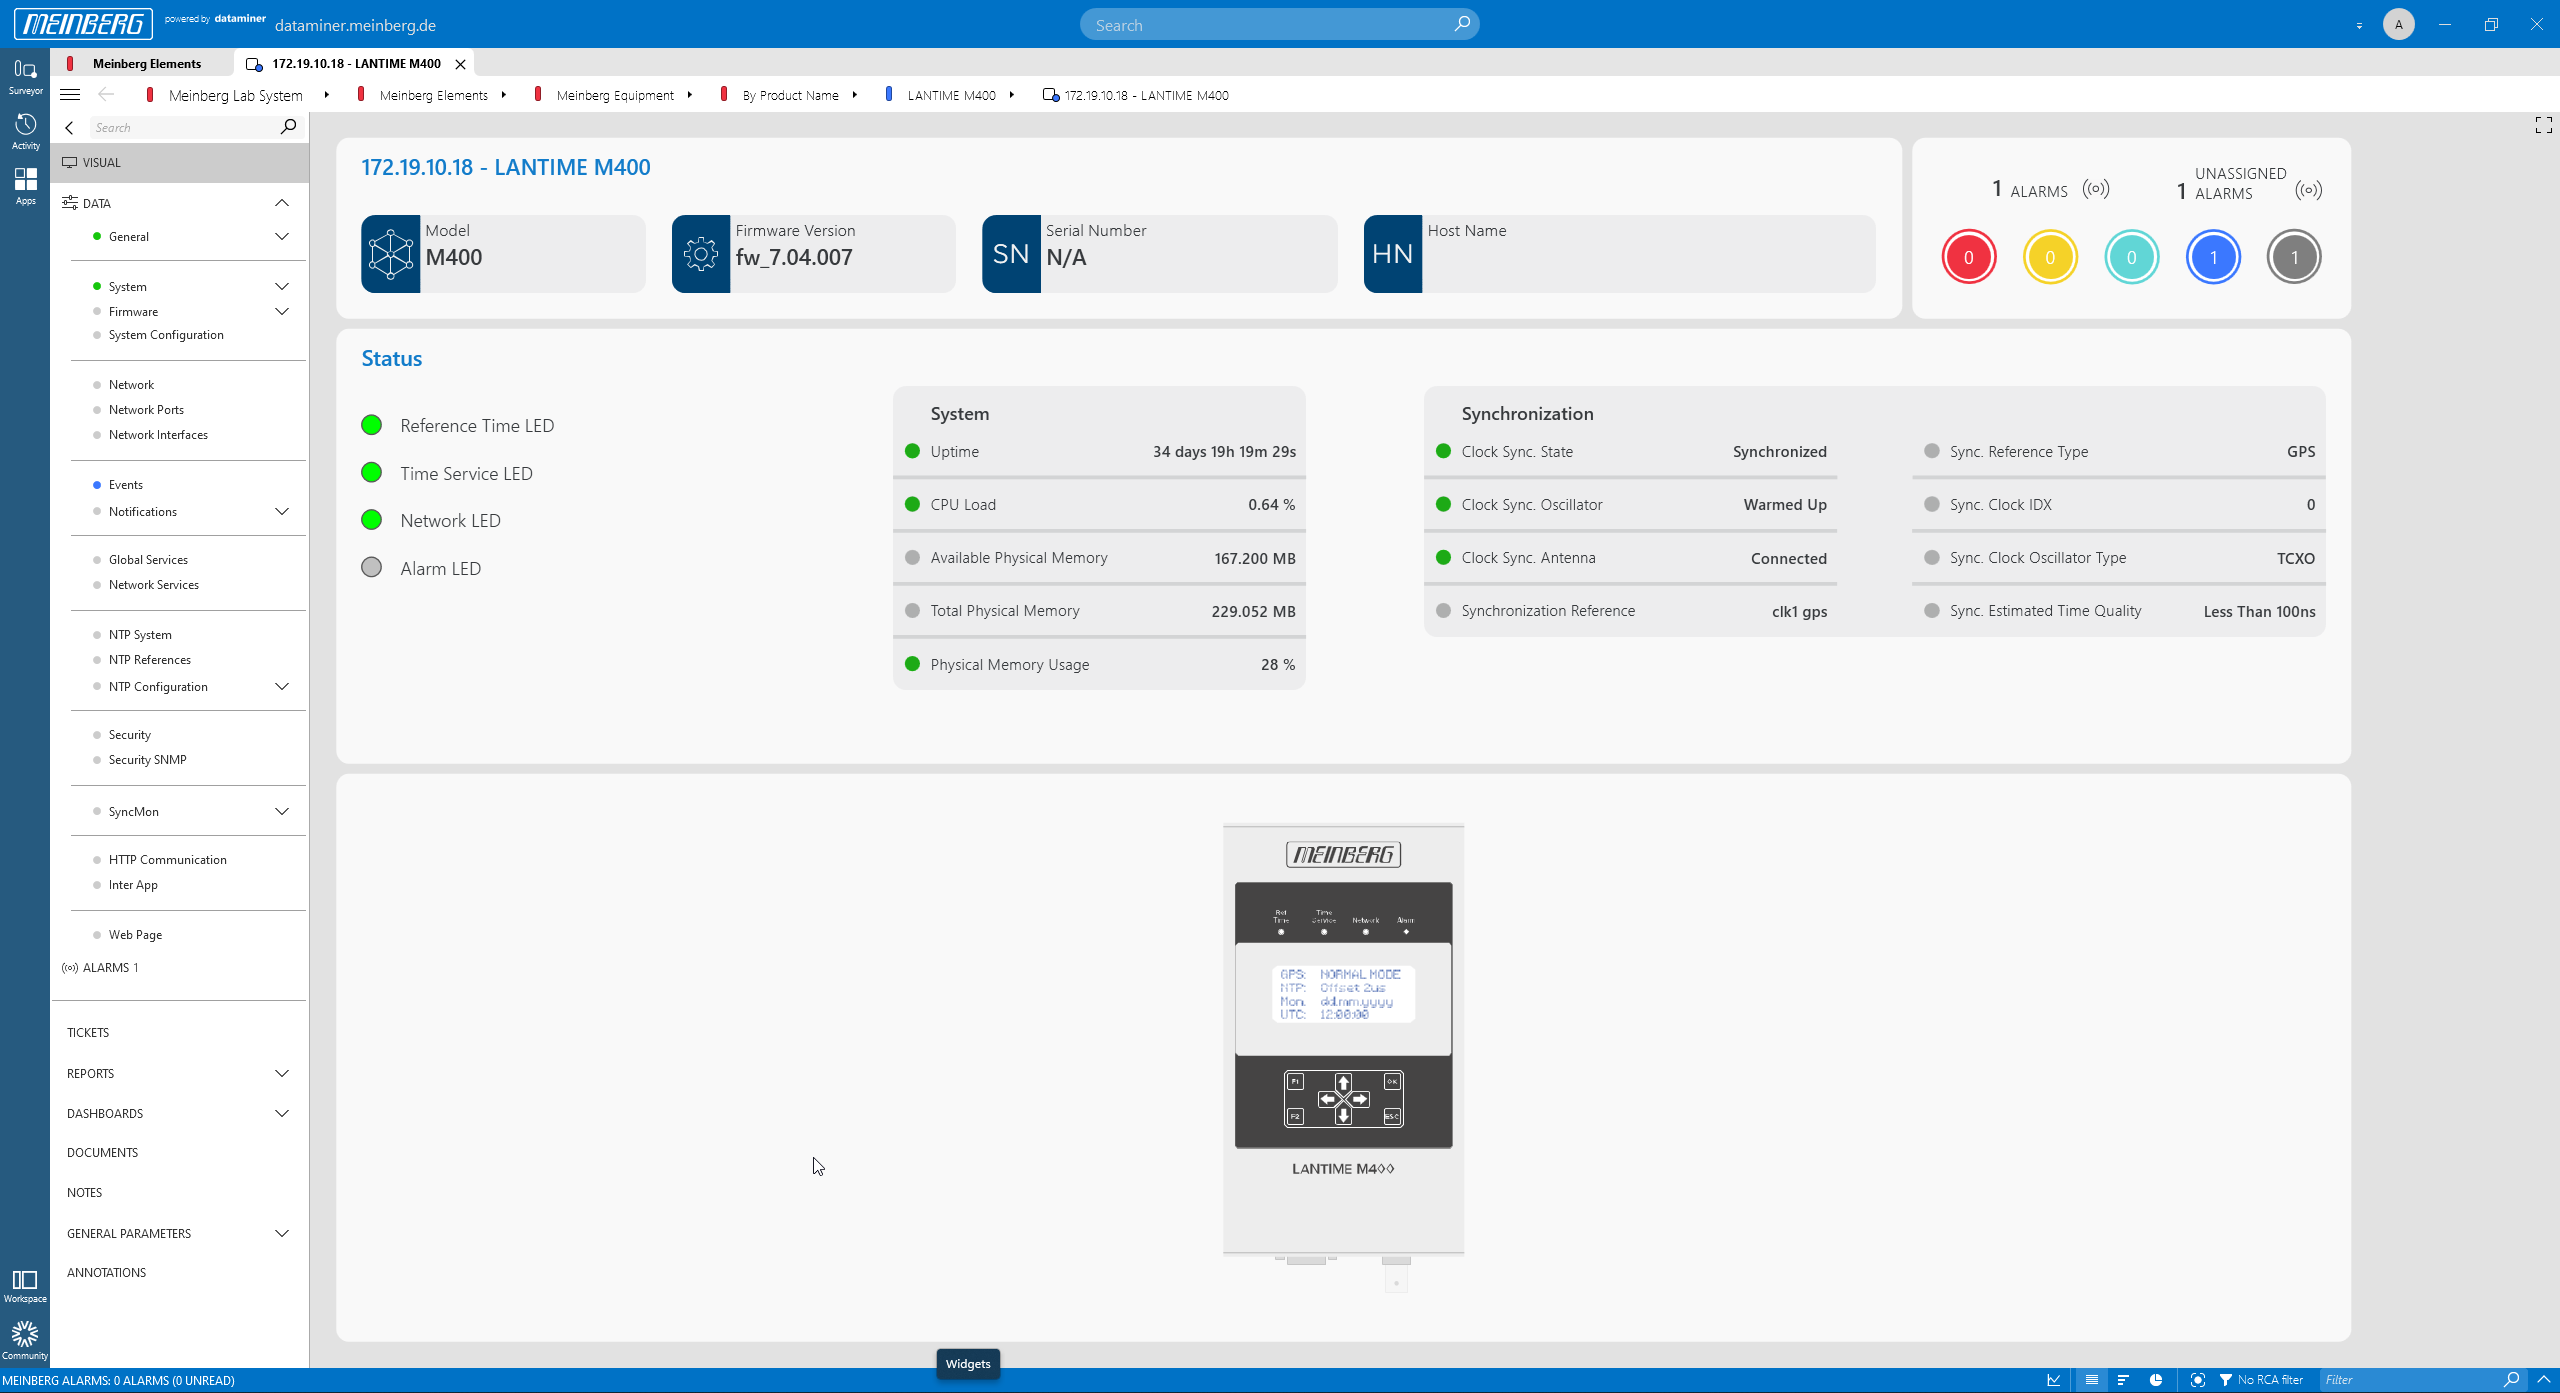 Or select one of the devices to see all details of that device. For each device there is a visual overview page, which also includes the most important metrics and KPIs.
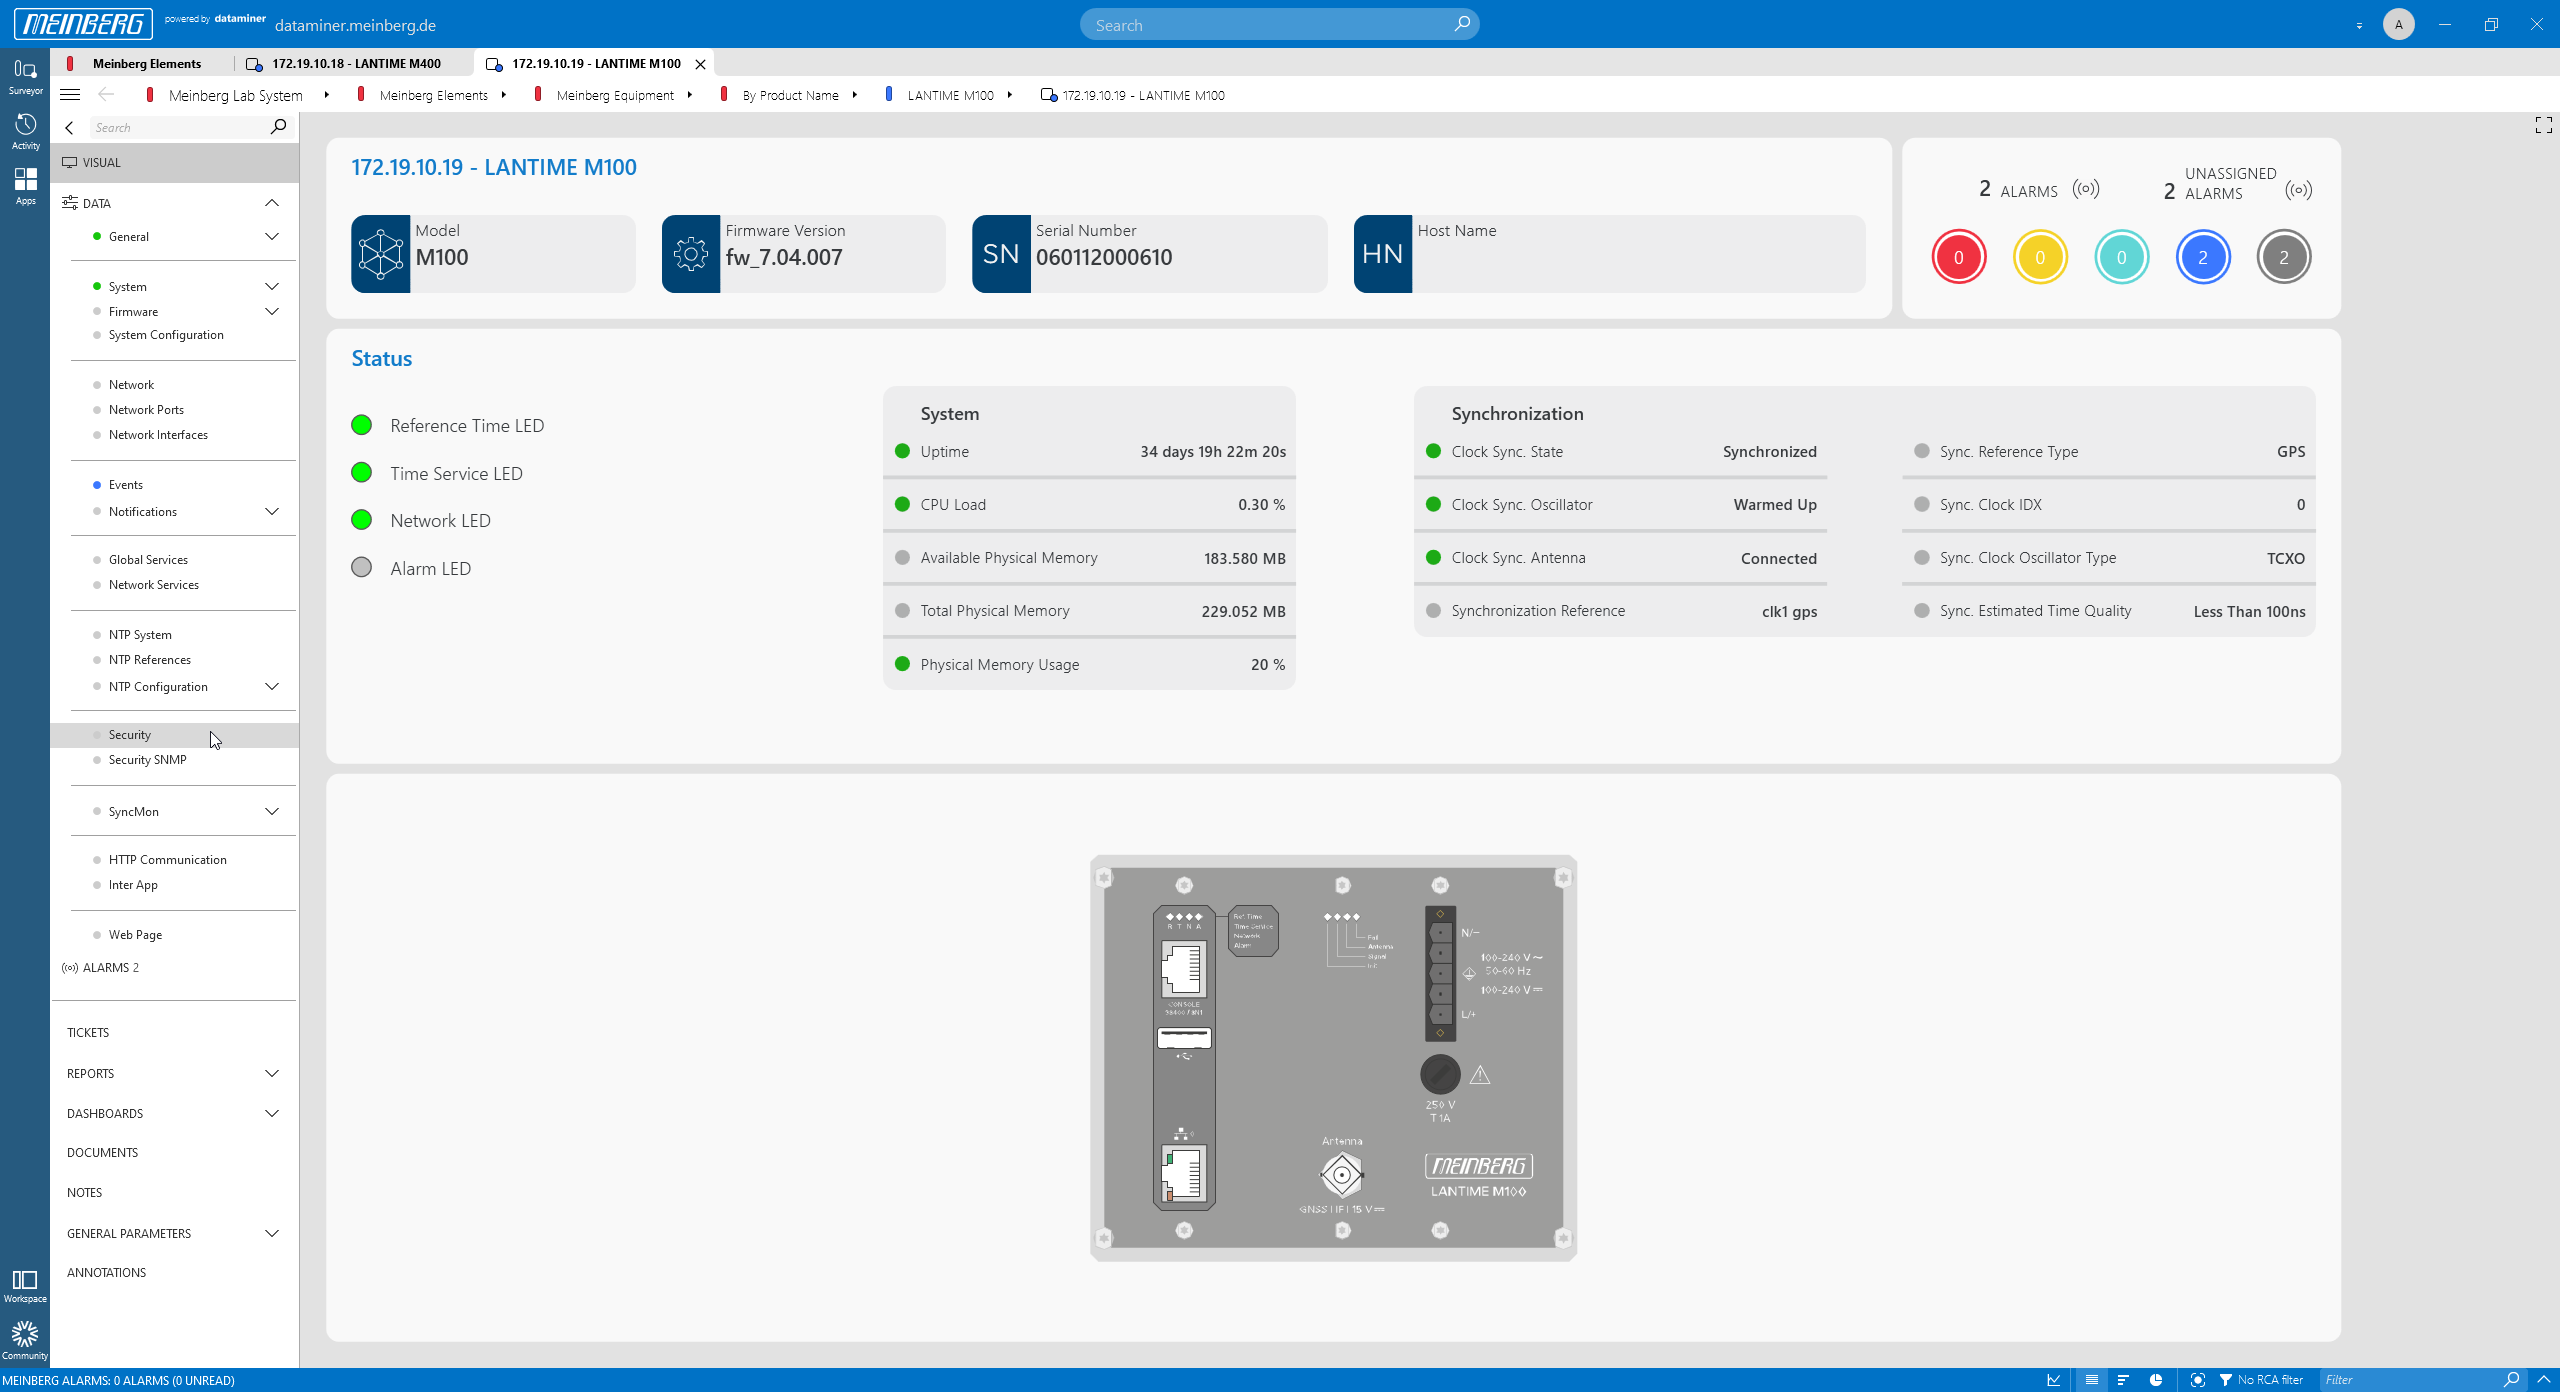 Here are some examples, starting with the LANTIME M100.
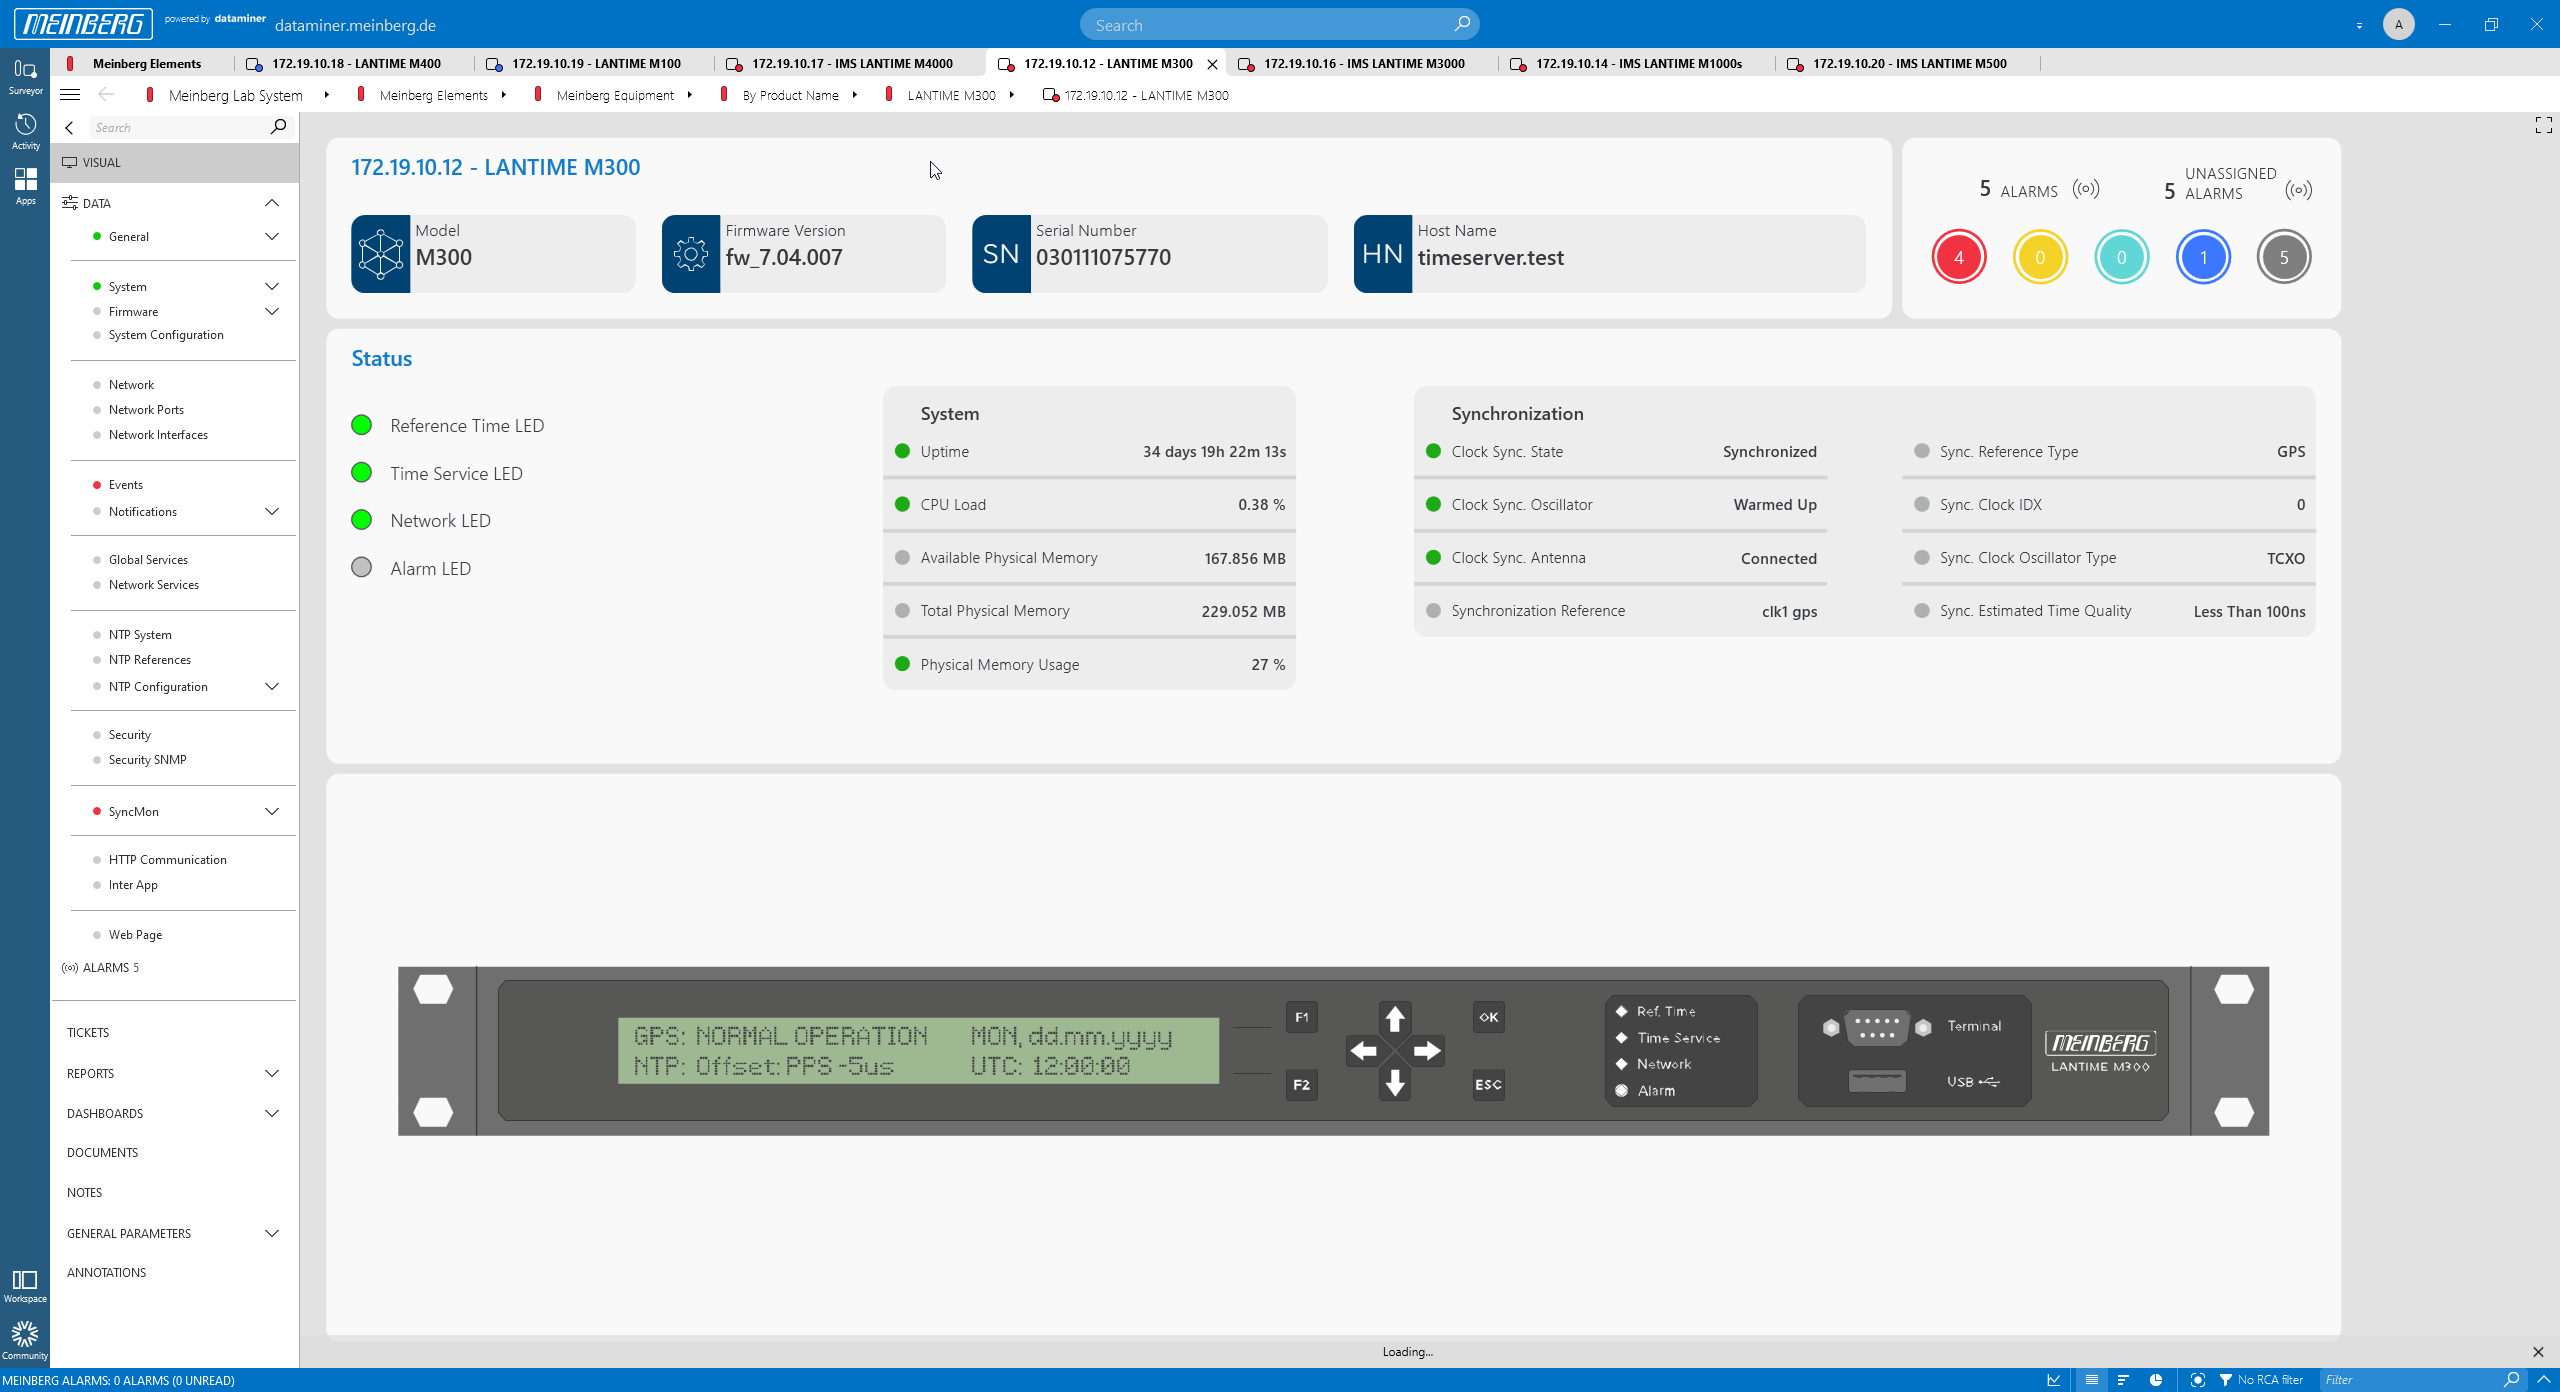 LANTIME M300
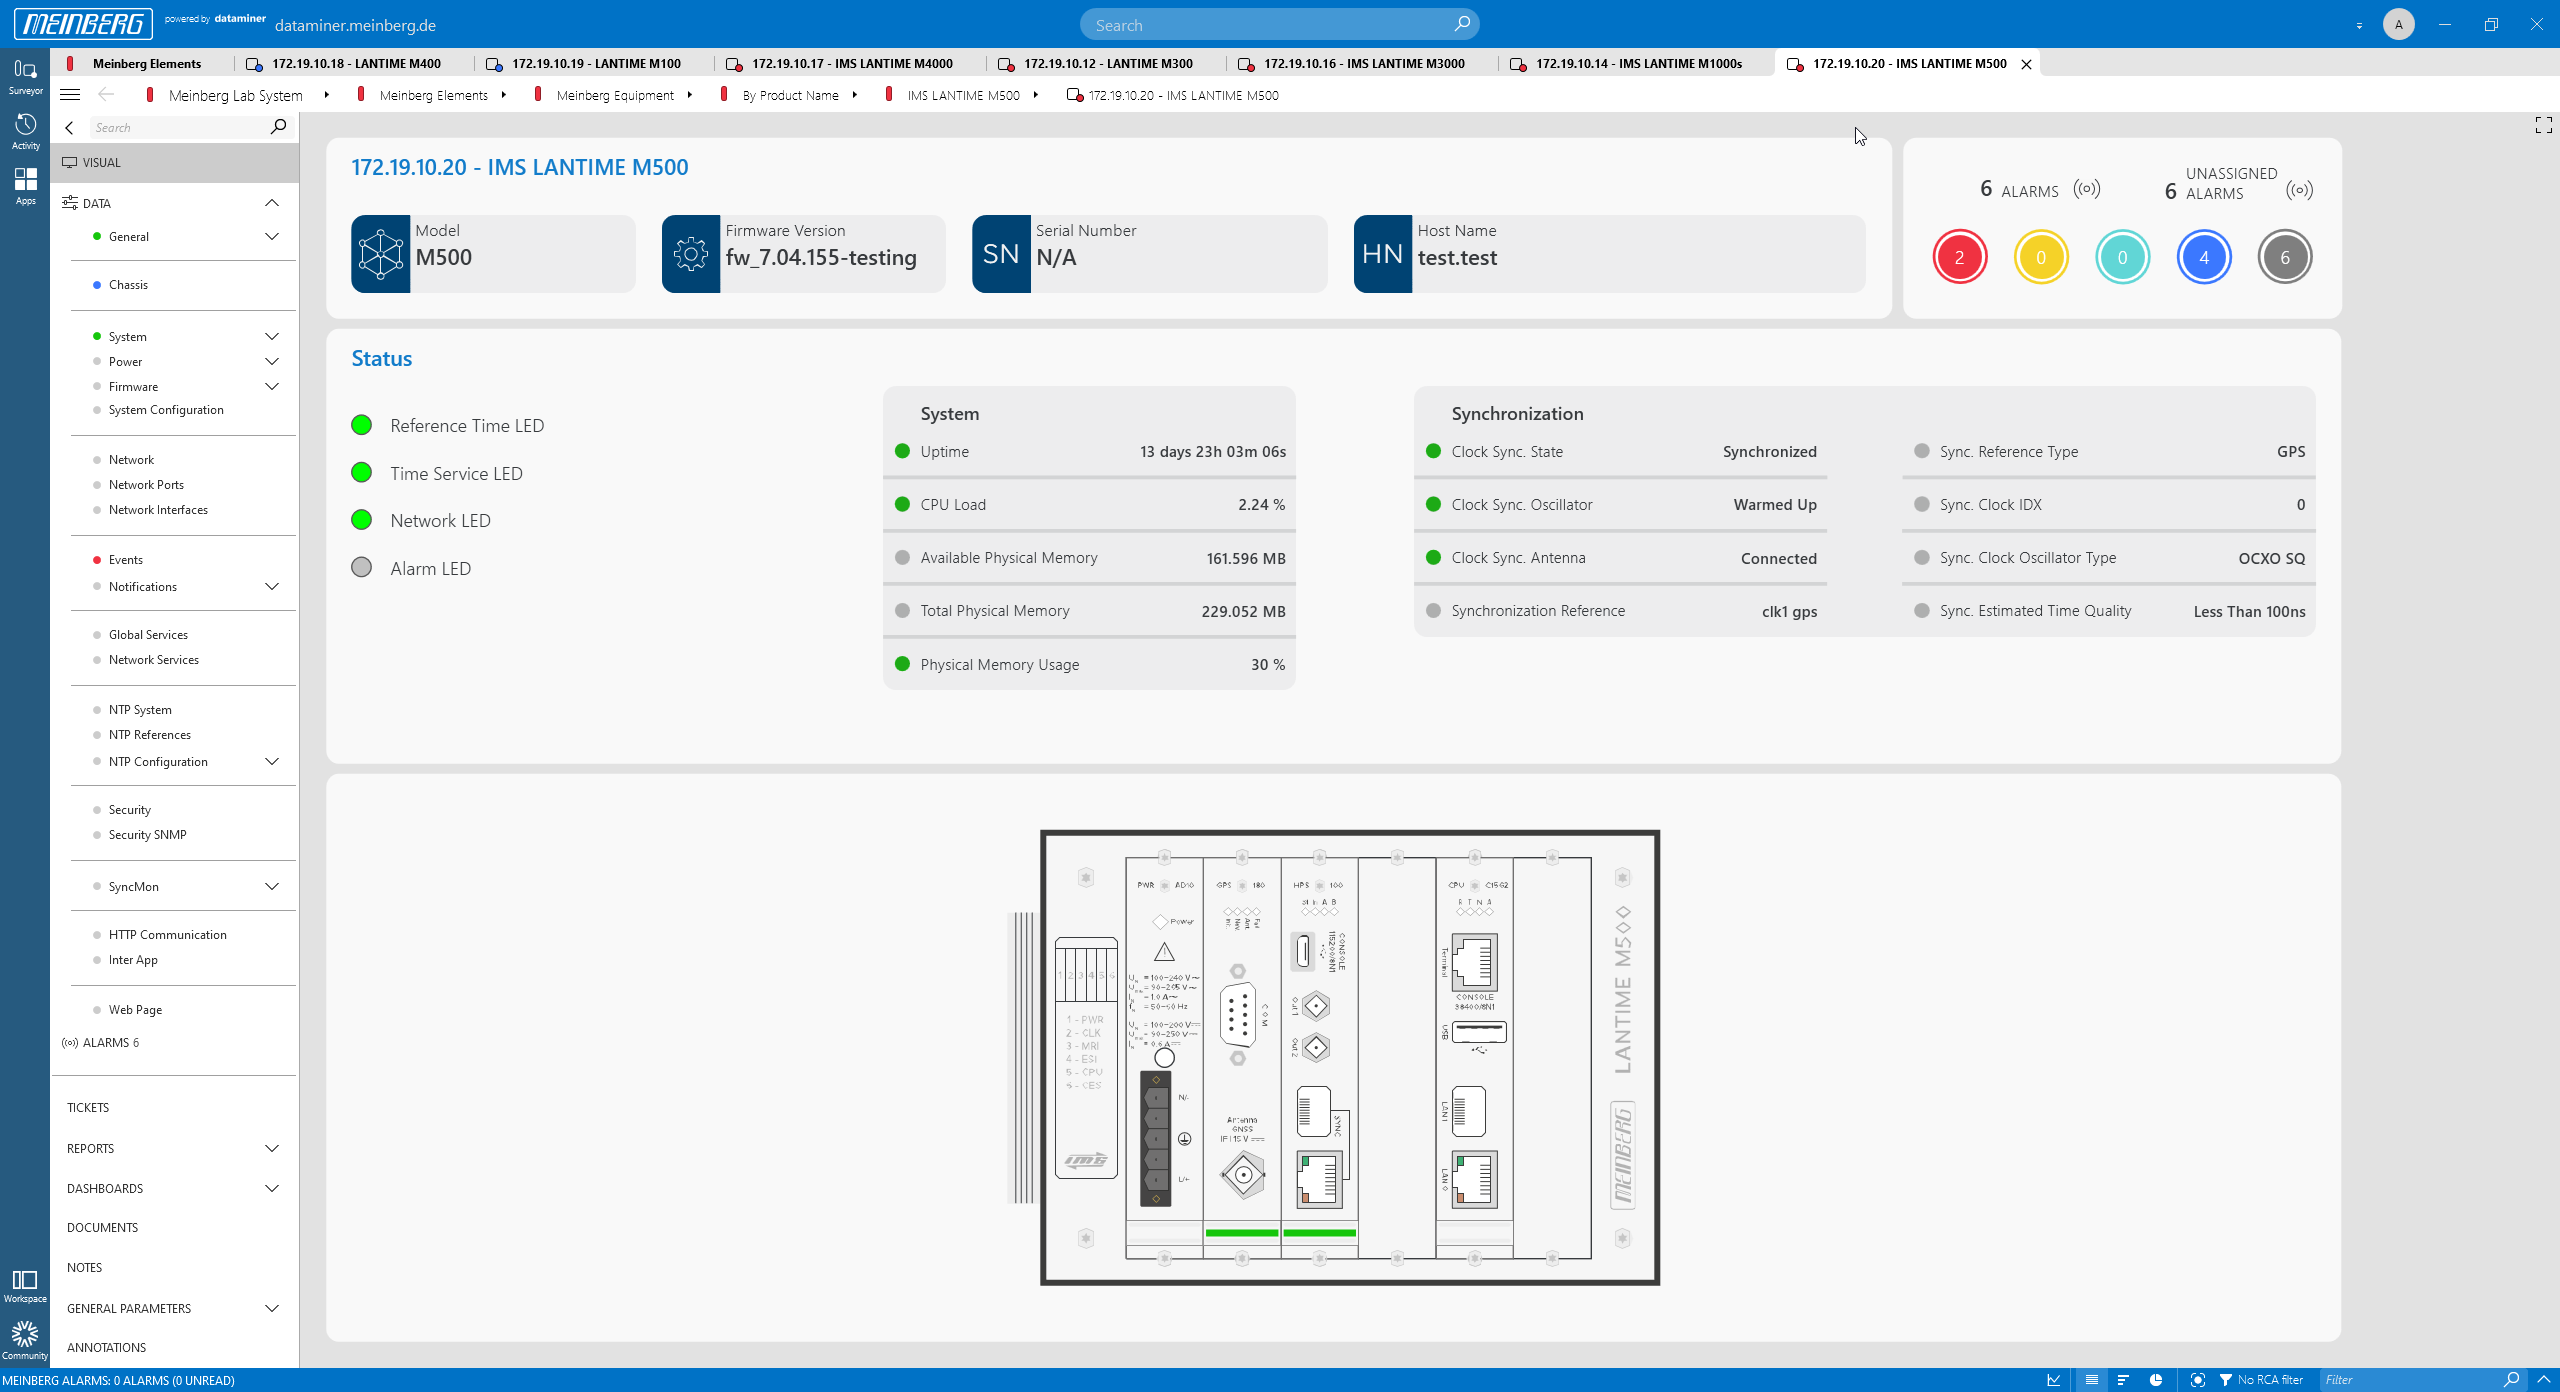 LANTIME M500
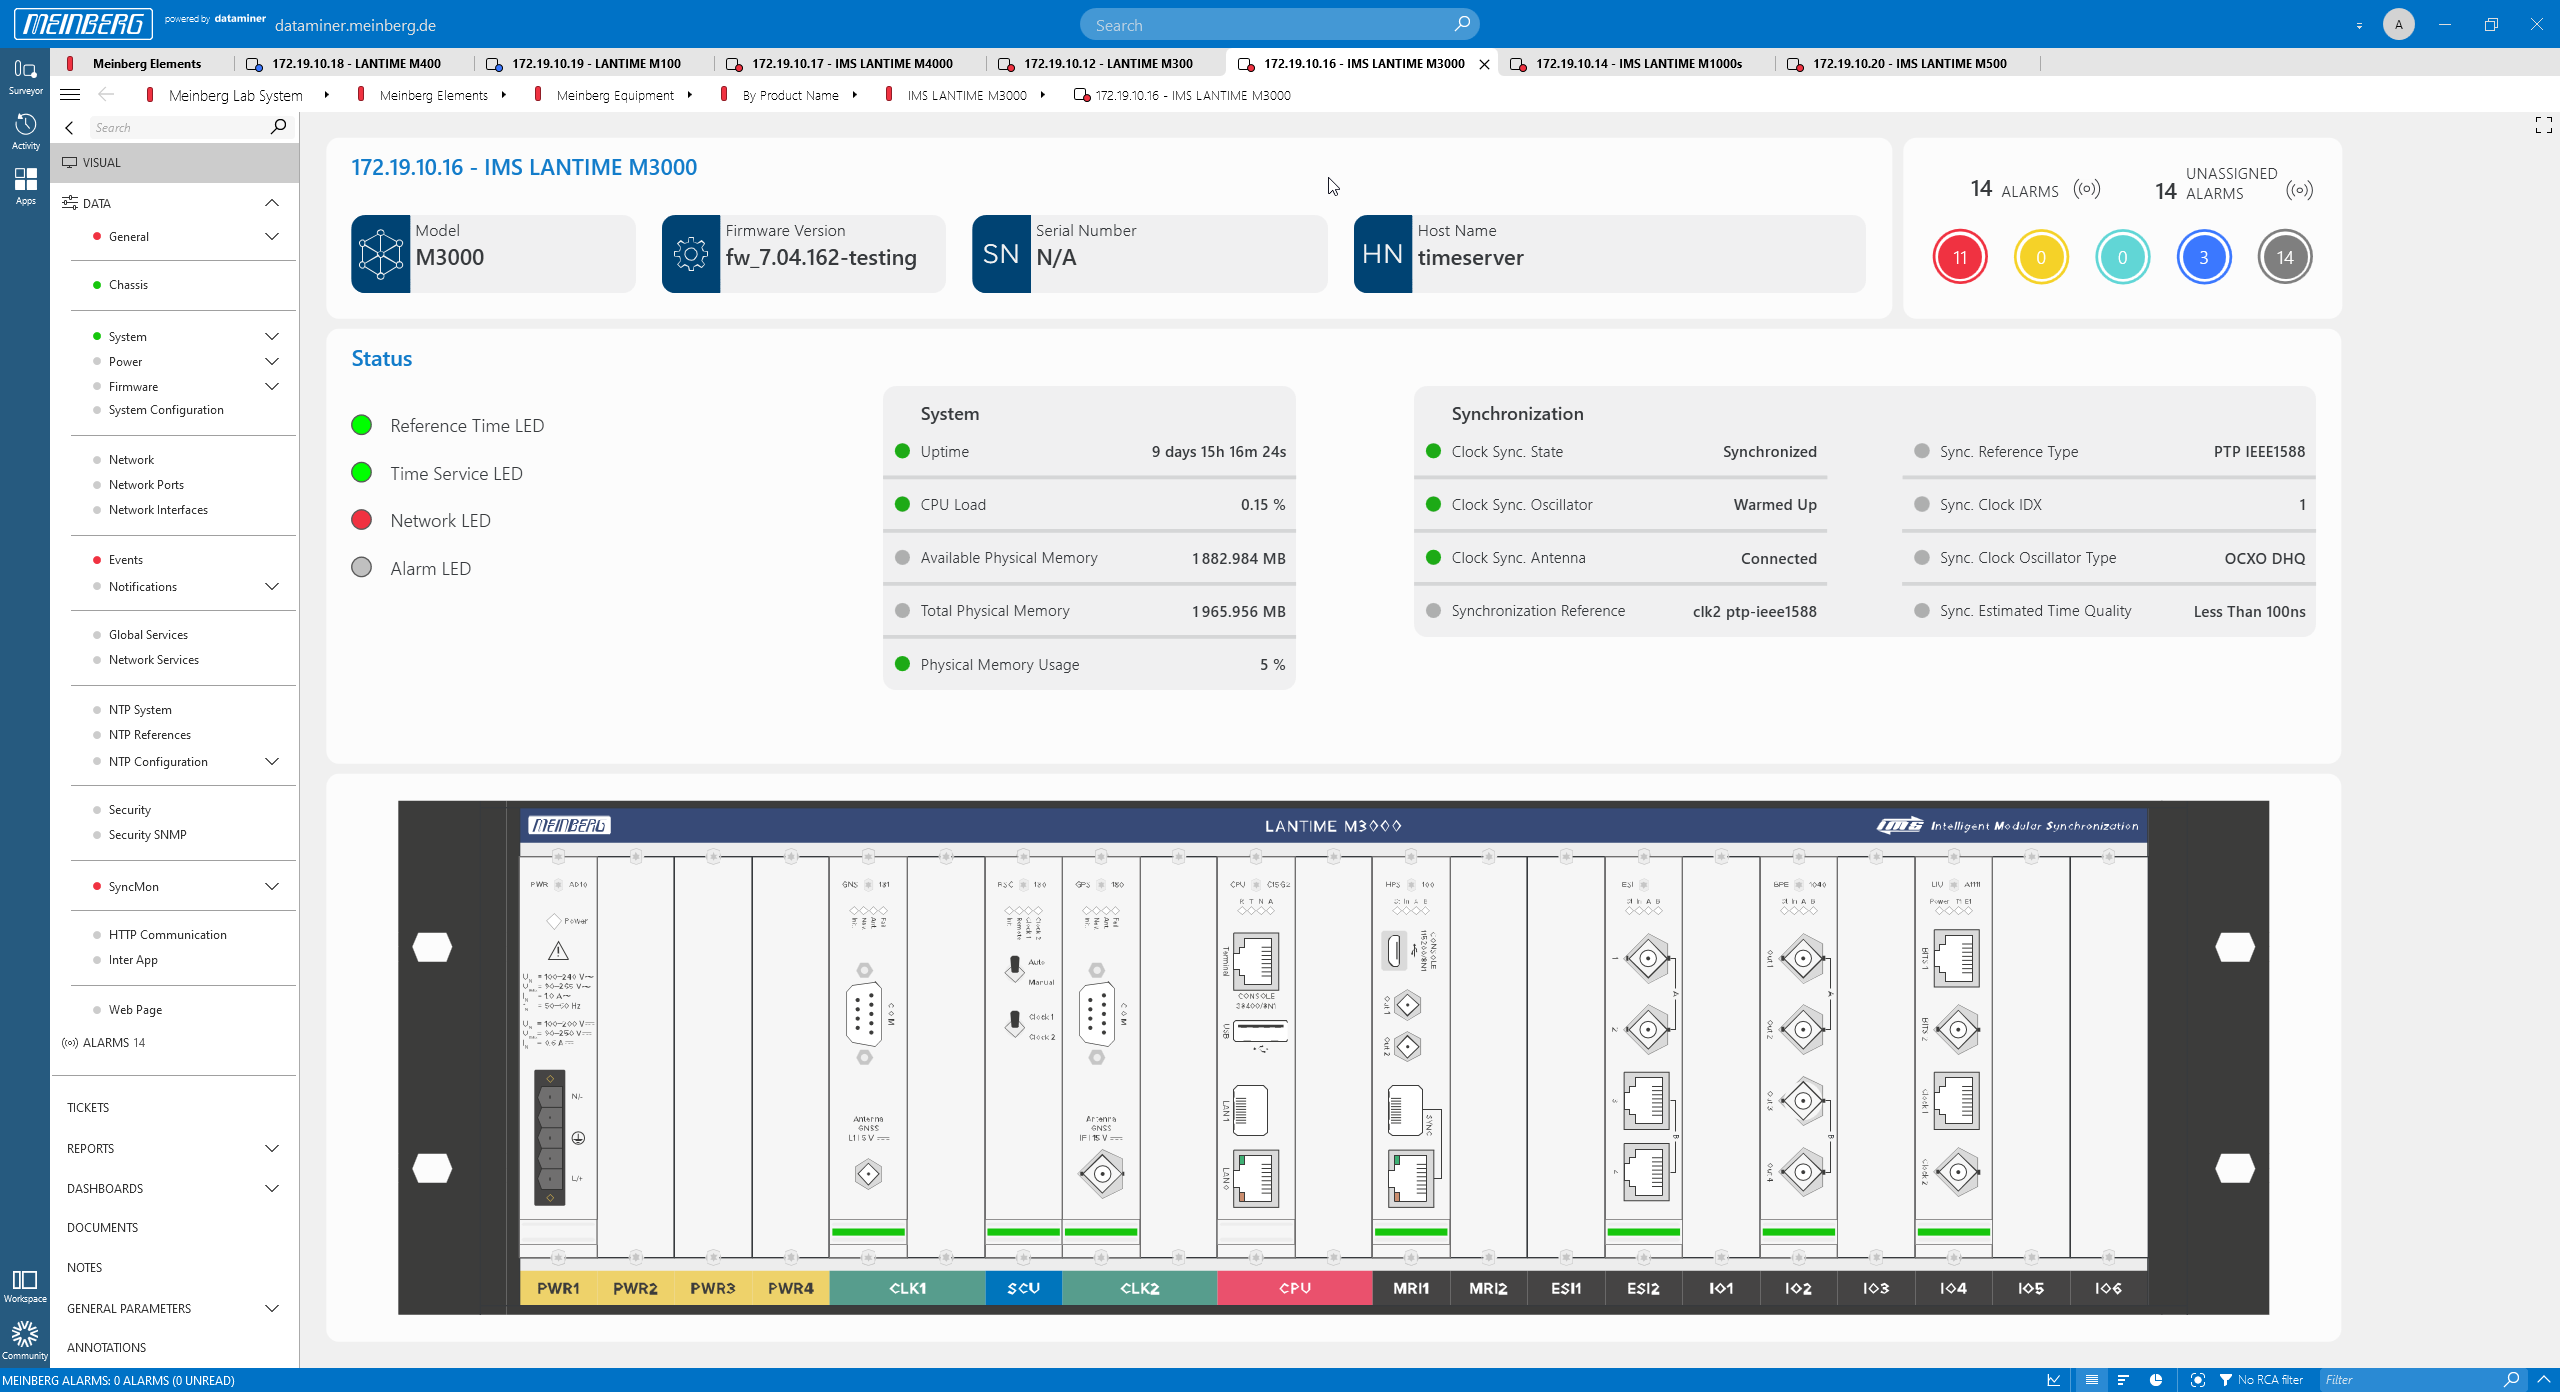 The mbgNMS not only detects non-modular Meinberg devices, but also modular ones. Here is an example of a LANTIME M3000 device. All cards are automatically detected, i.e. when you add or remove a card, the device picture will automatically be adapted as well.
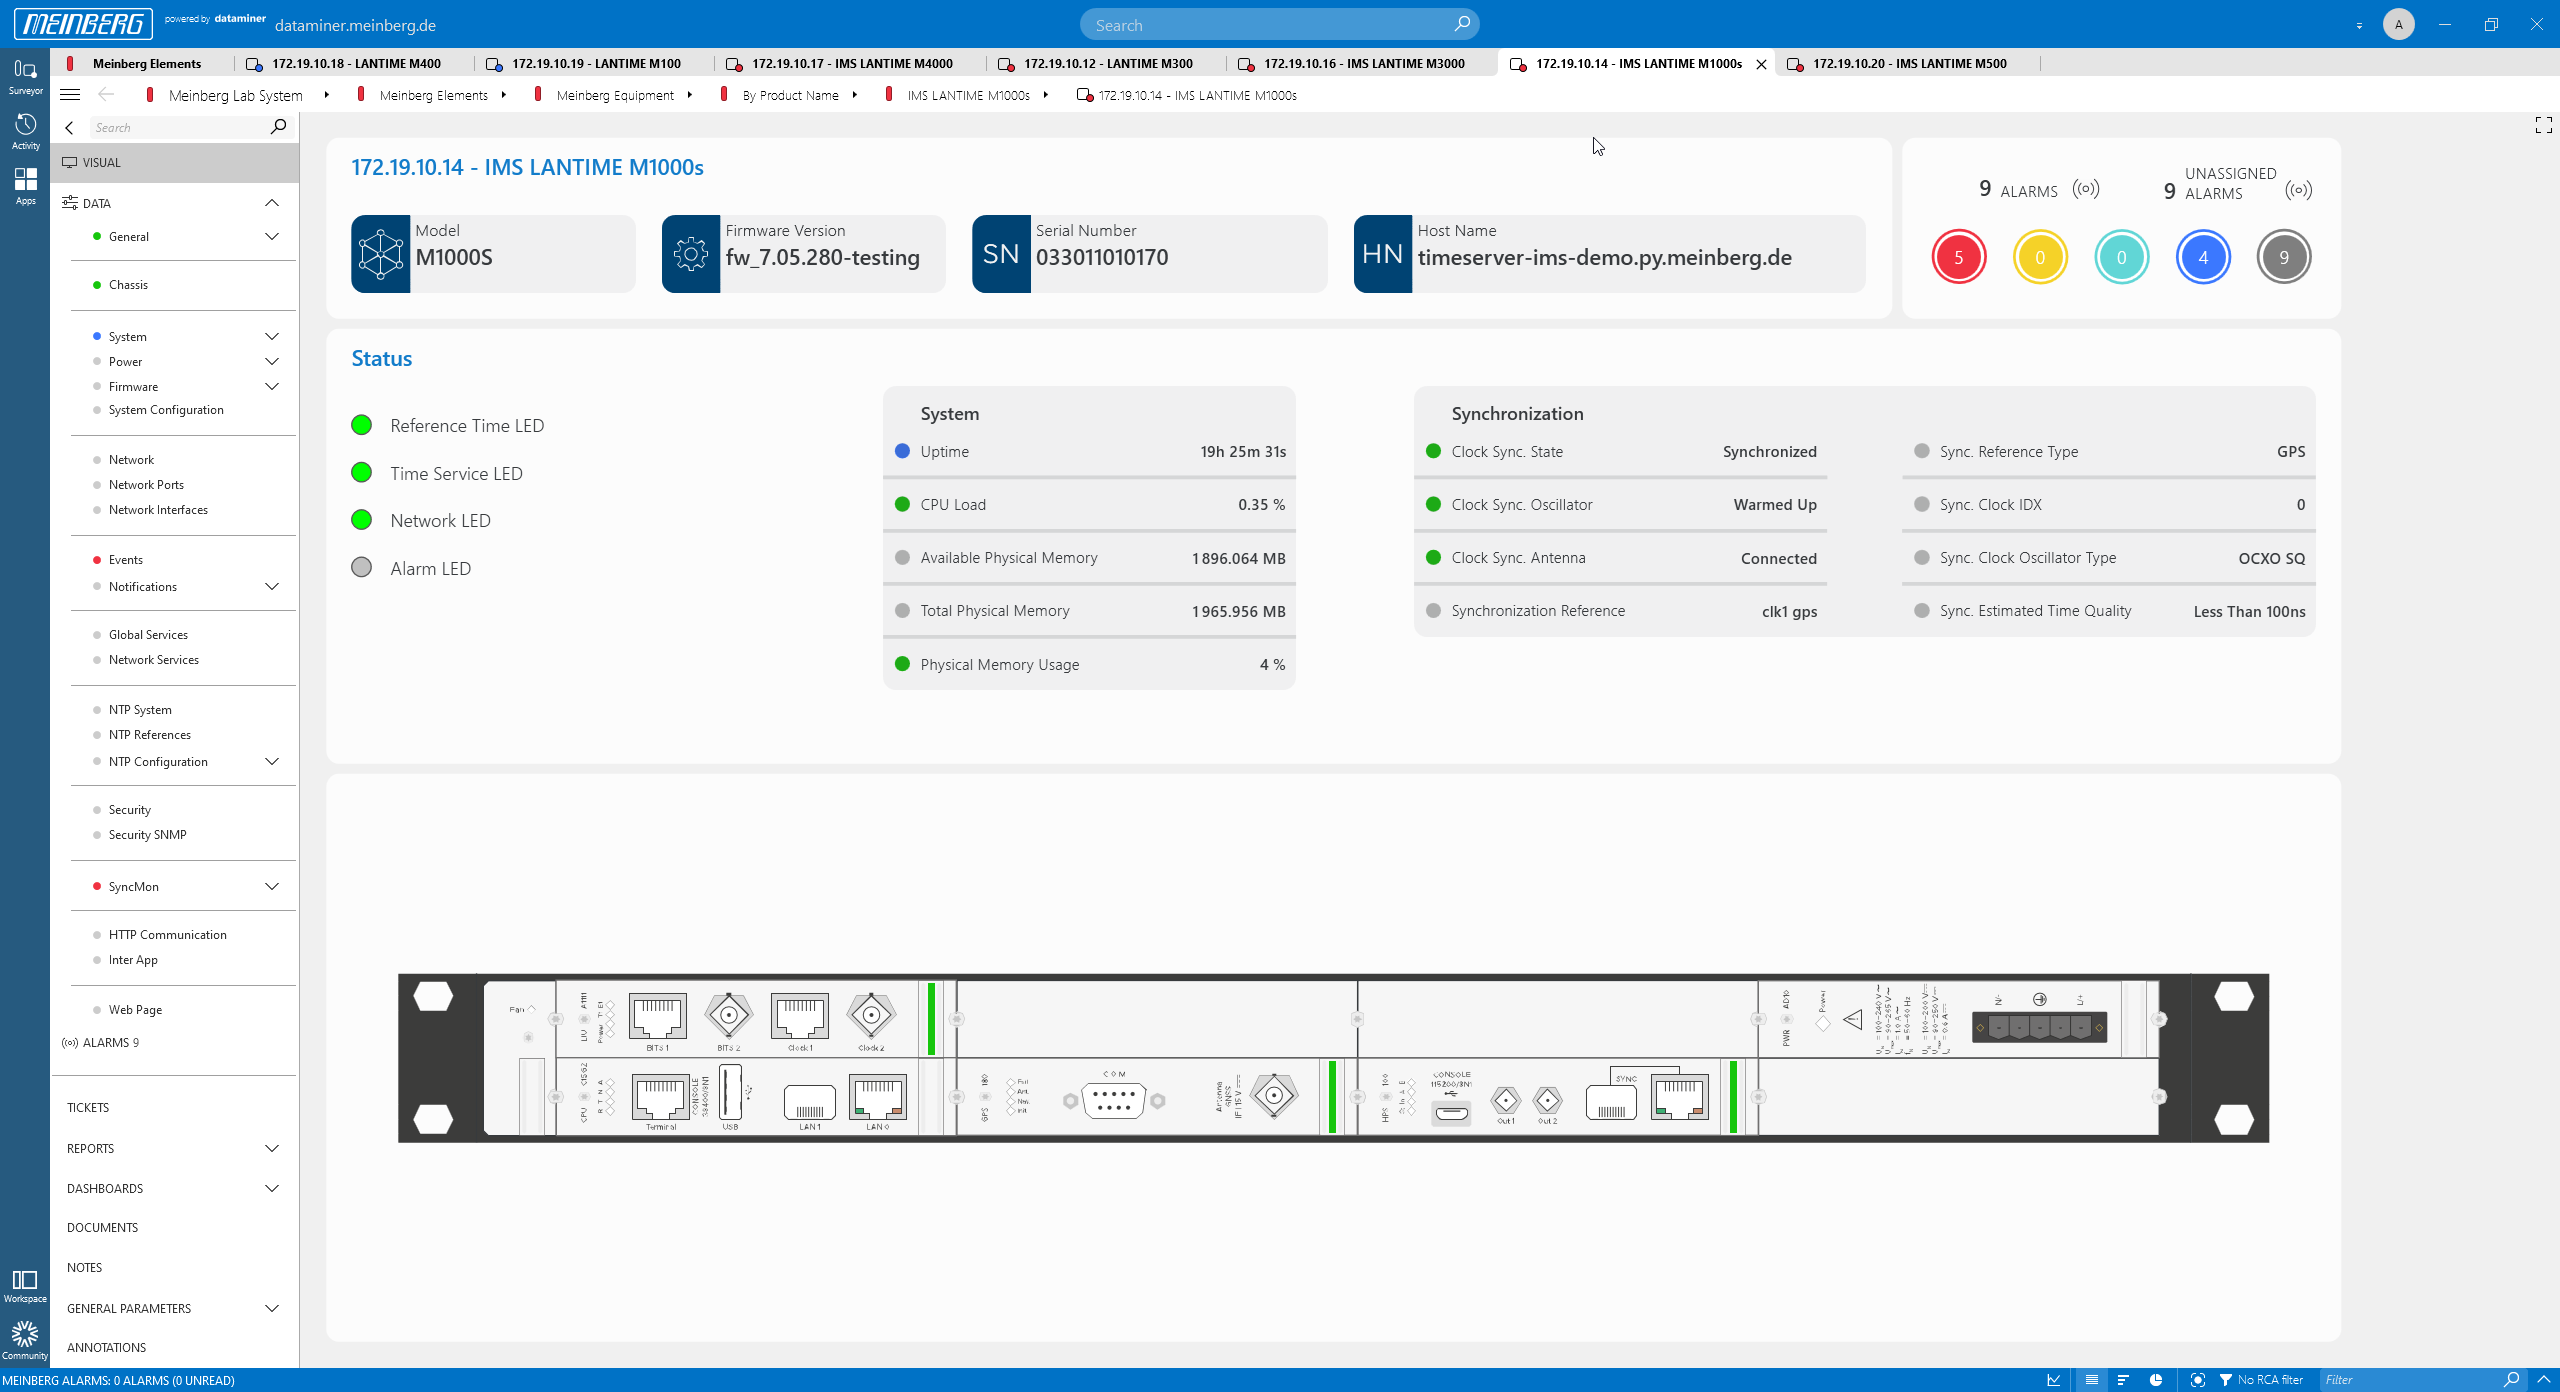 Here is a LANTIME M1000s device. Every device, chassis and card comes with plenty of parameters, grouped in data pages.
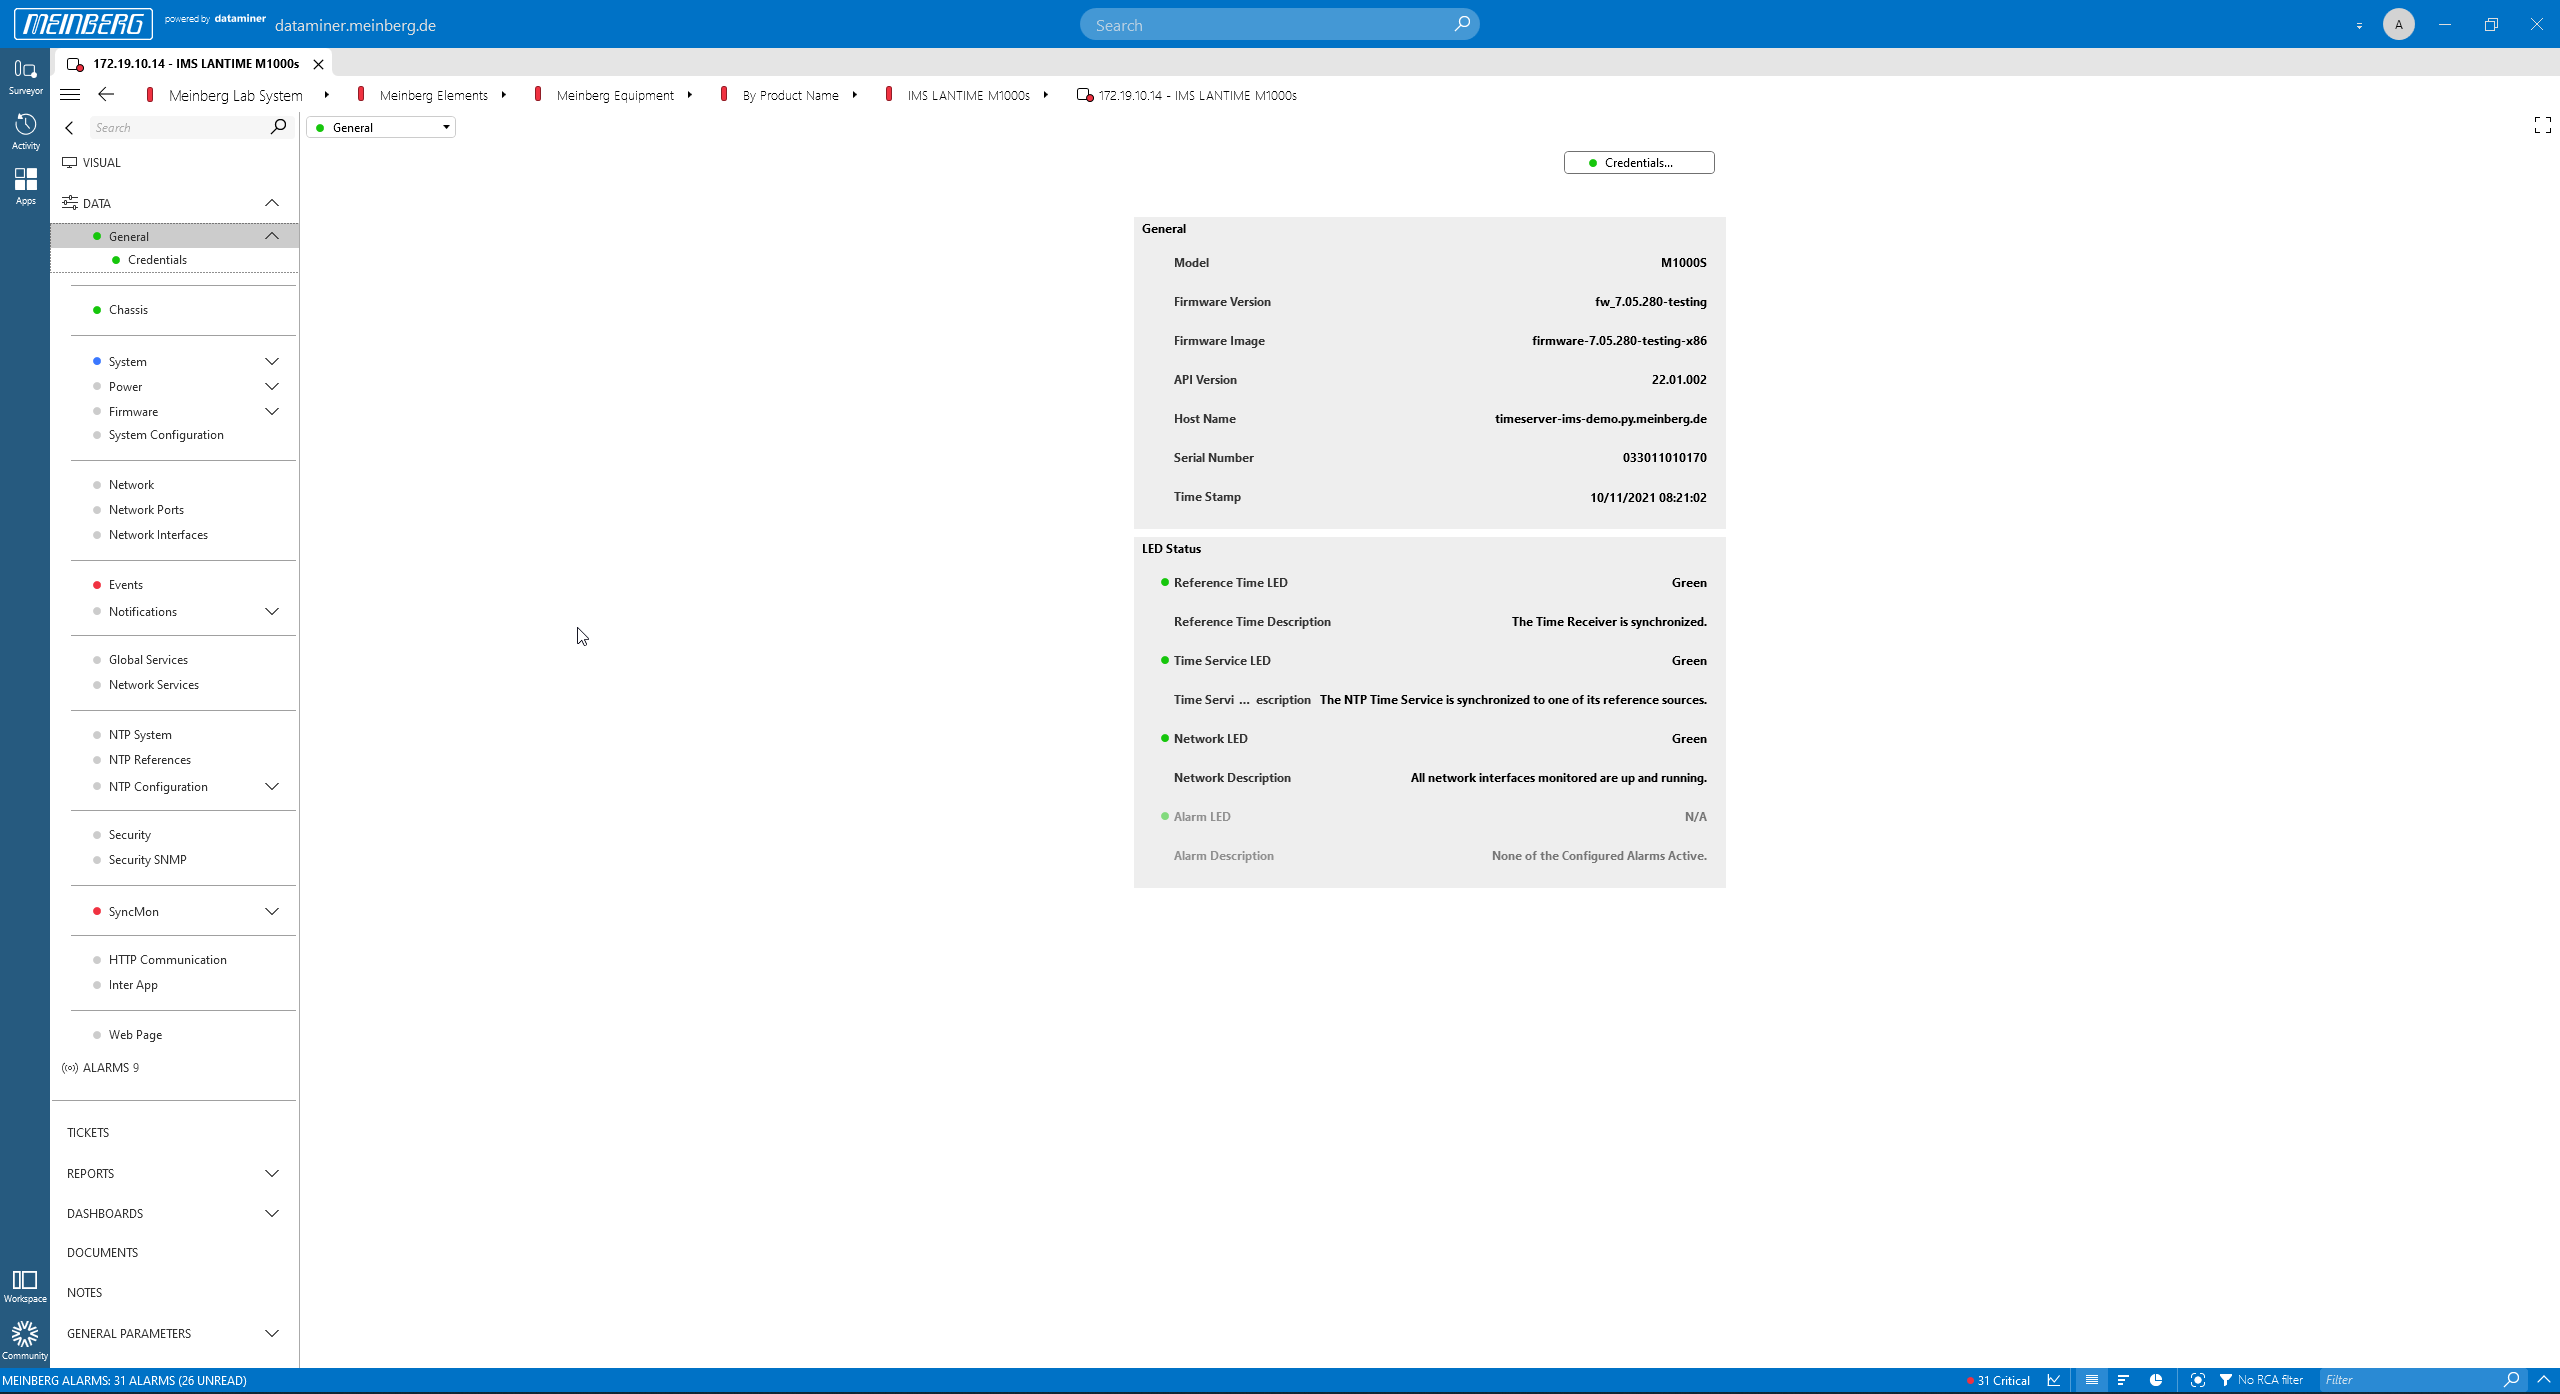 This is an example of a data page for the M1000s chassis, the "General" page.
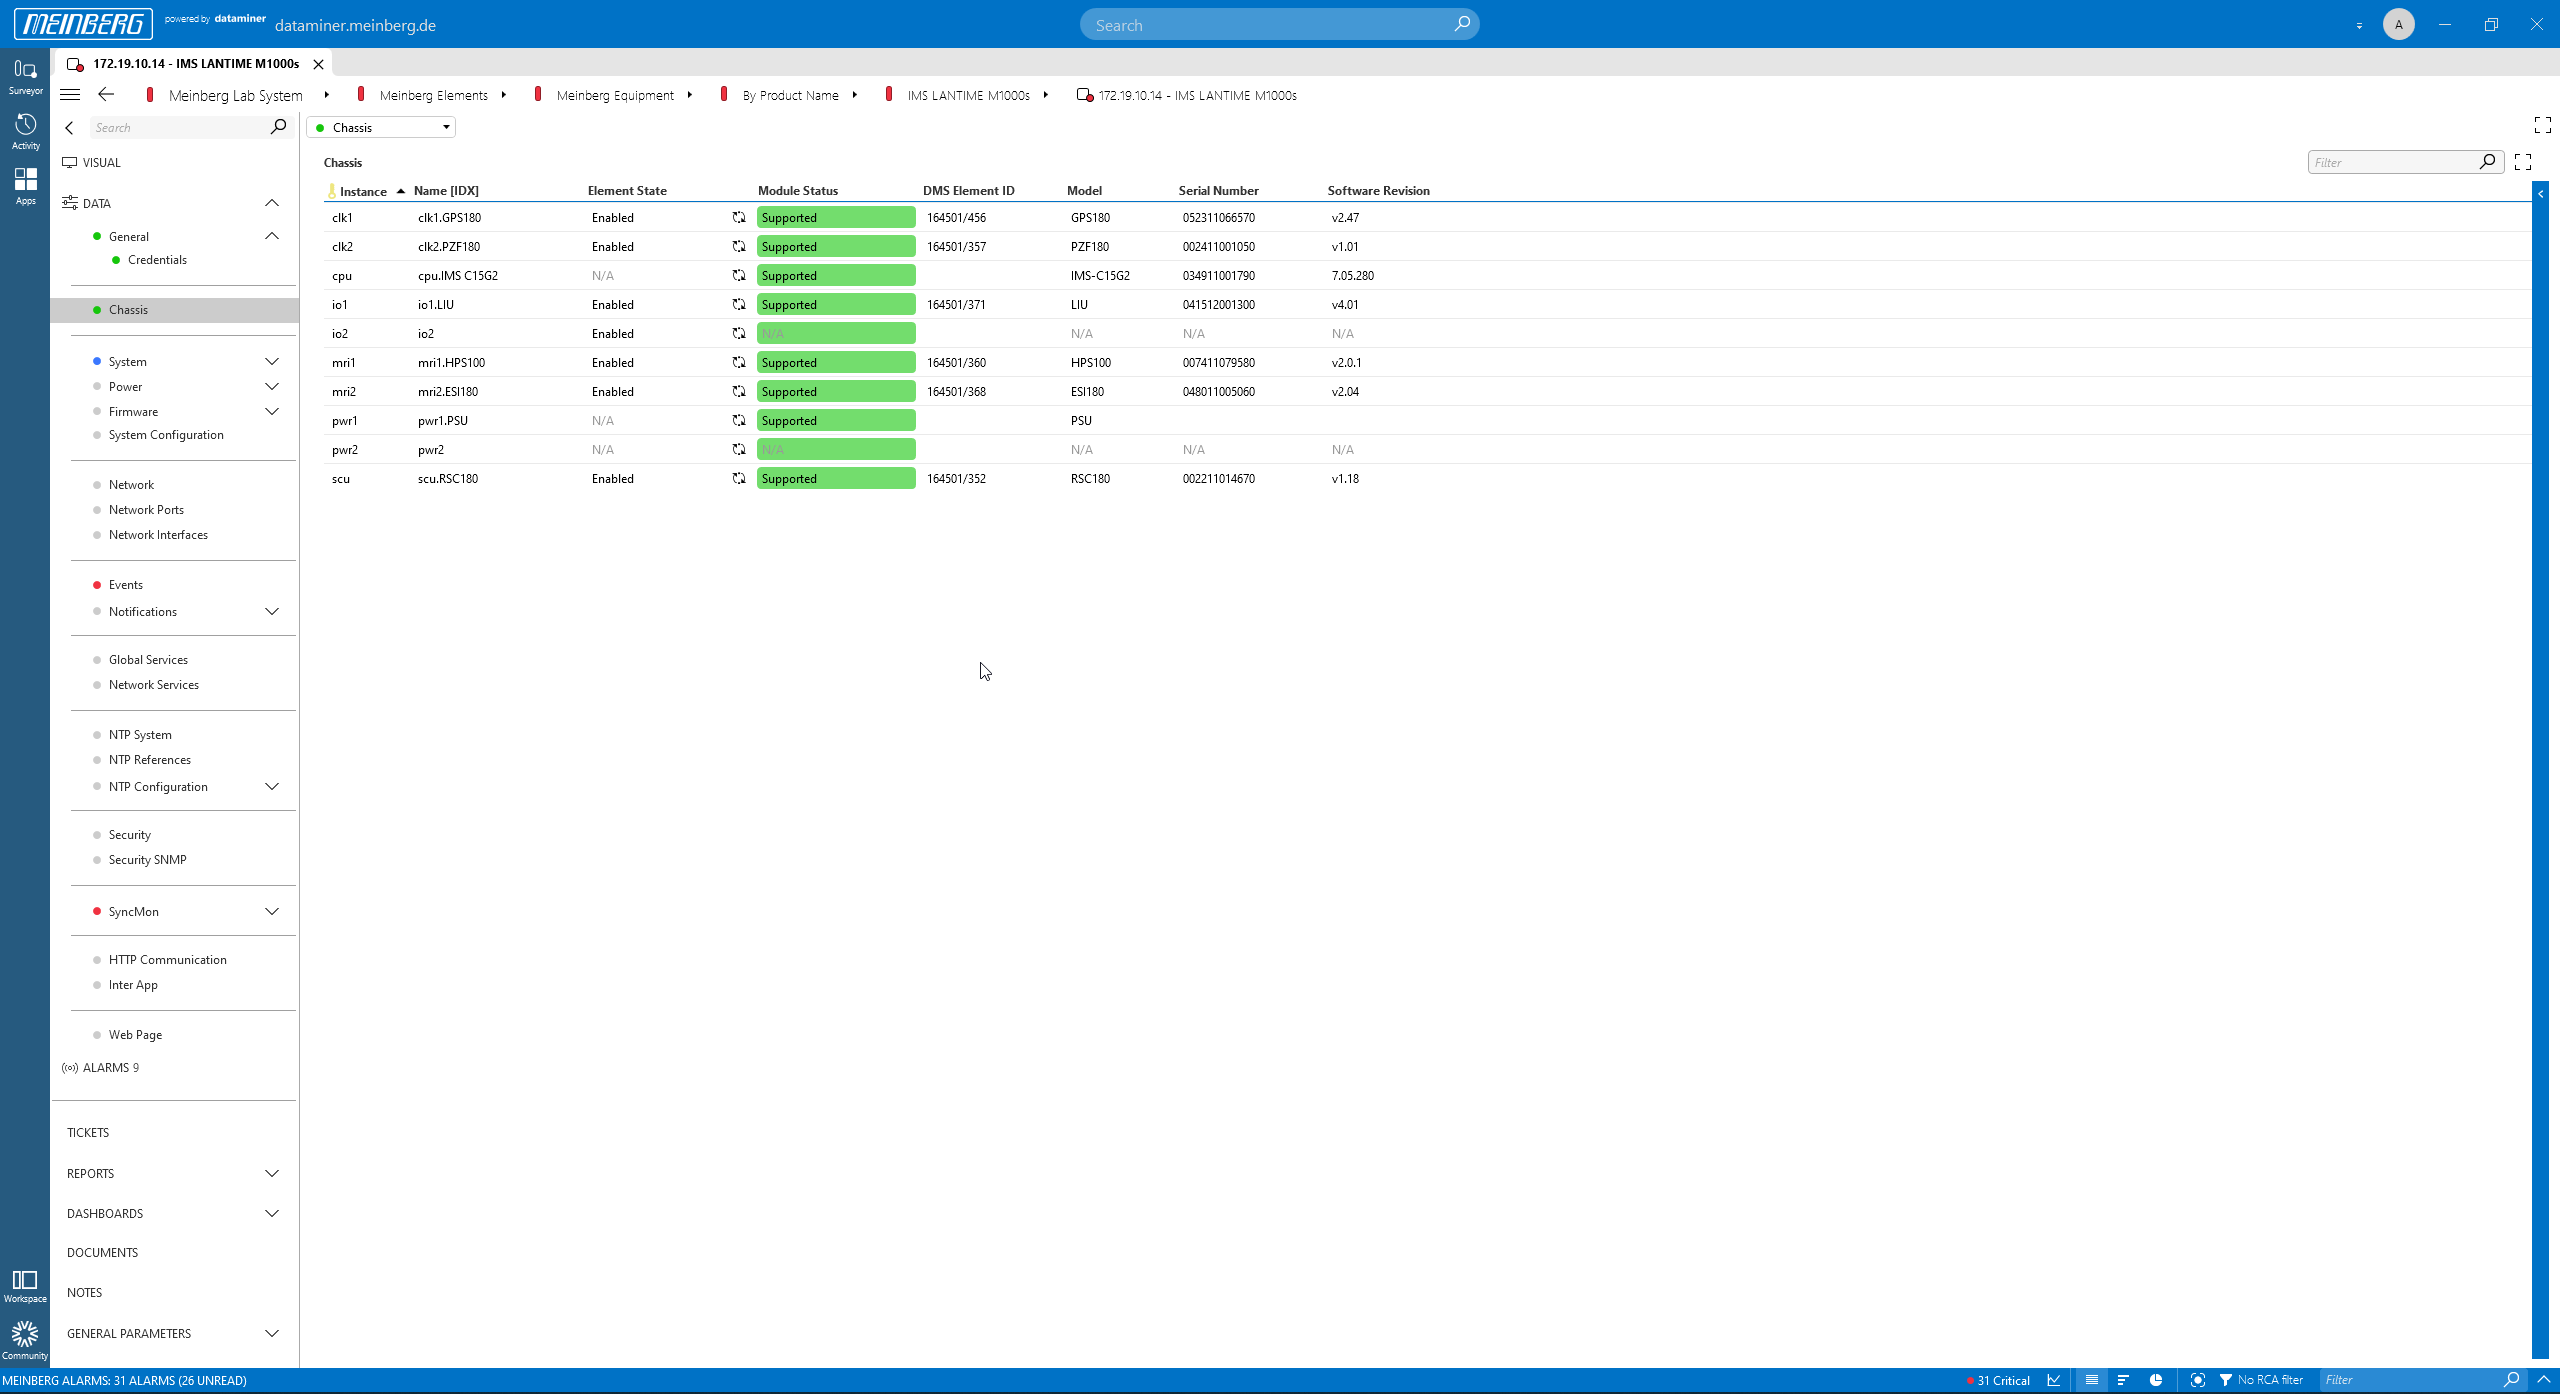 The "Chassis" page shows all detected cards, with the model, the serial number and the card's revision.
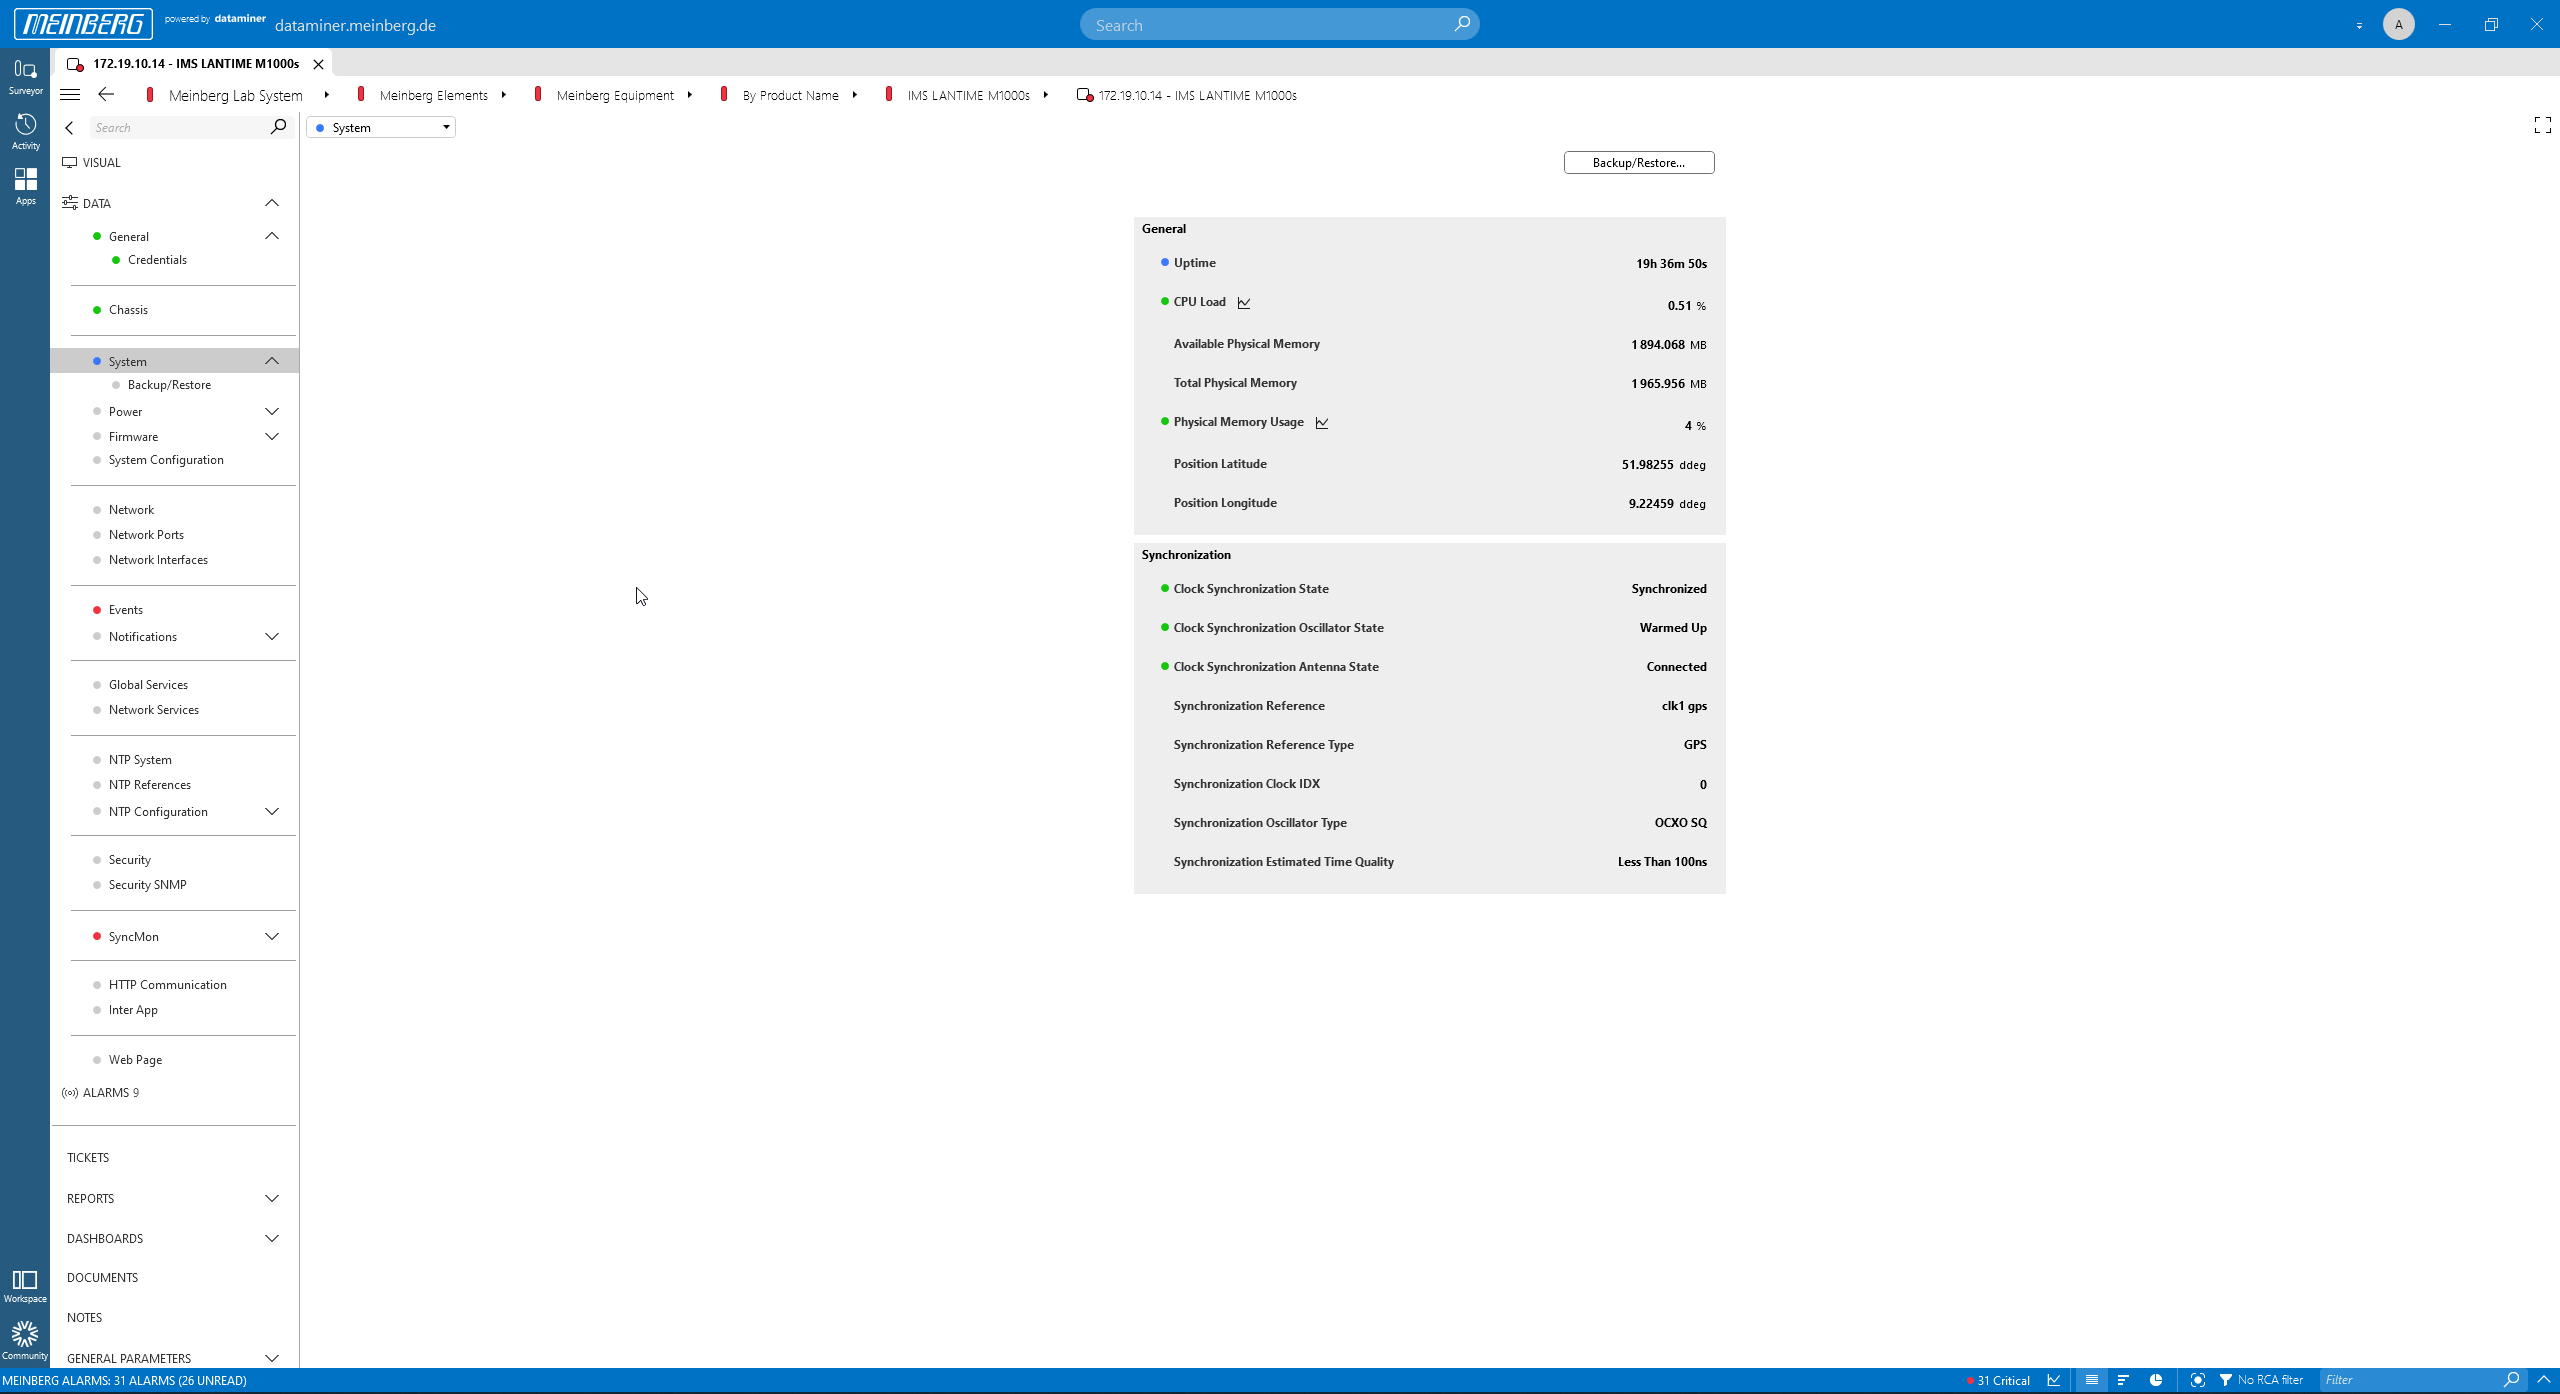 The "System" page shows the CPU load, memory usage, etc.
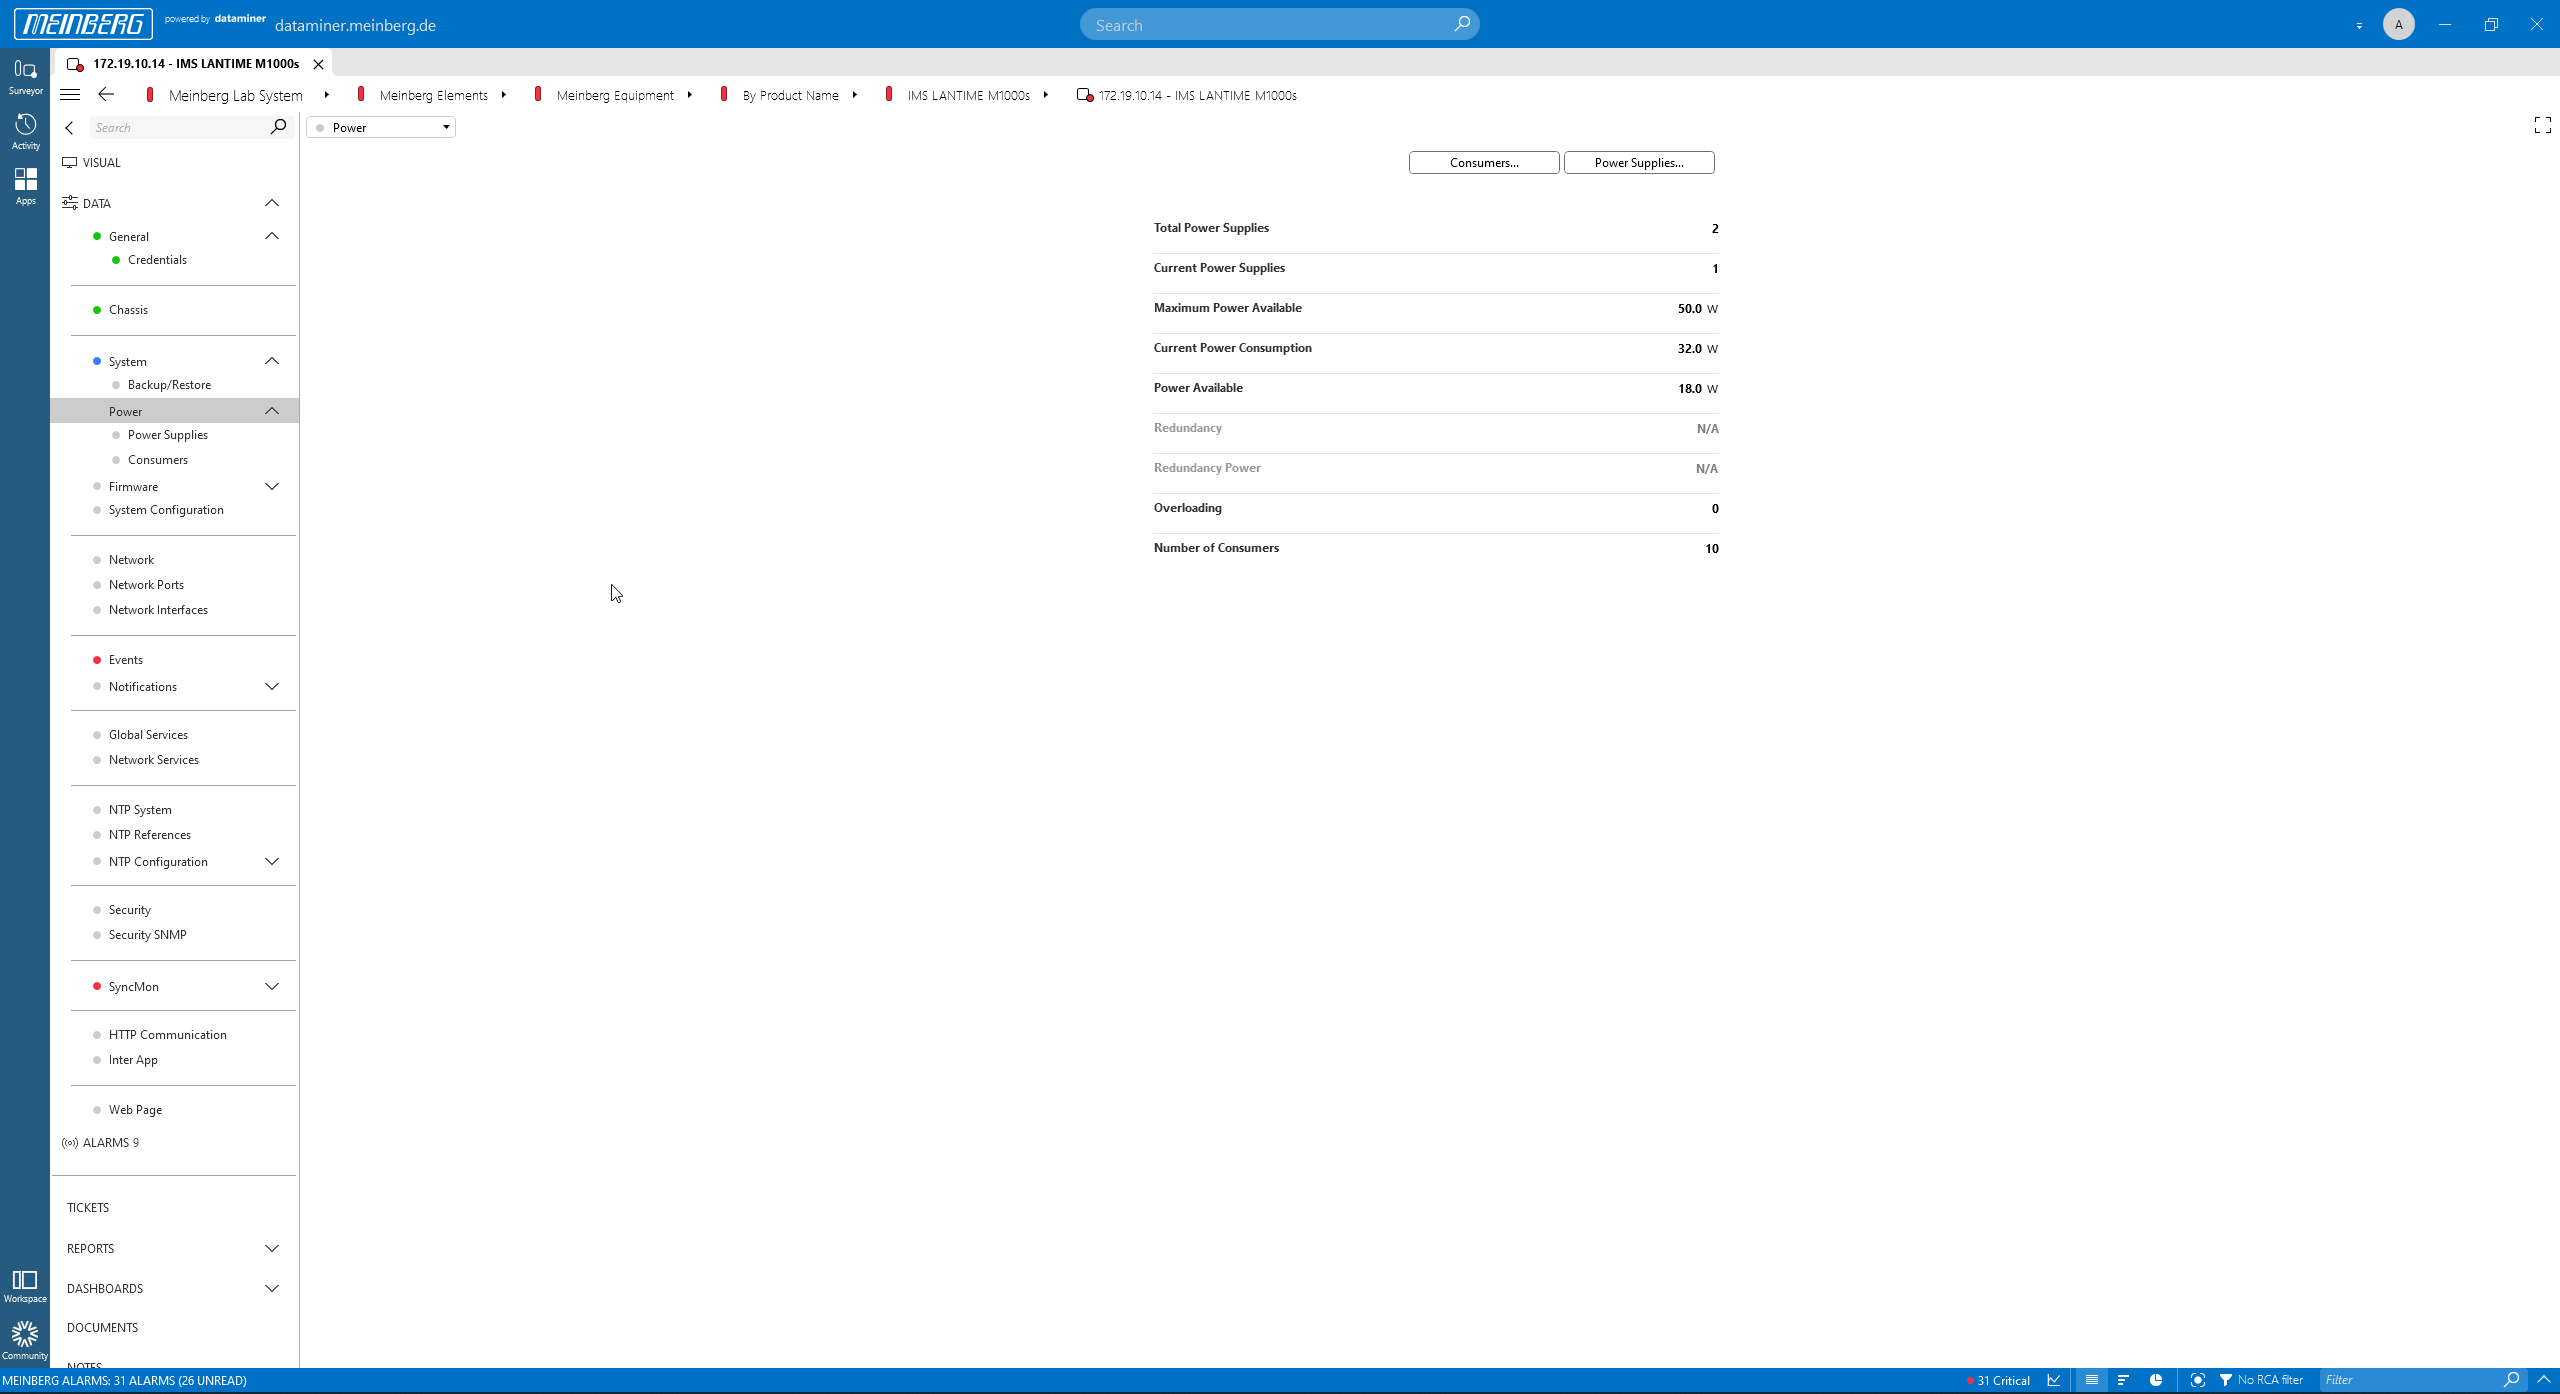 The "Power" page shows power supply information.
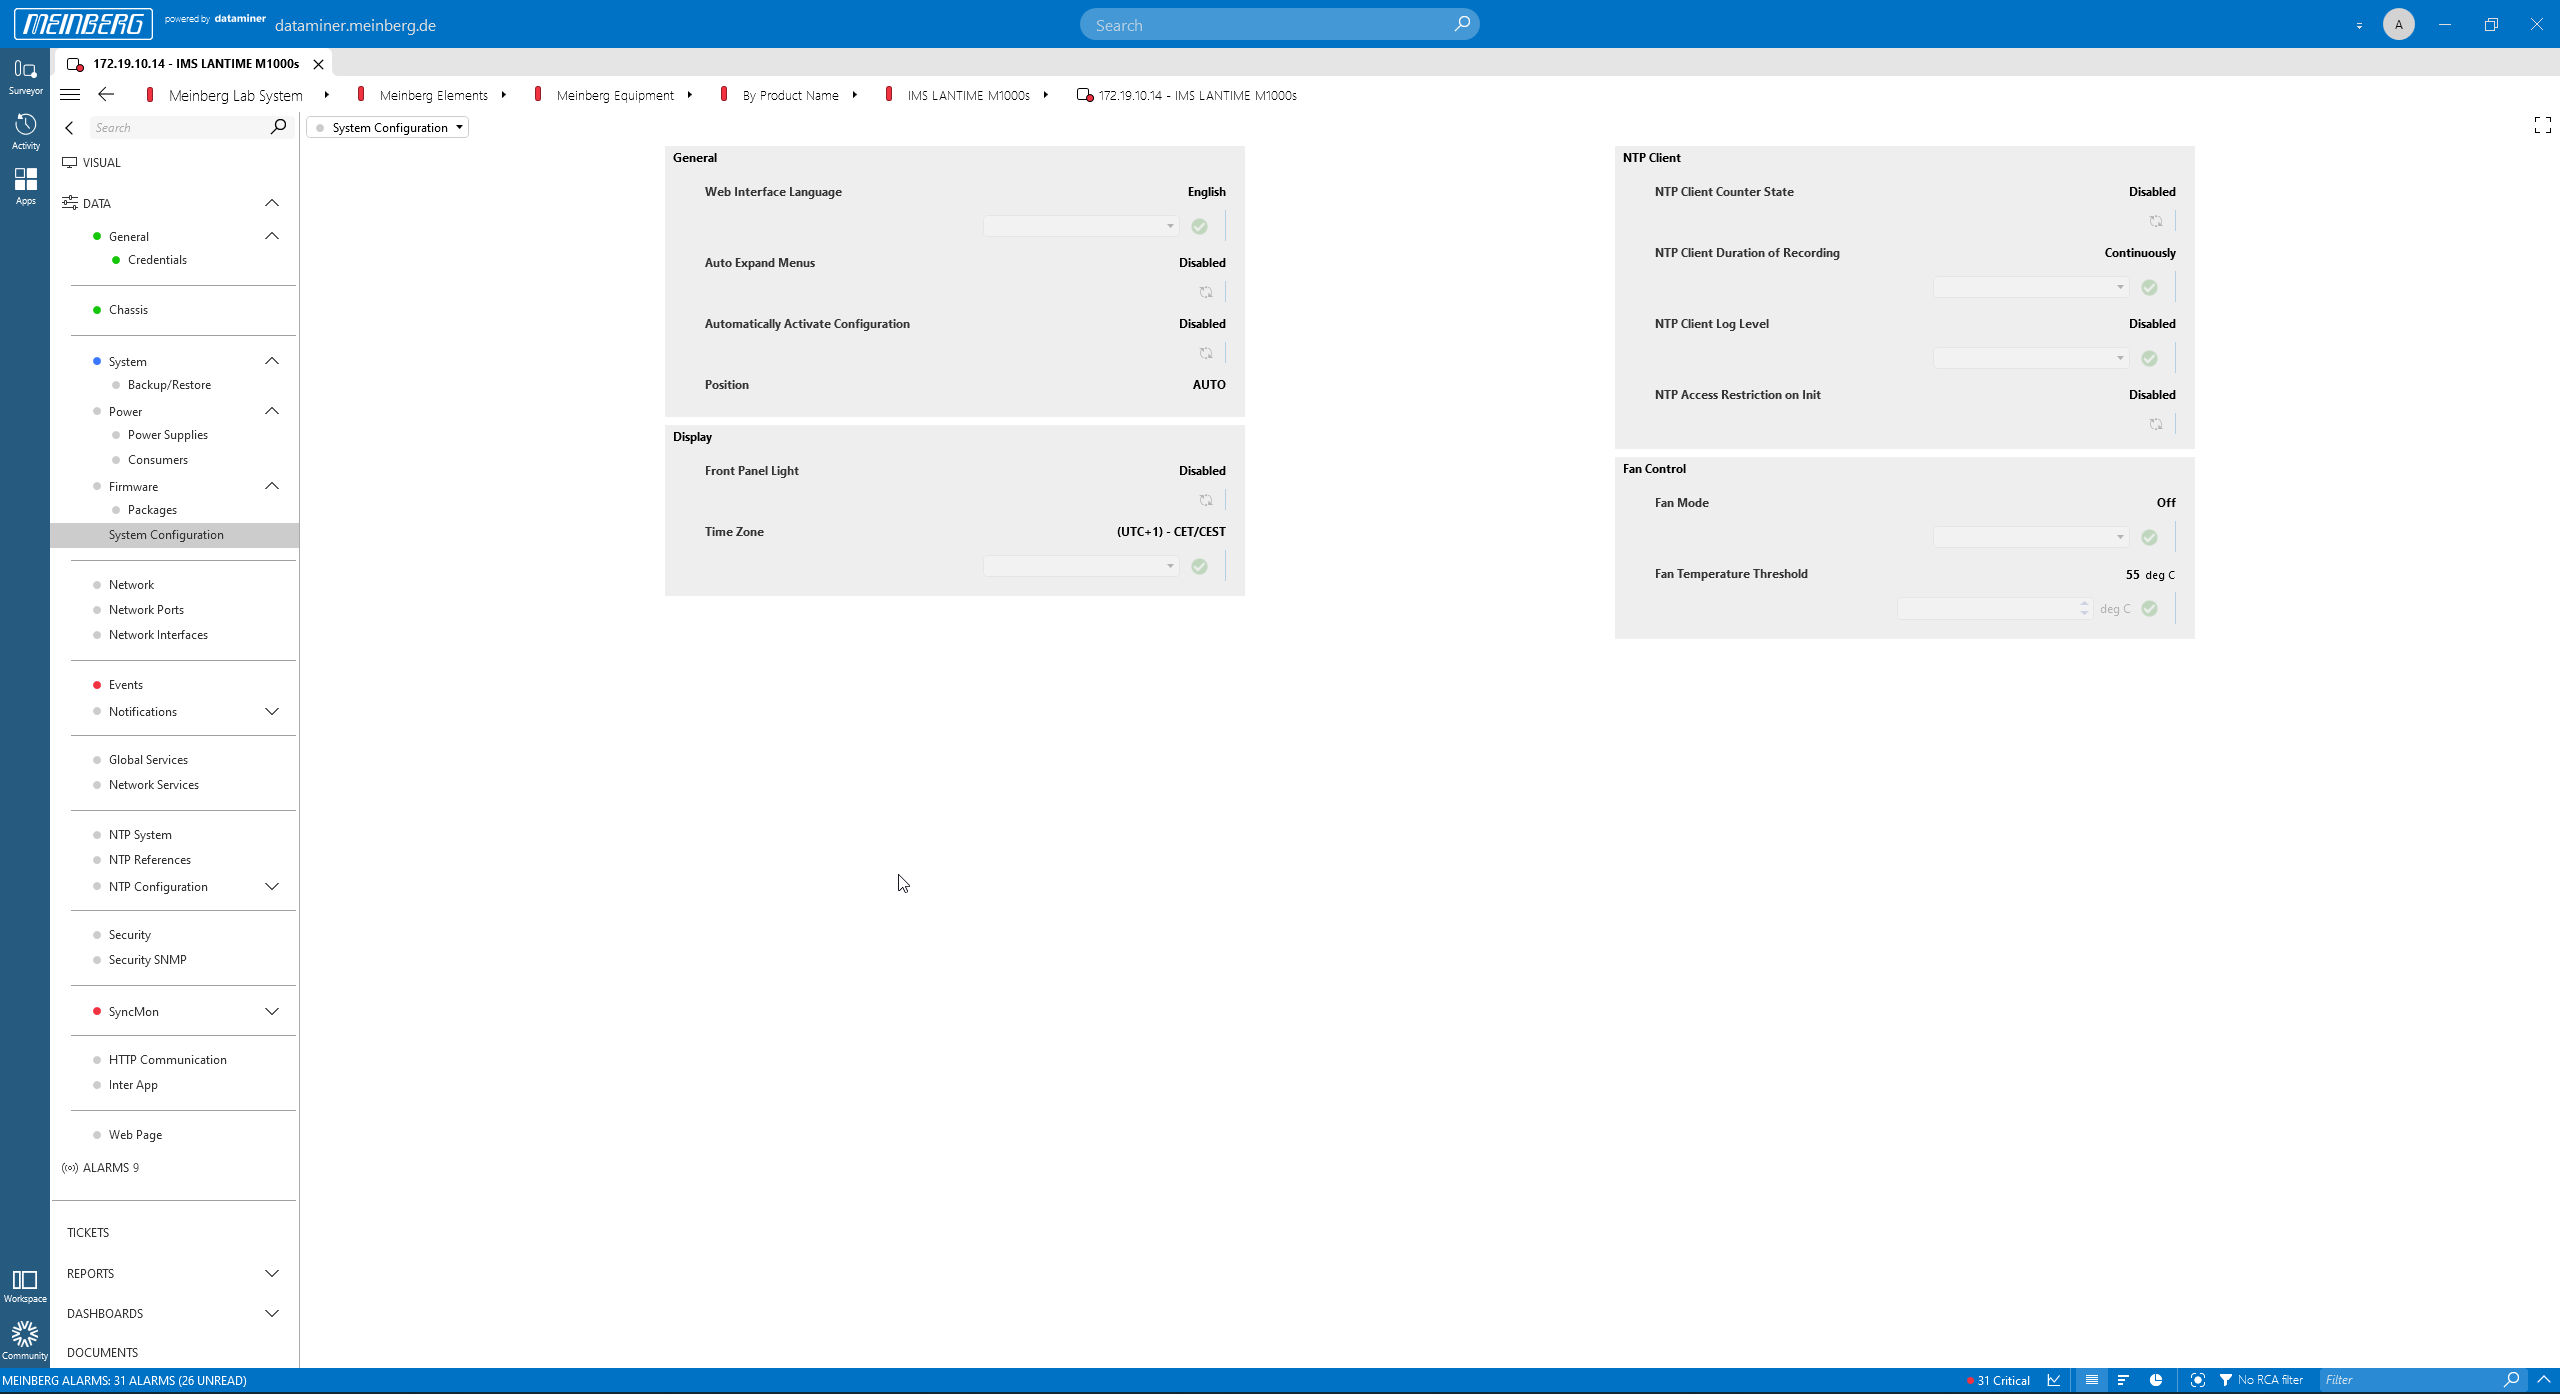 The "System Configuration" page.
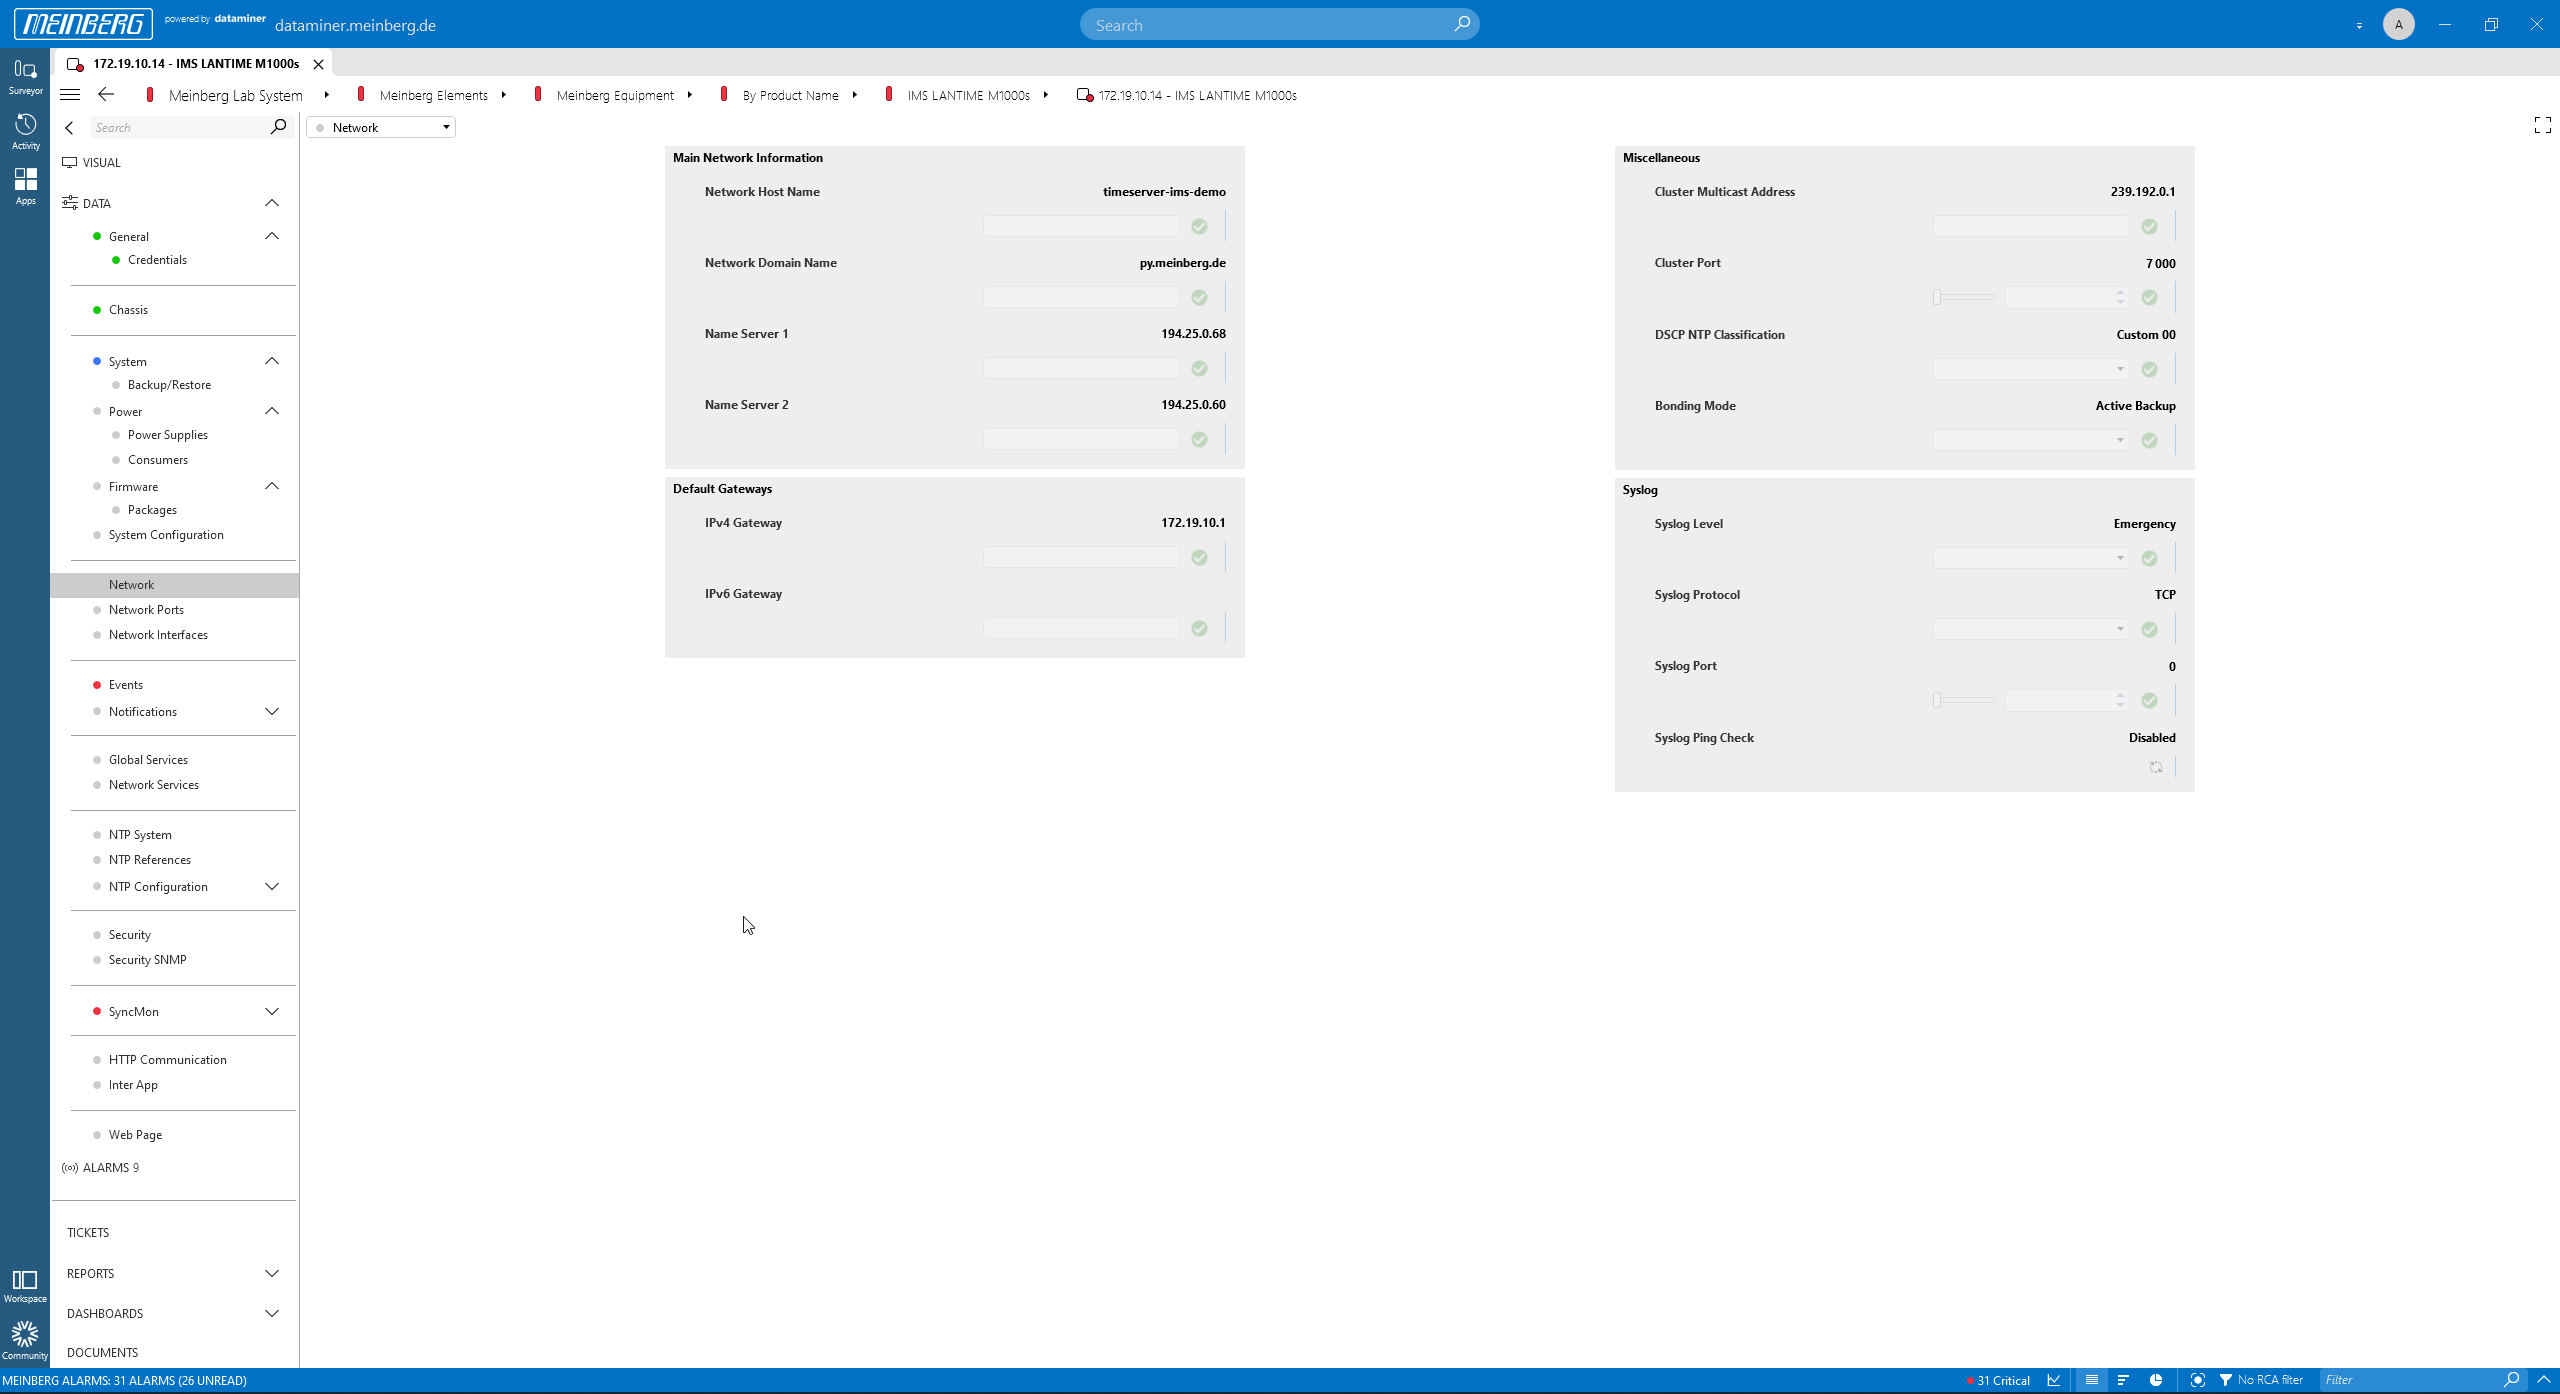 The "Network" page.
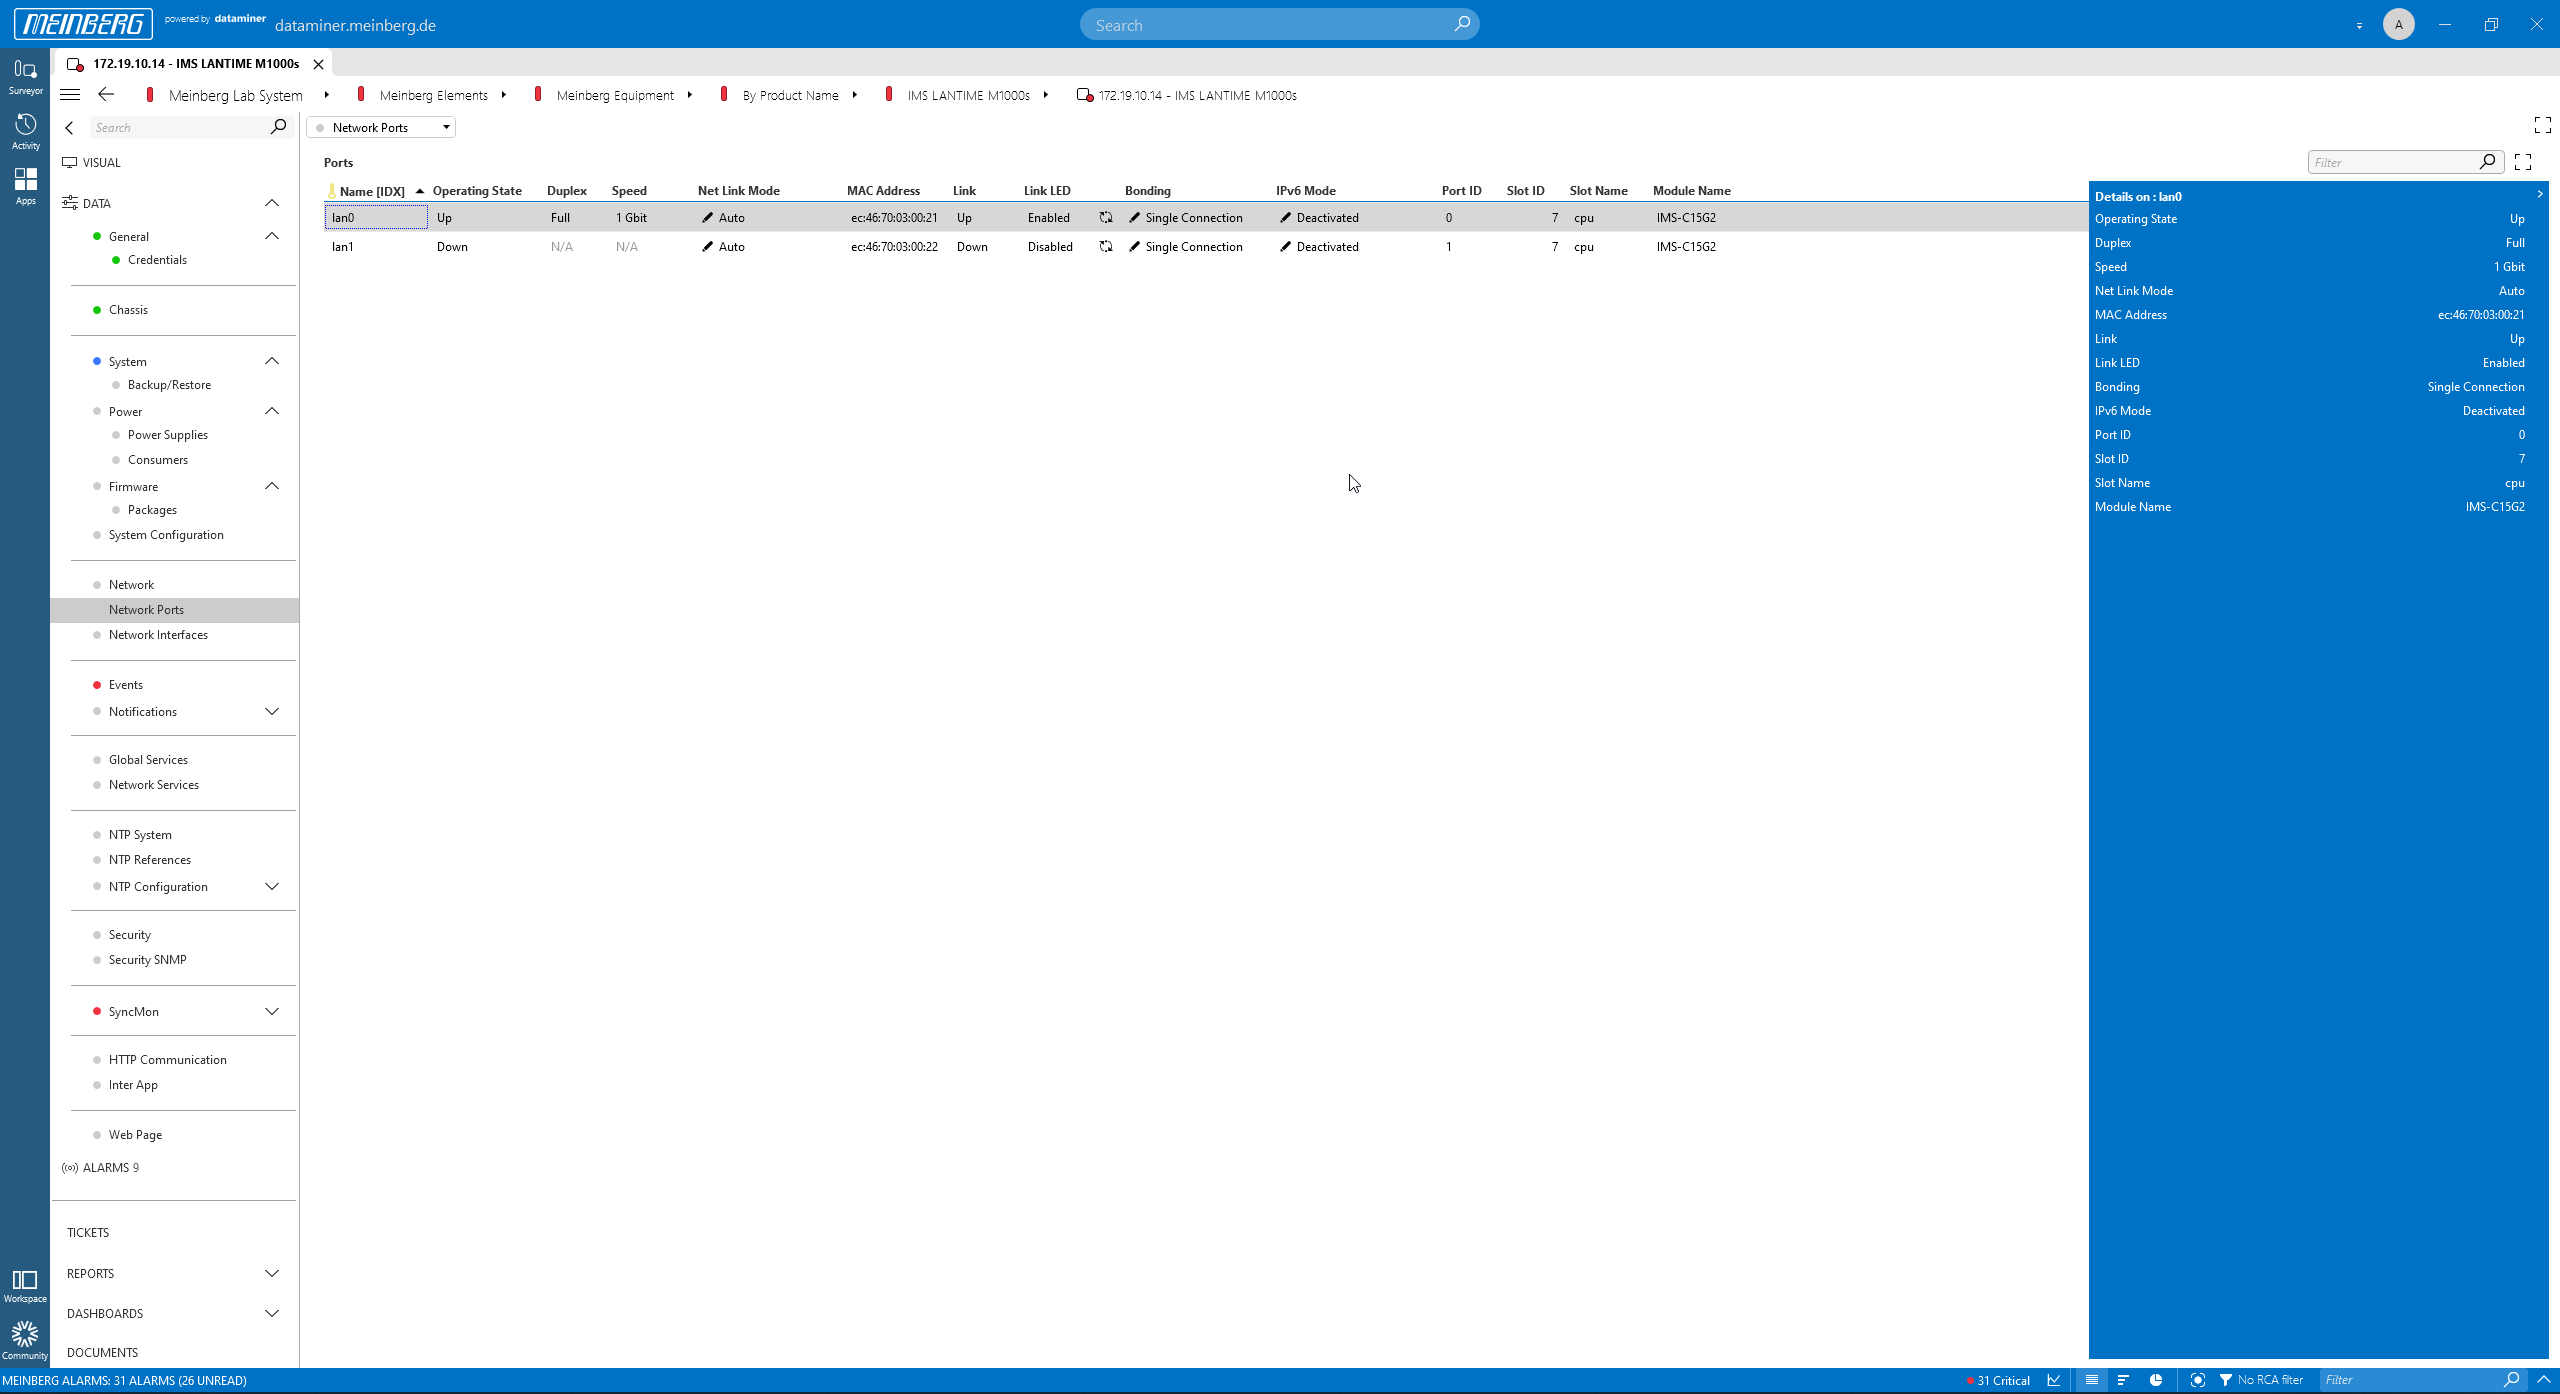 The "Network Ports" page.
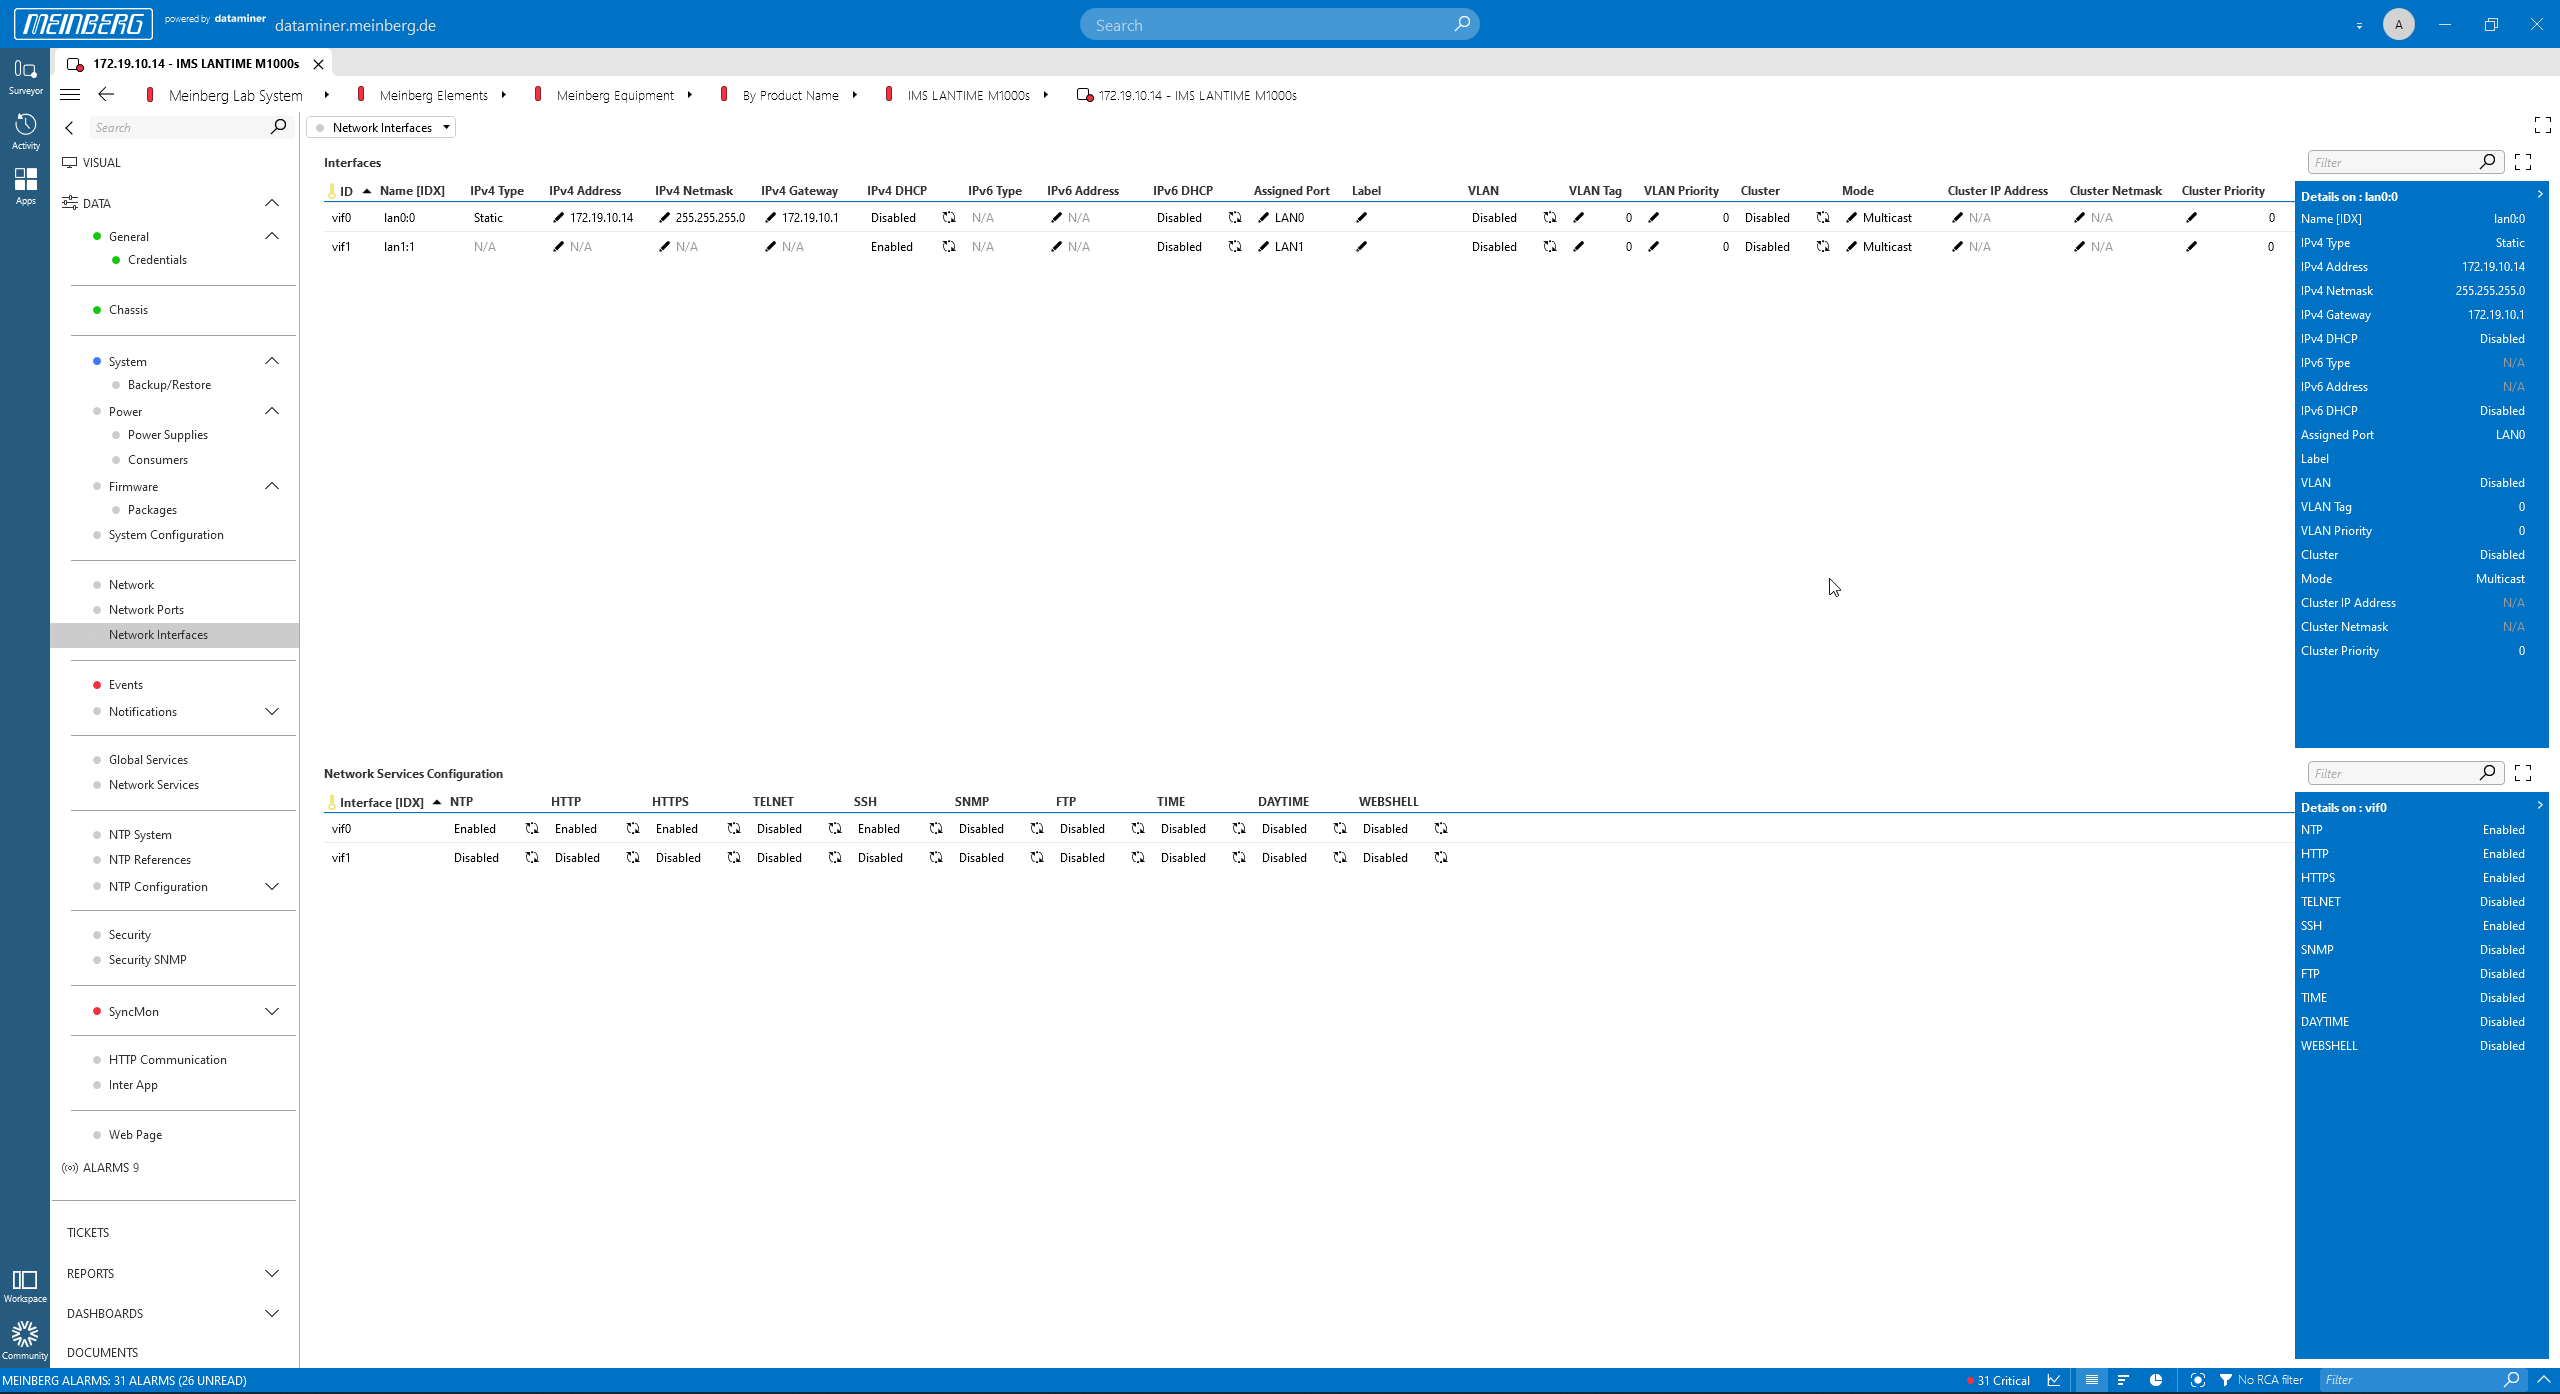 The "Network Interfaces" page.
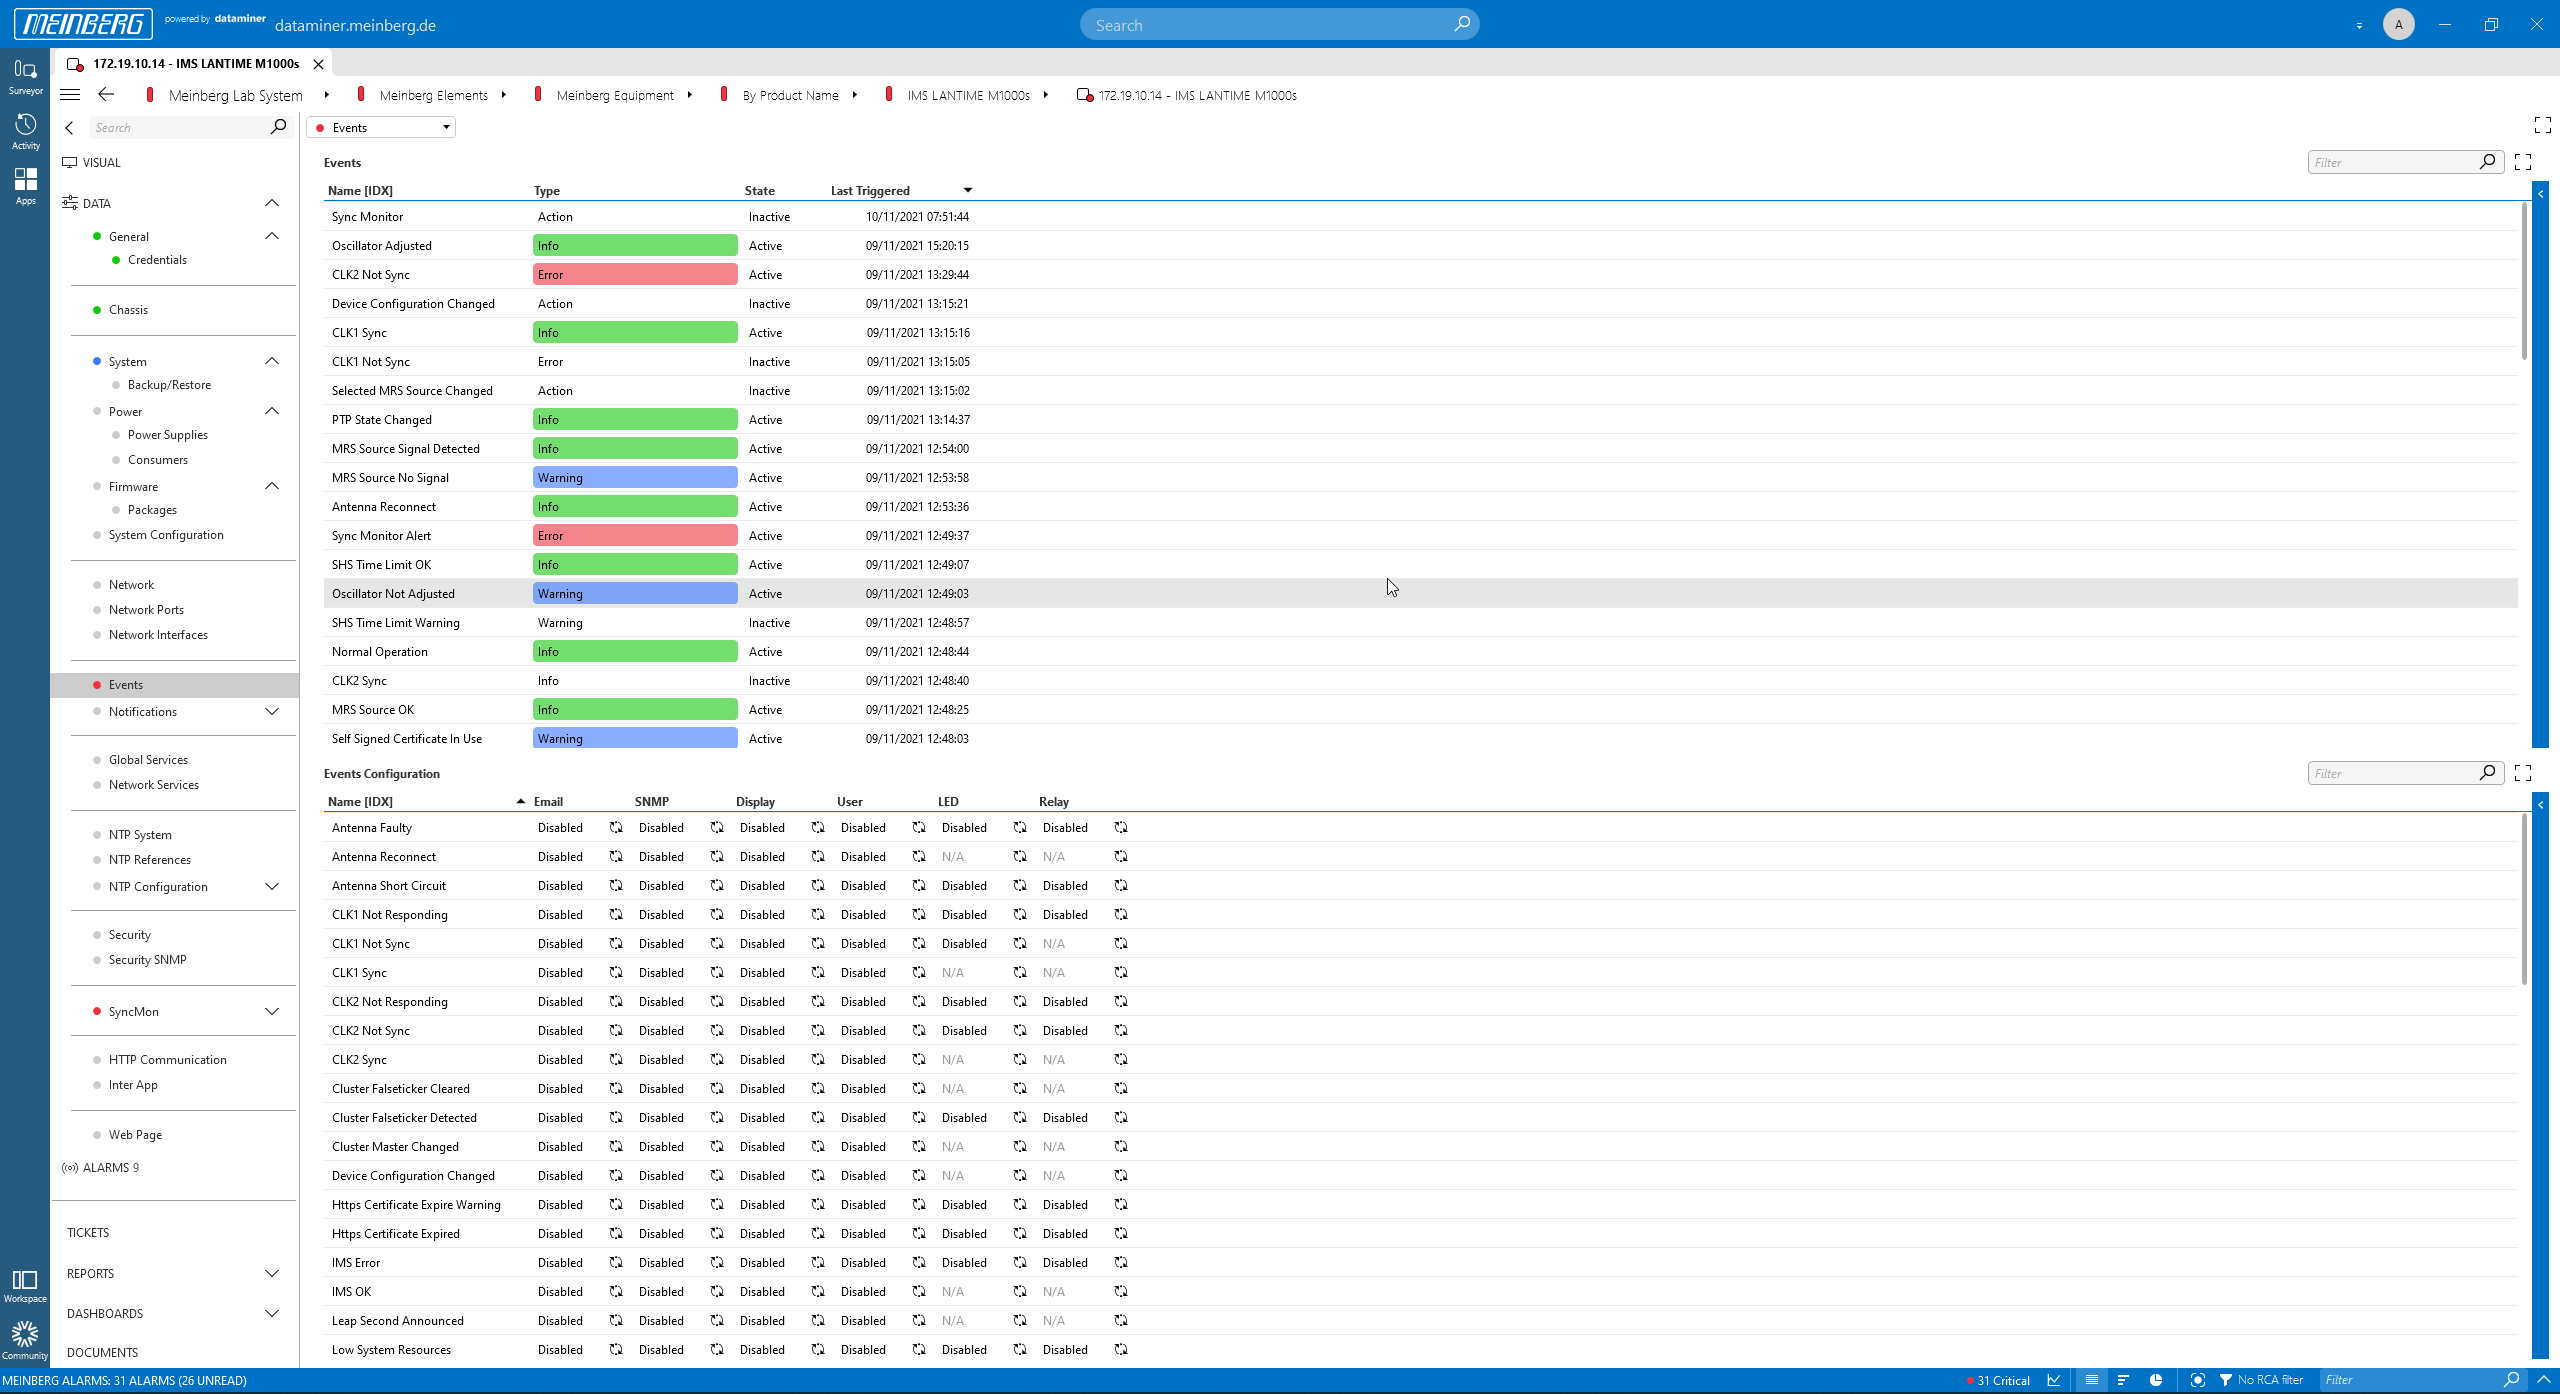 The "Events" page shows alarms generated by Meinberg devices.
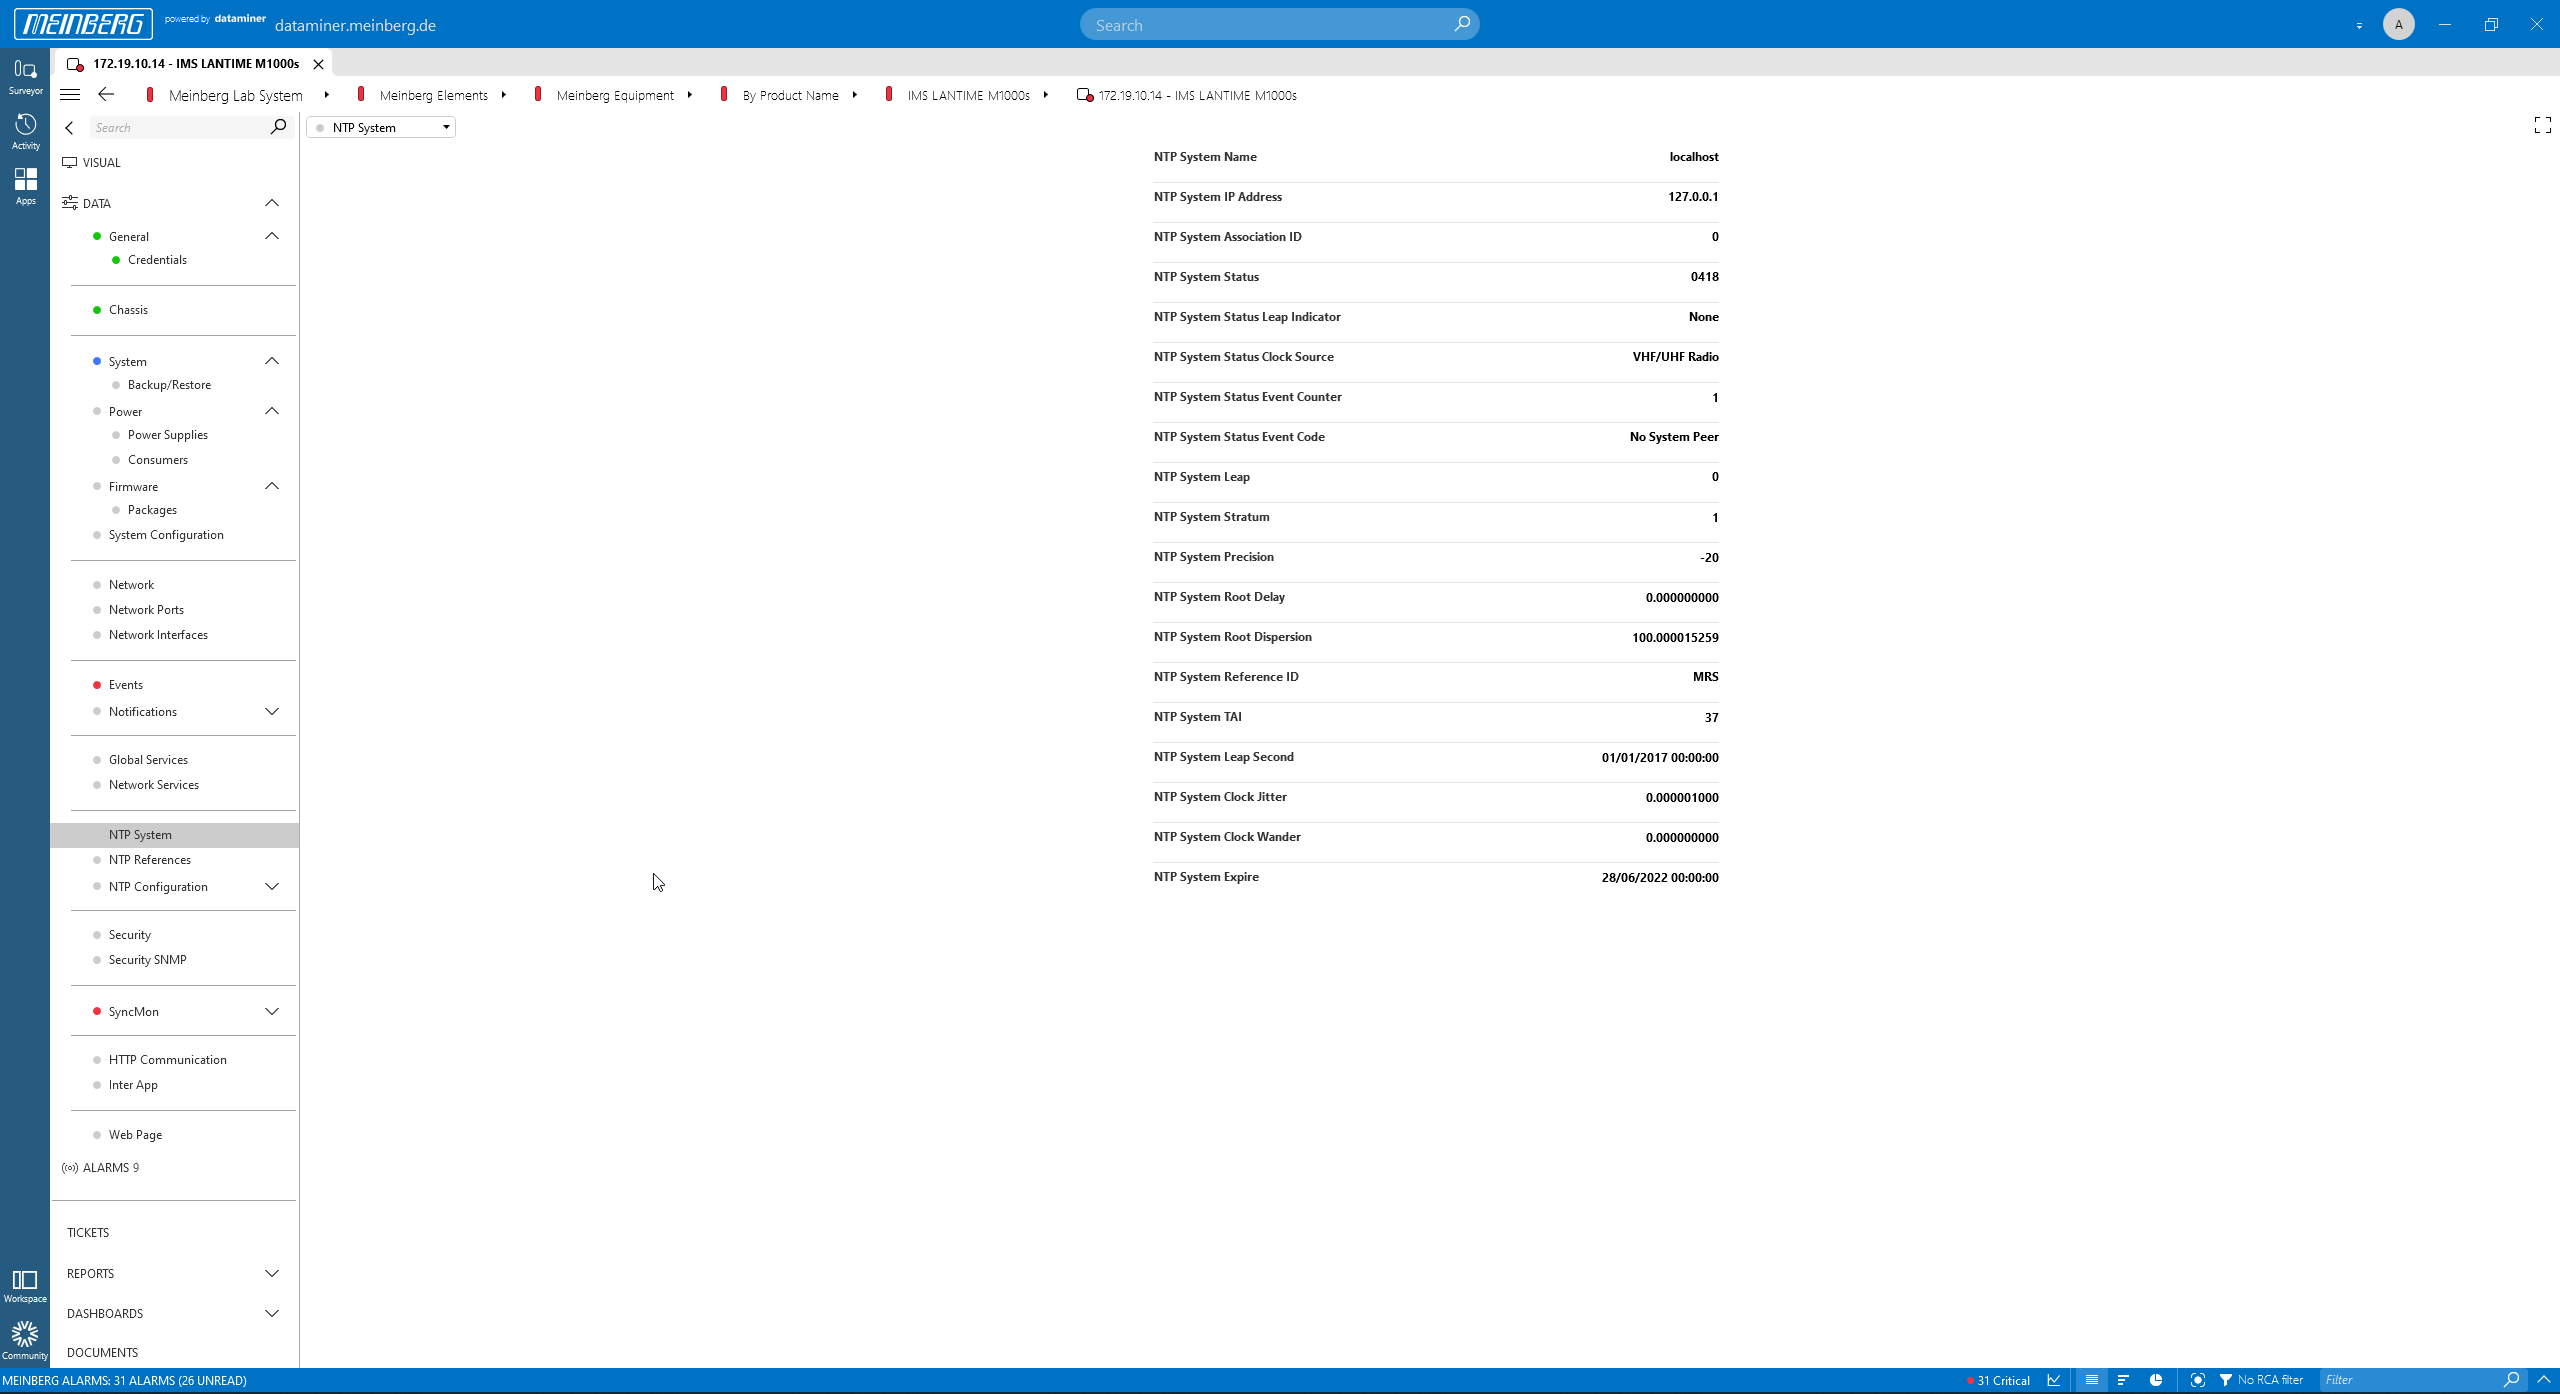 The "NTP System" page.
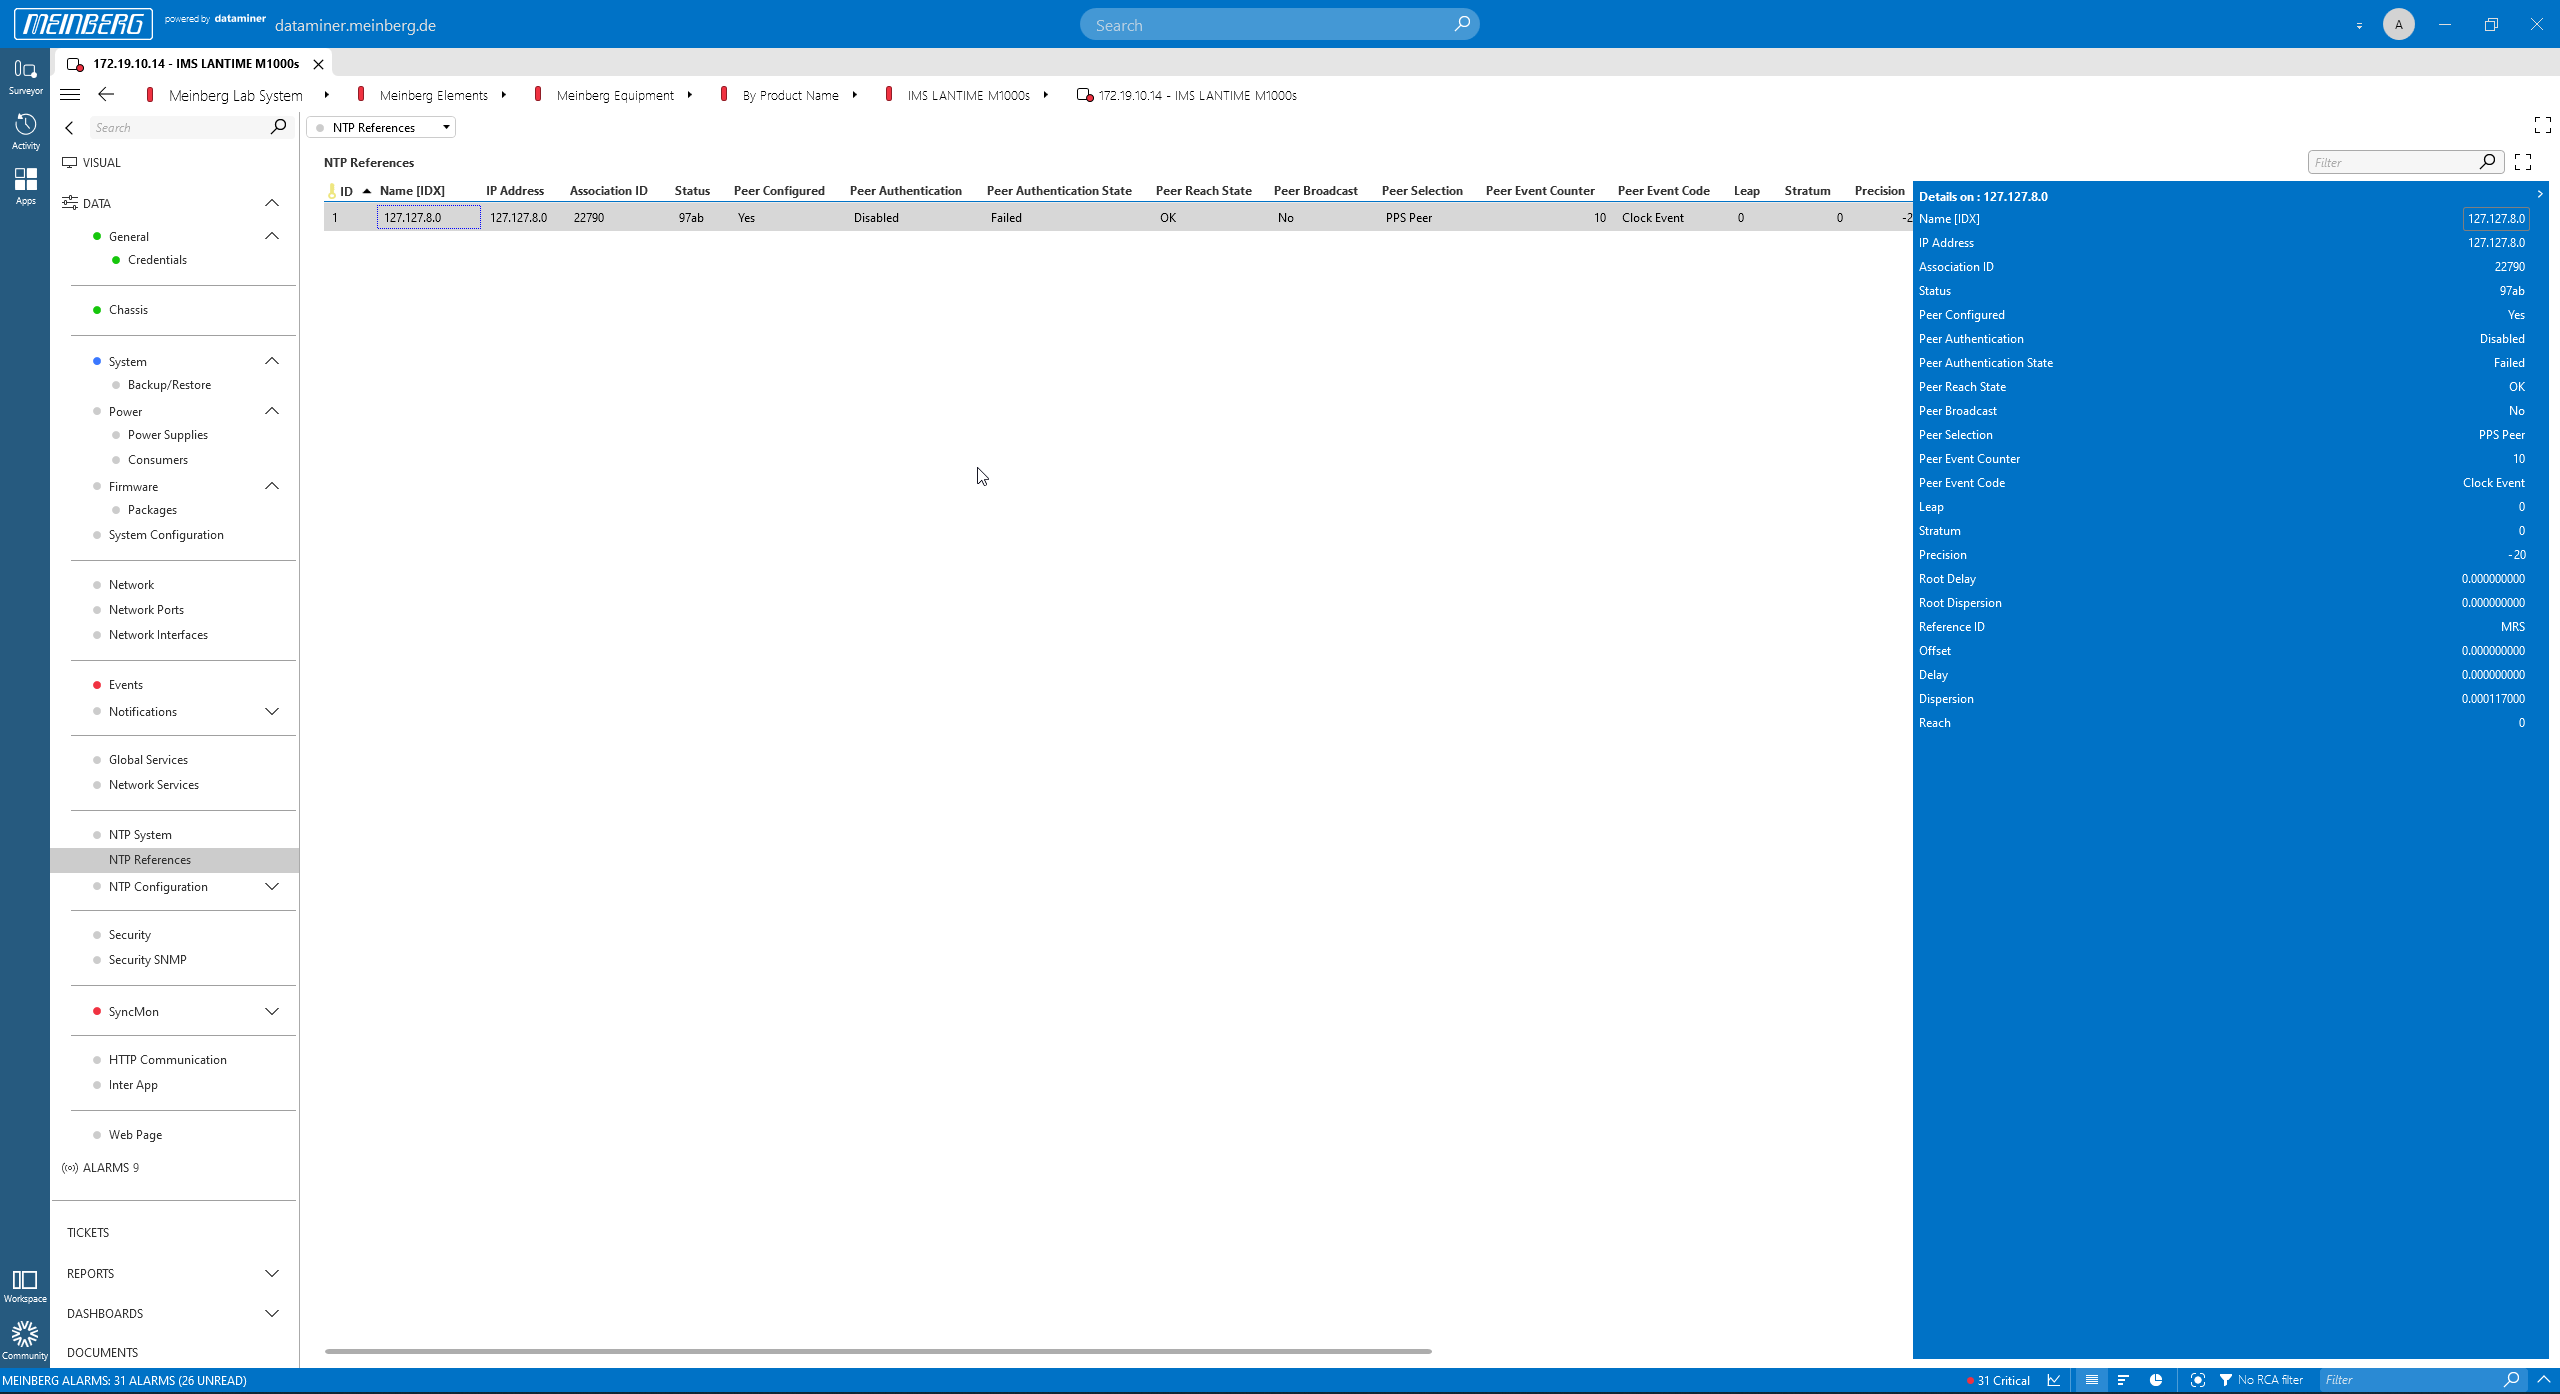 The "NTP References" page.
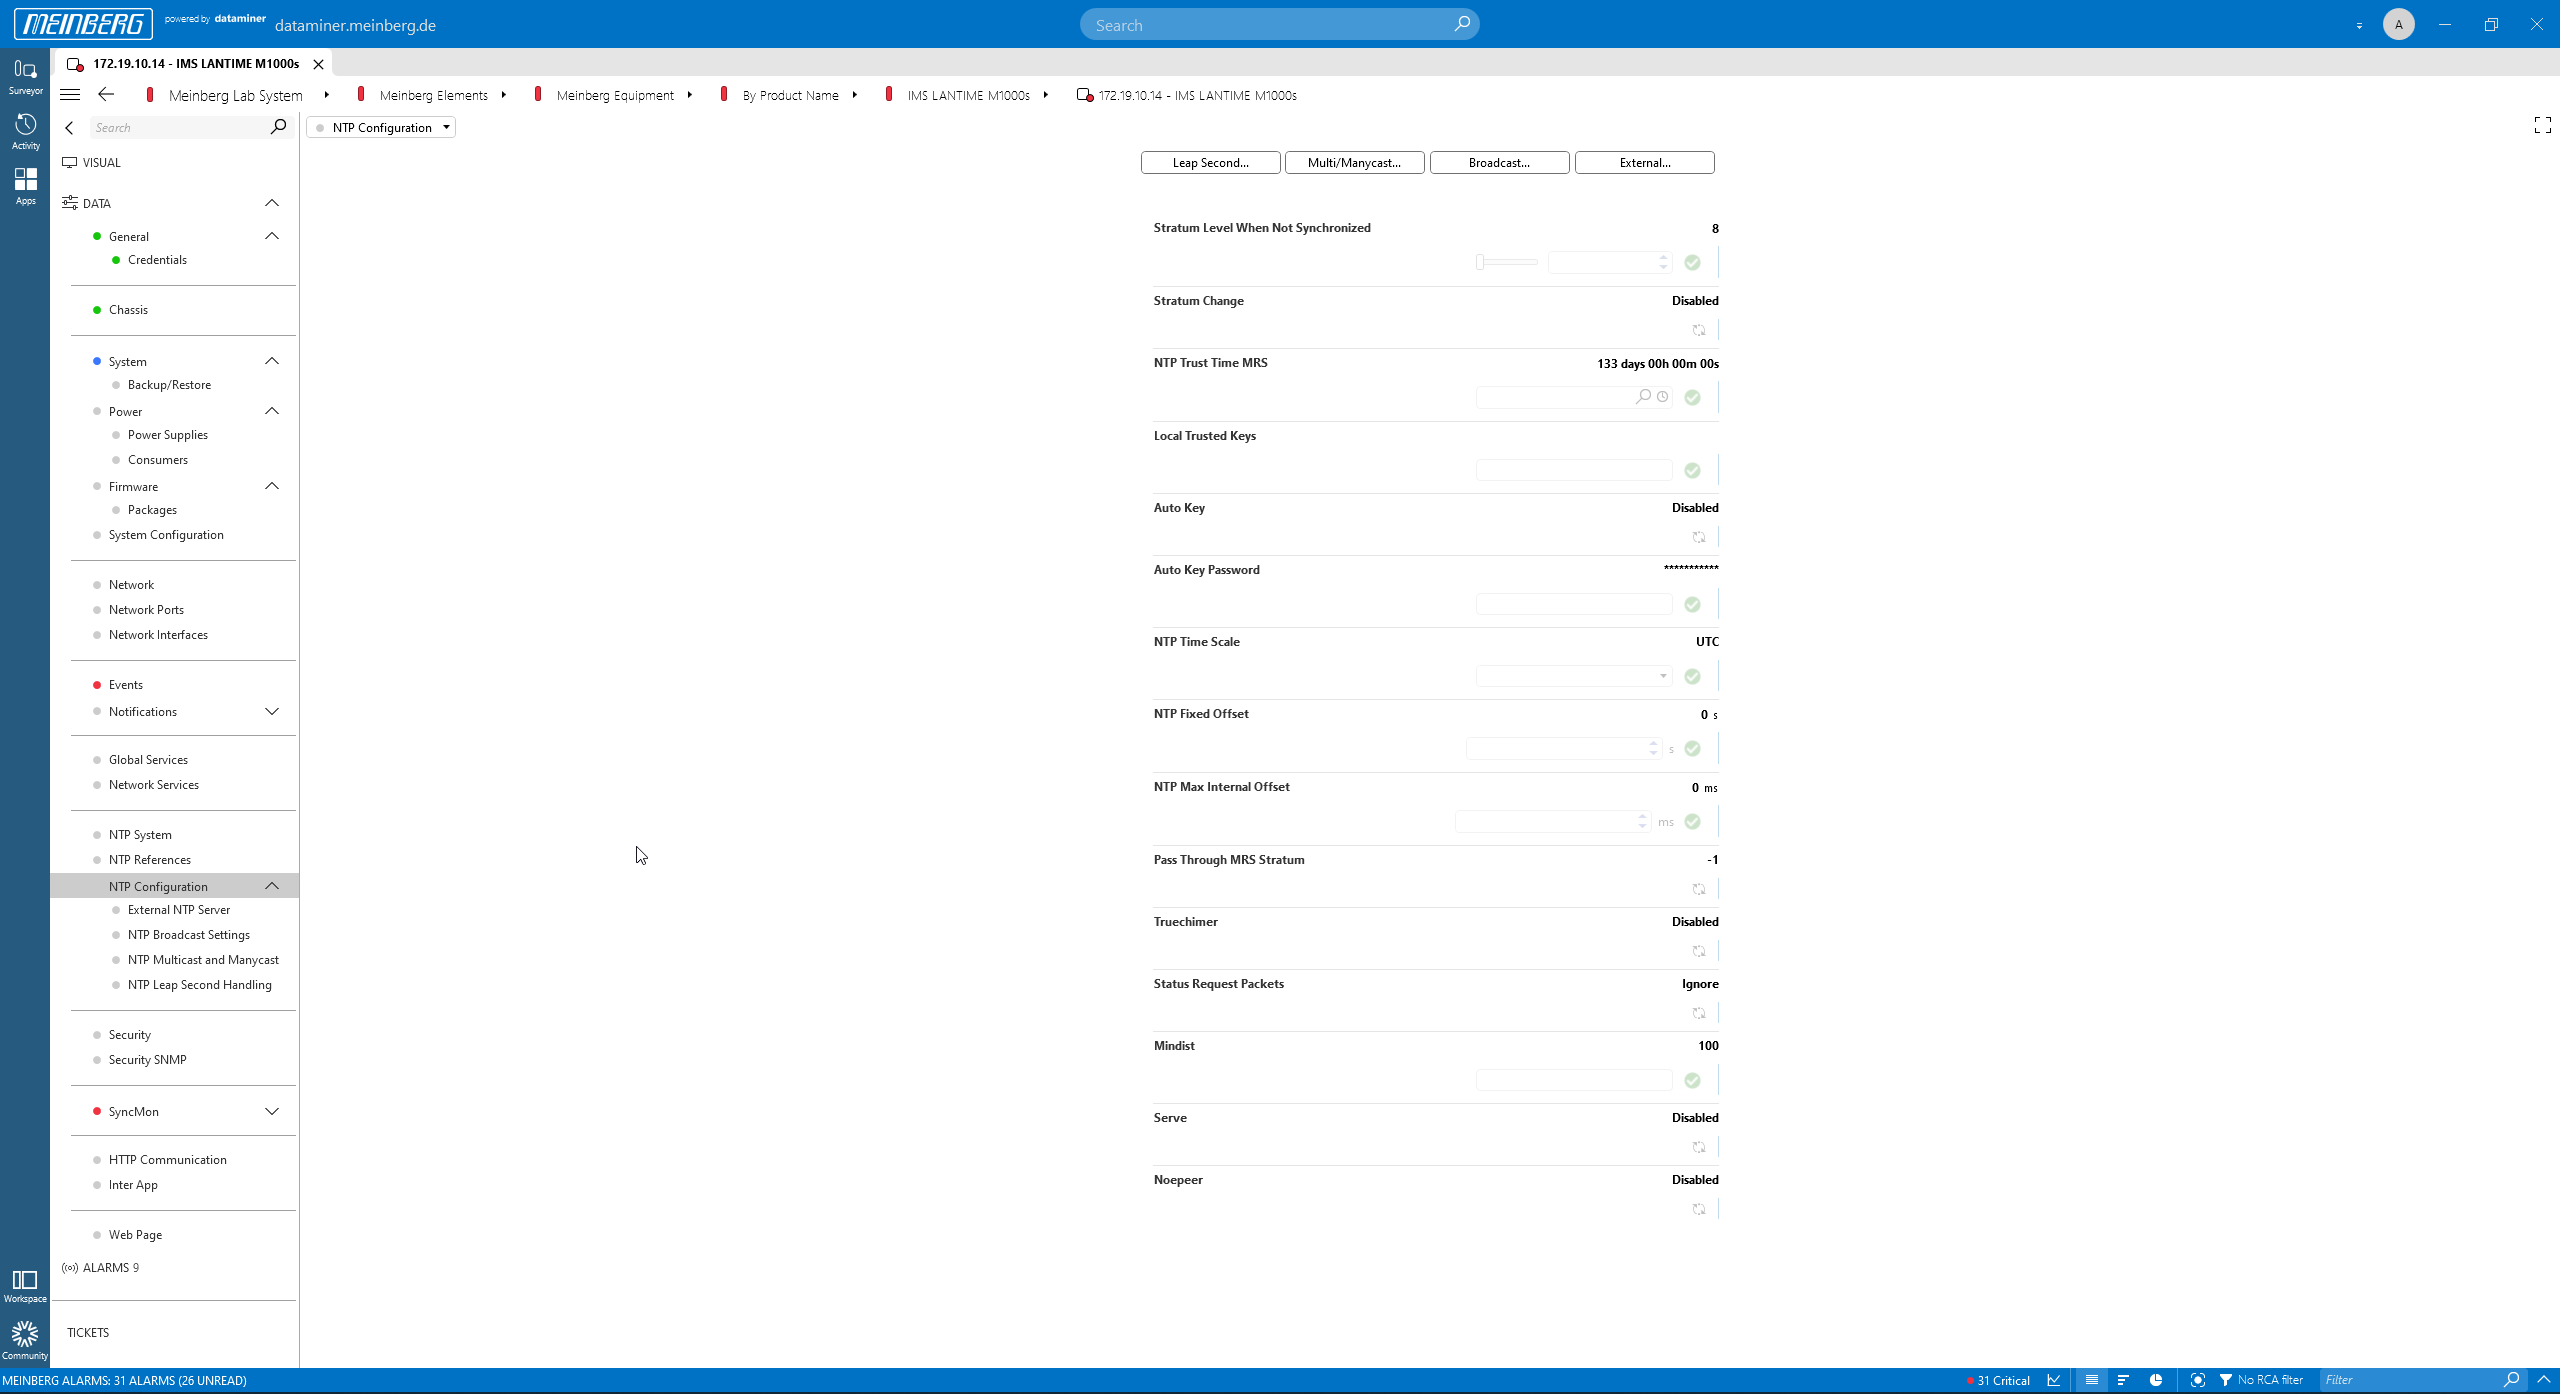 The "NTP Configuration" page.
 The "NTP Multicast" page.
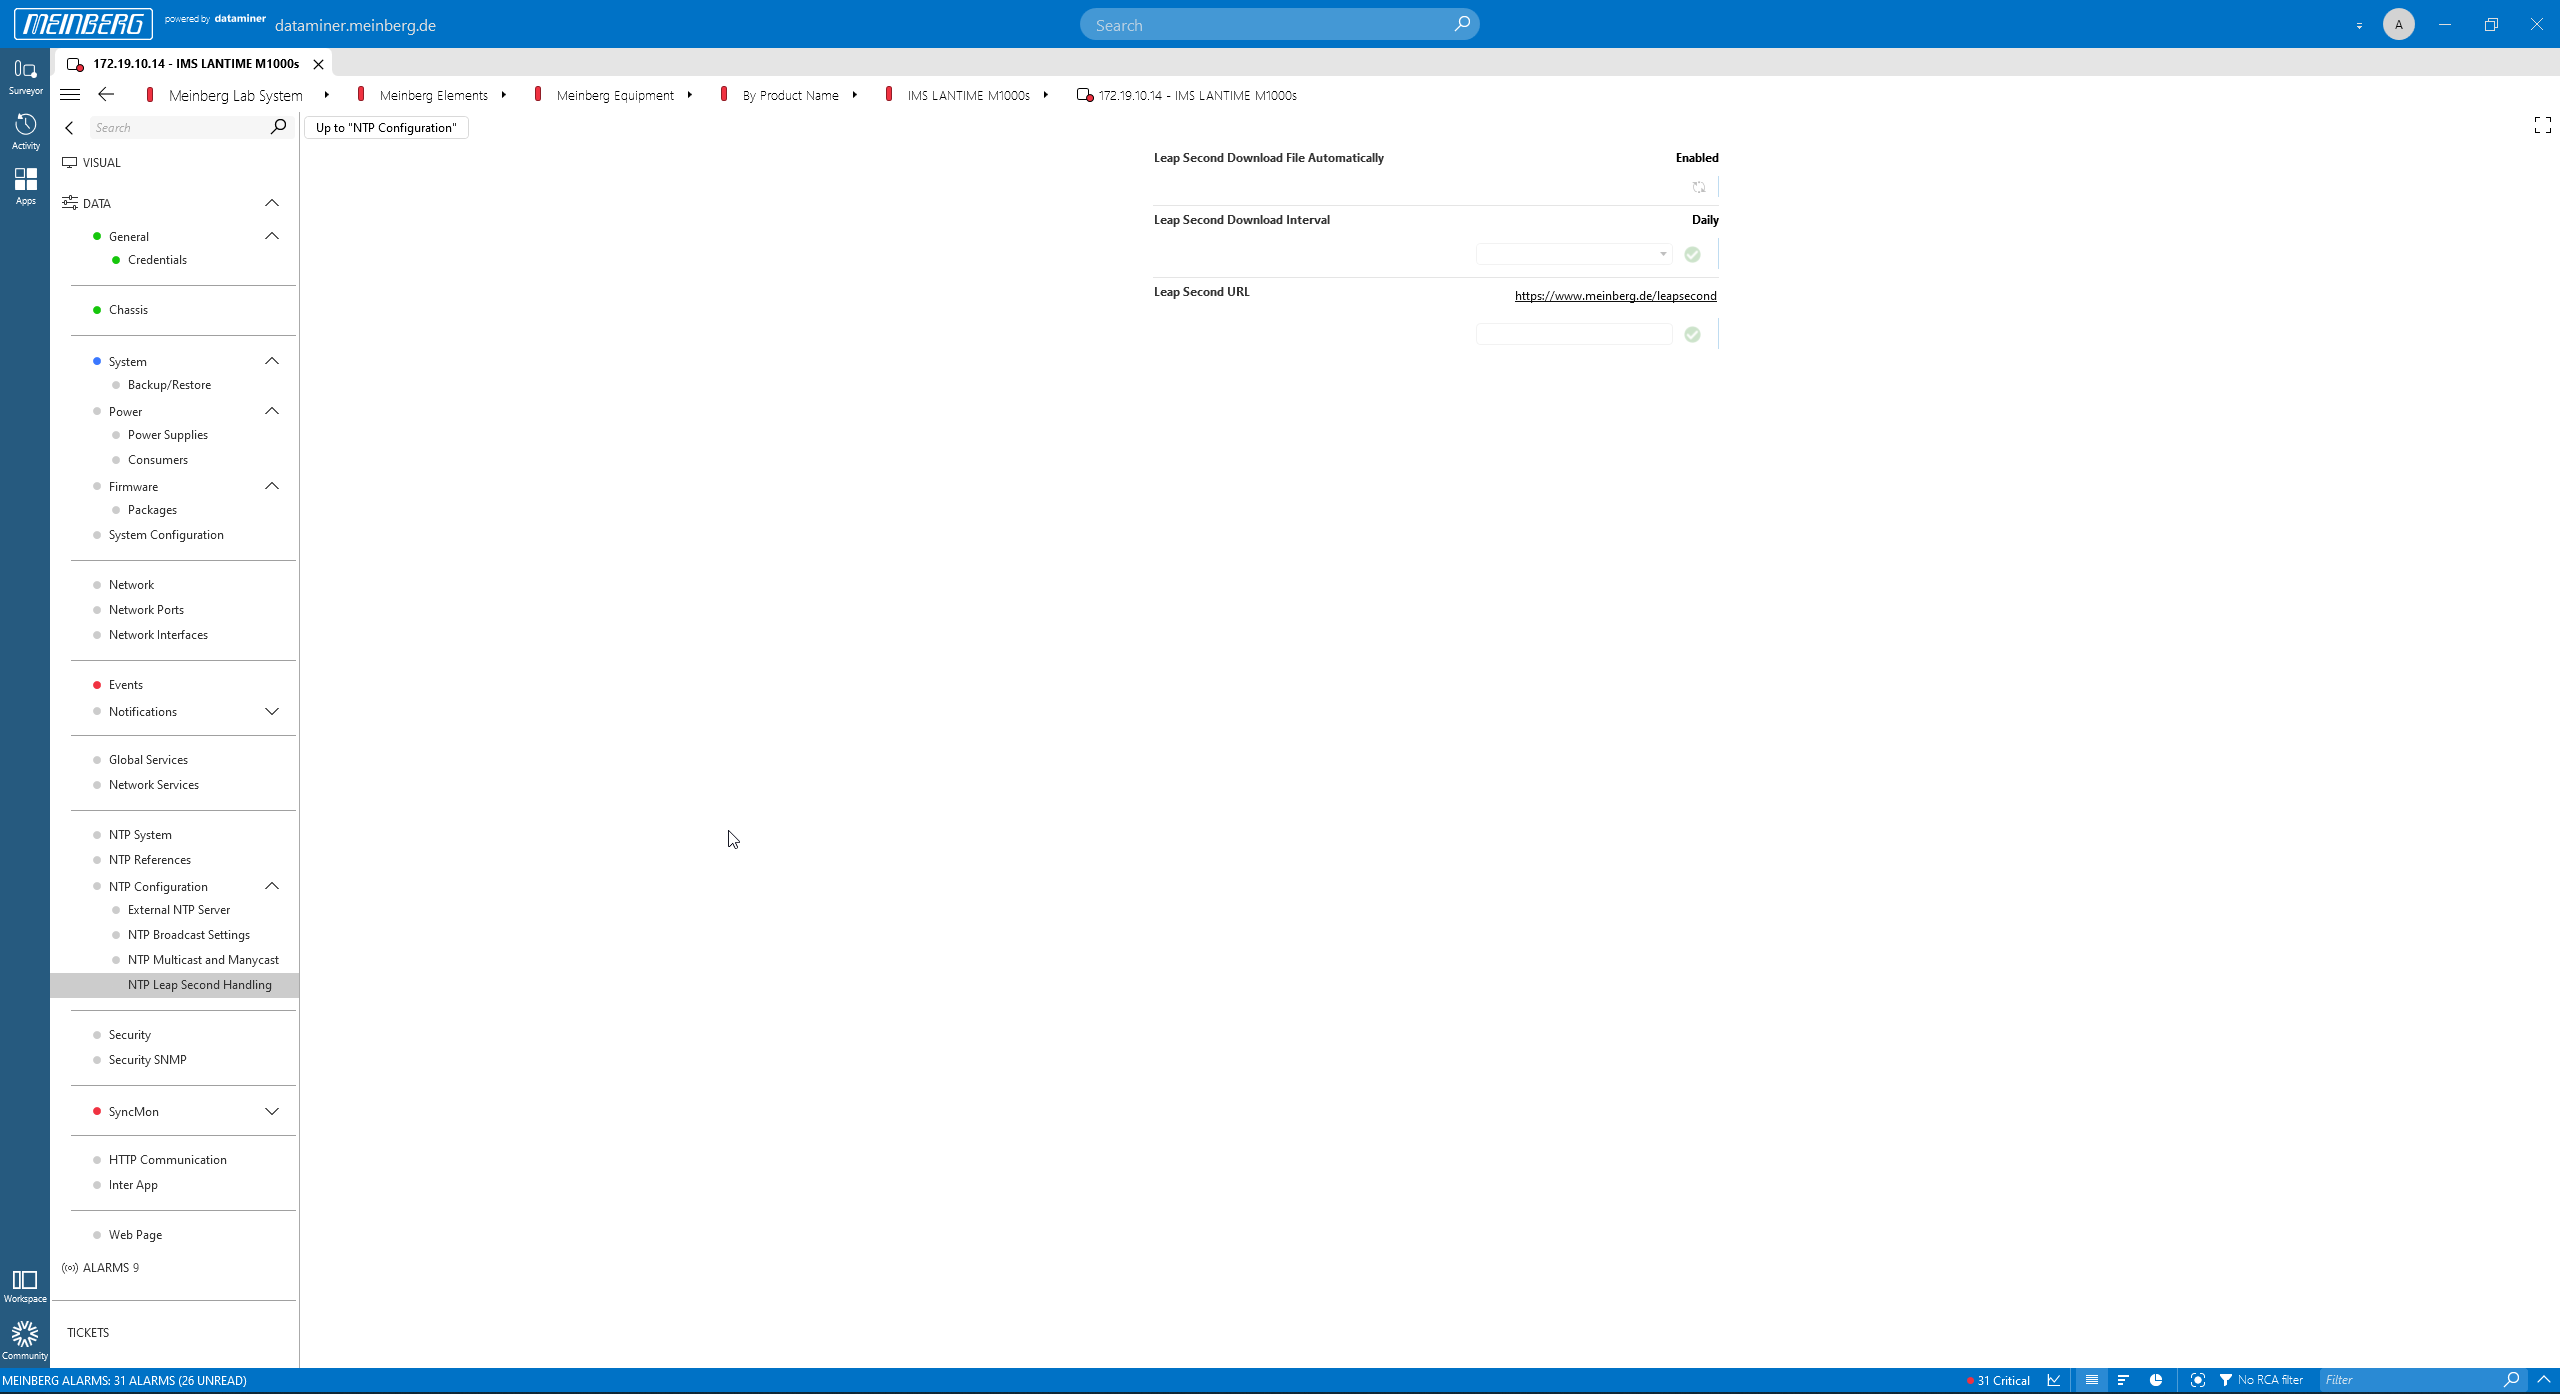 The "NTP Leap Second Handling" page.
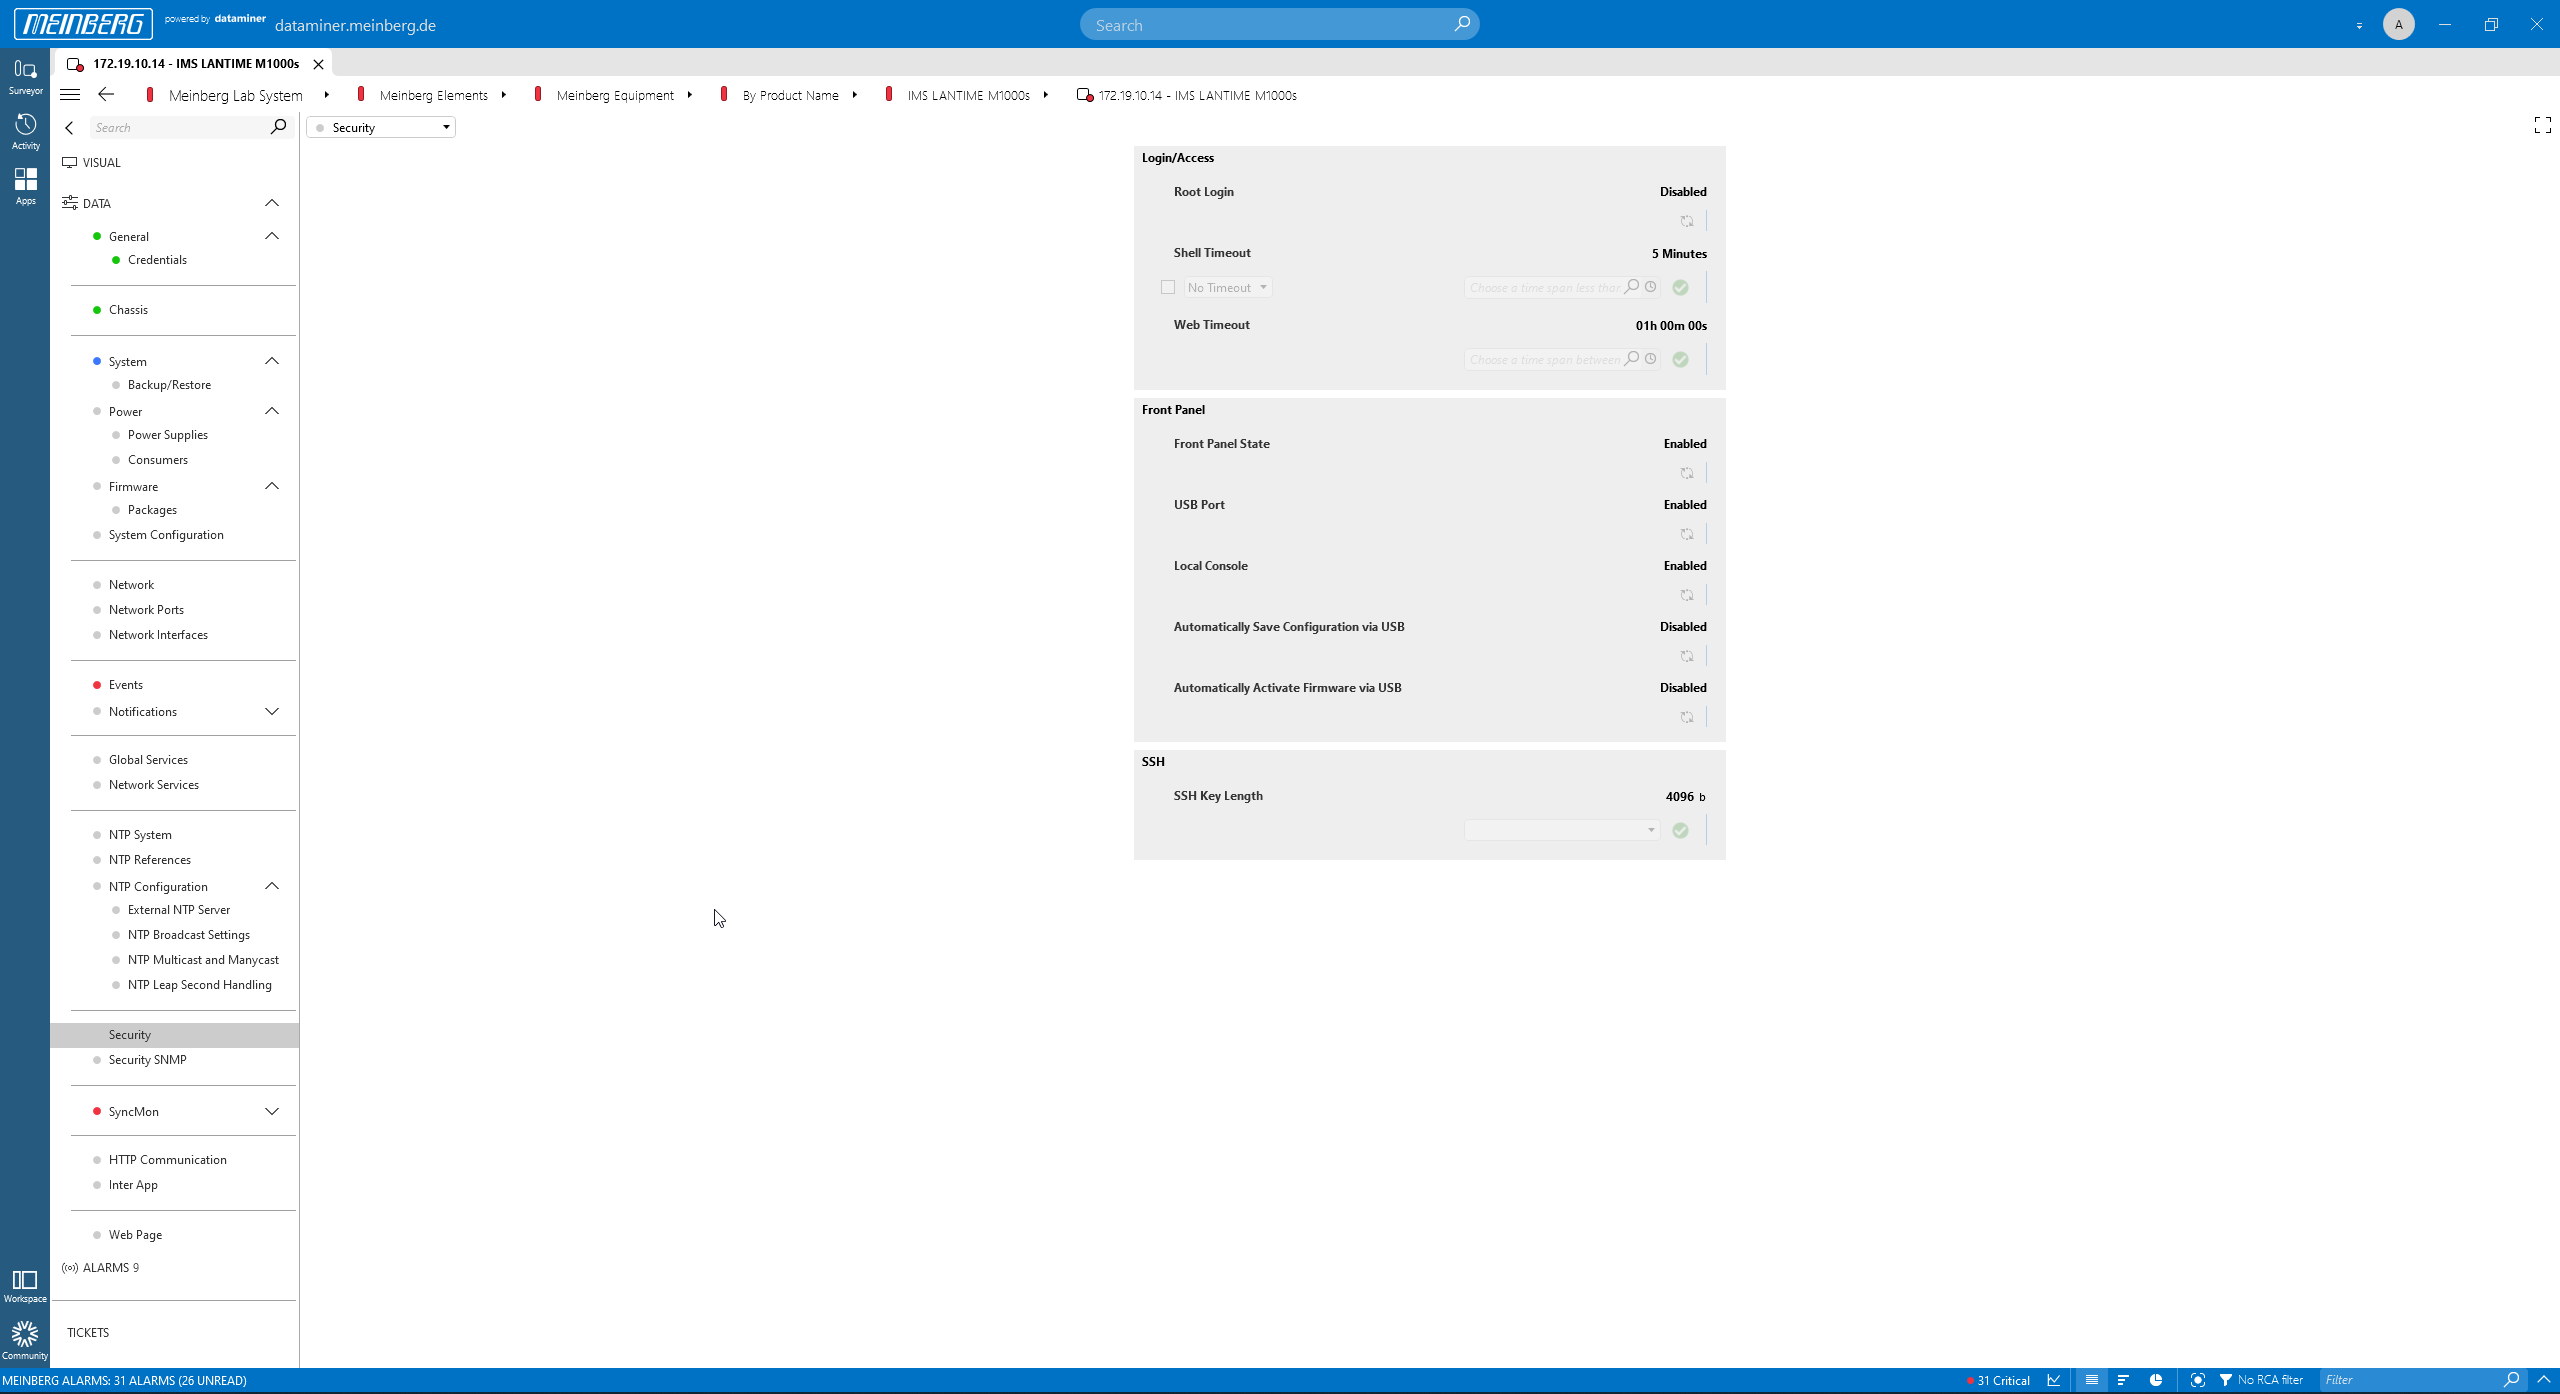 The "Security" page.
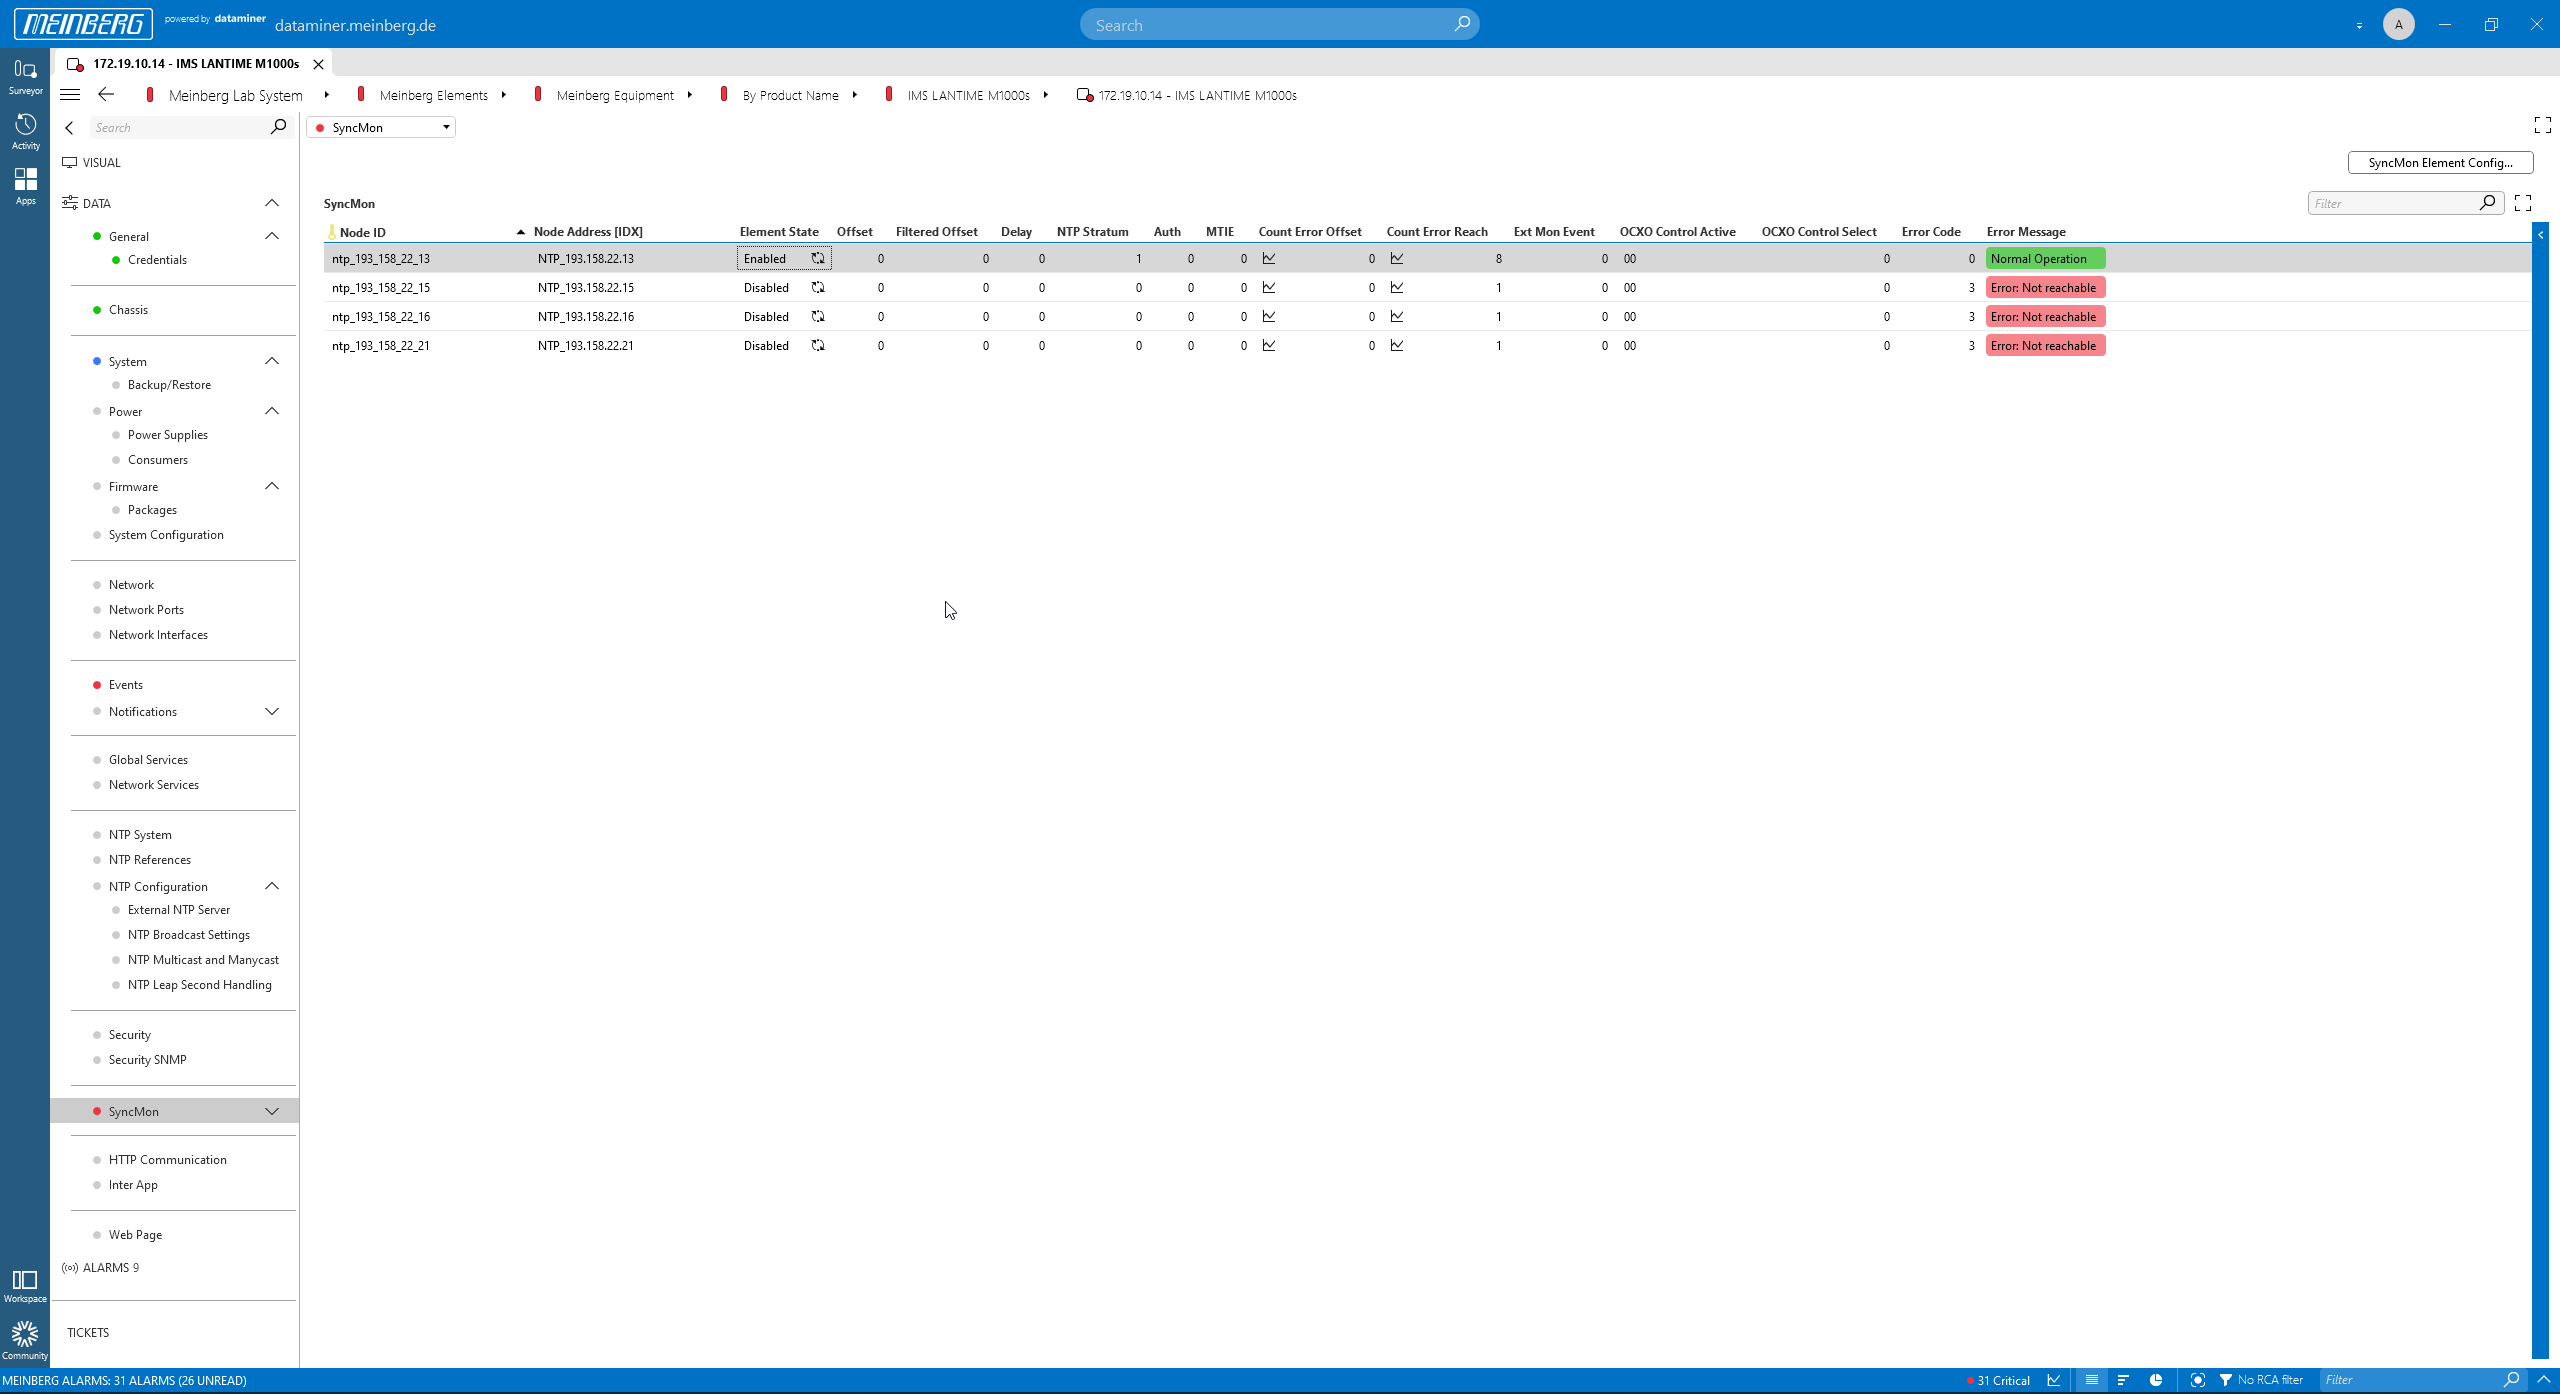 The "SyncMon" page shows parameters retrieved from the connected SyncMon probes.
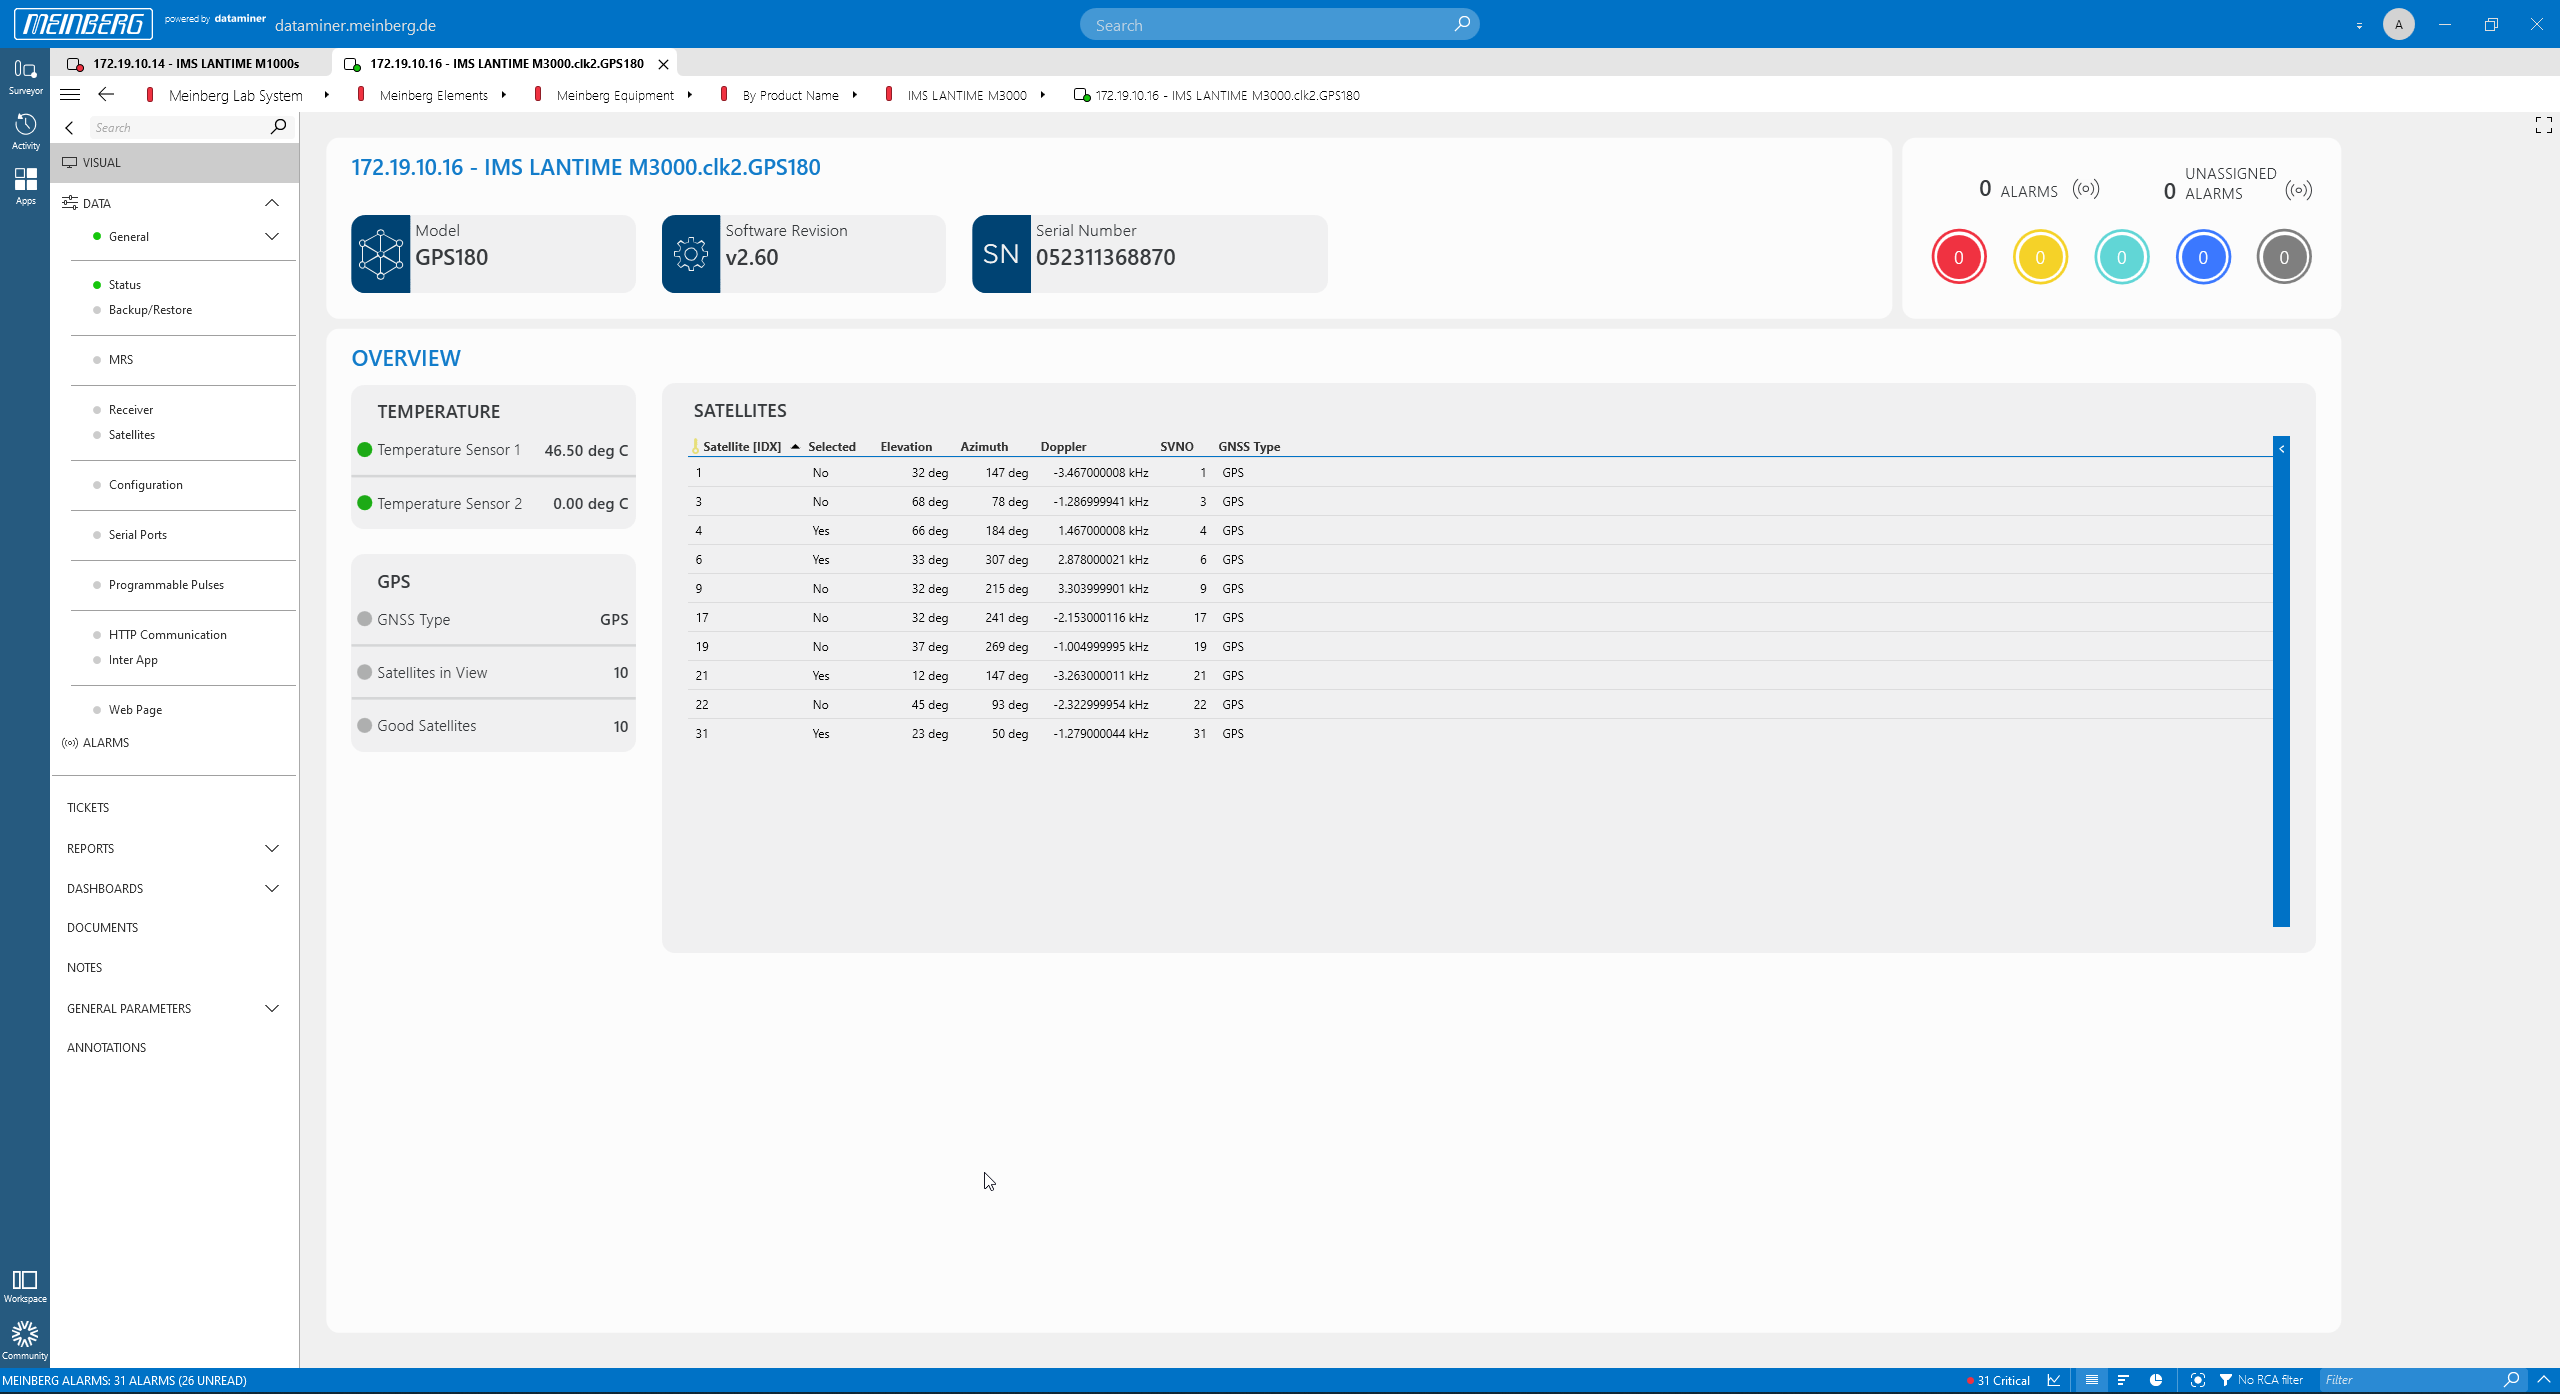 To see details of each card in a Meinberg modular chassis, just click the card. This example shows the overview page of a GPS180 card in an M3000 chassis.
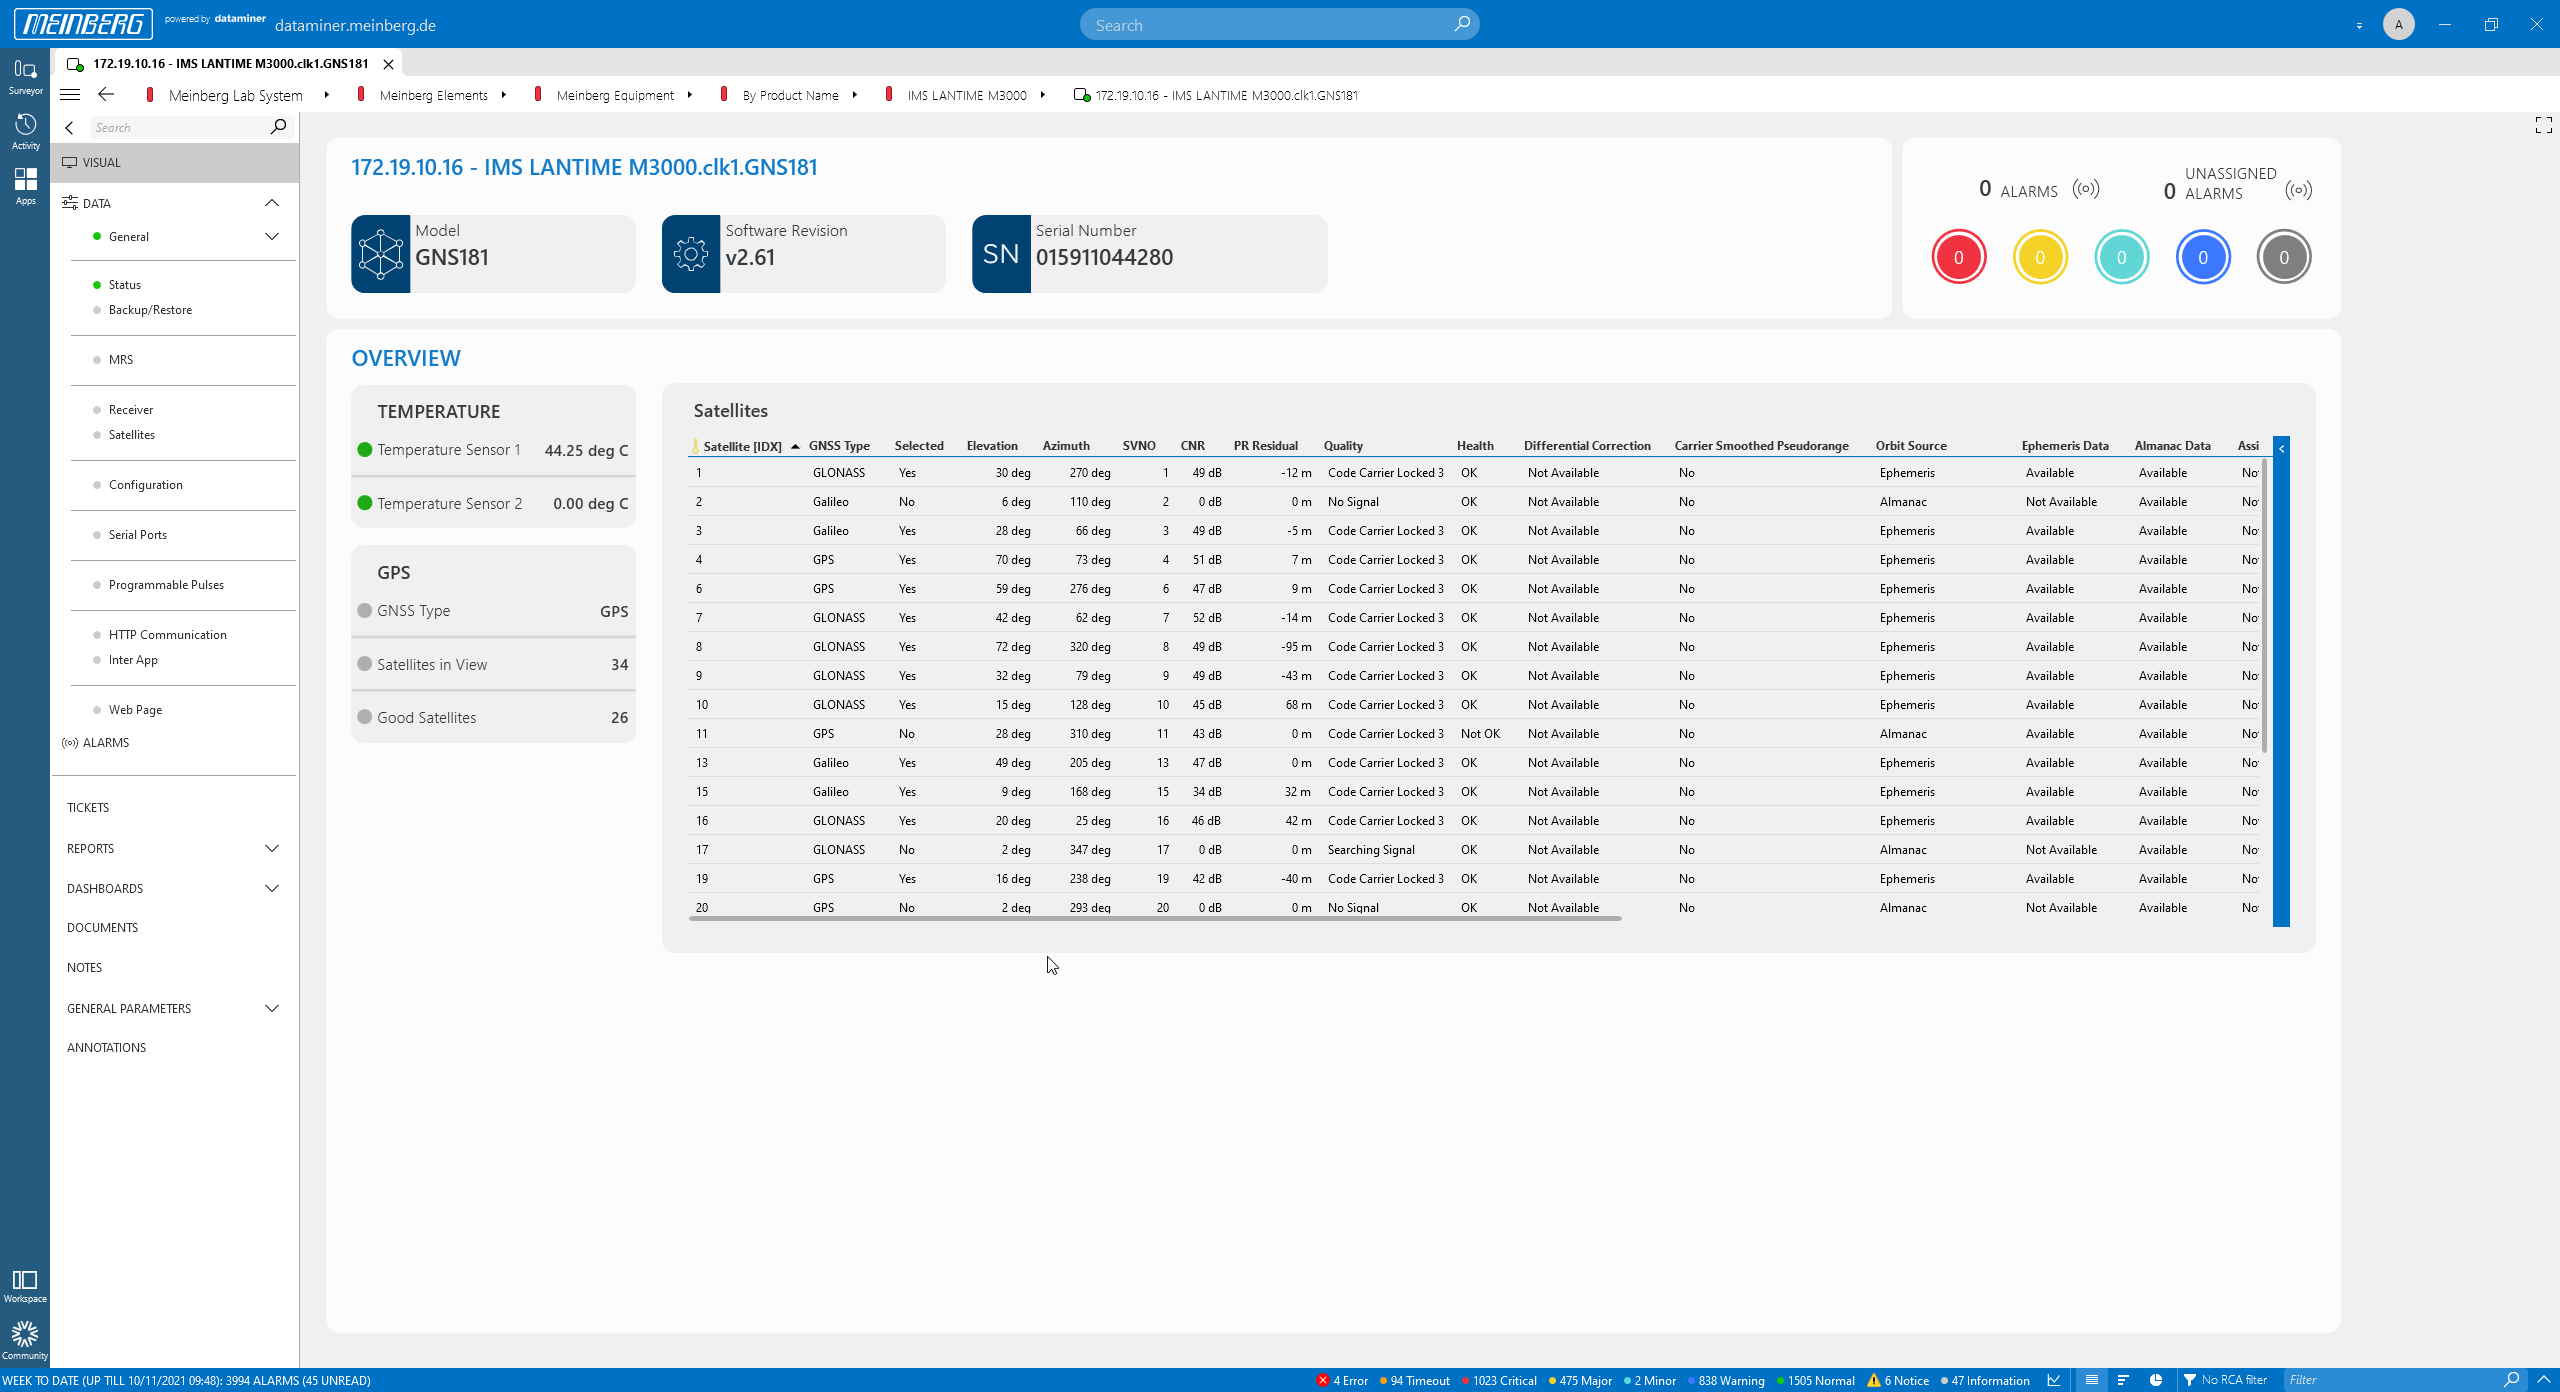 Visual overview of a GNS181 card.
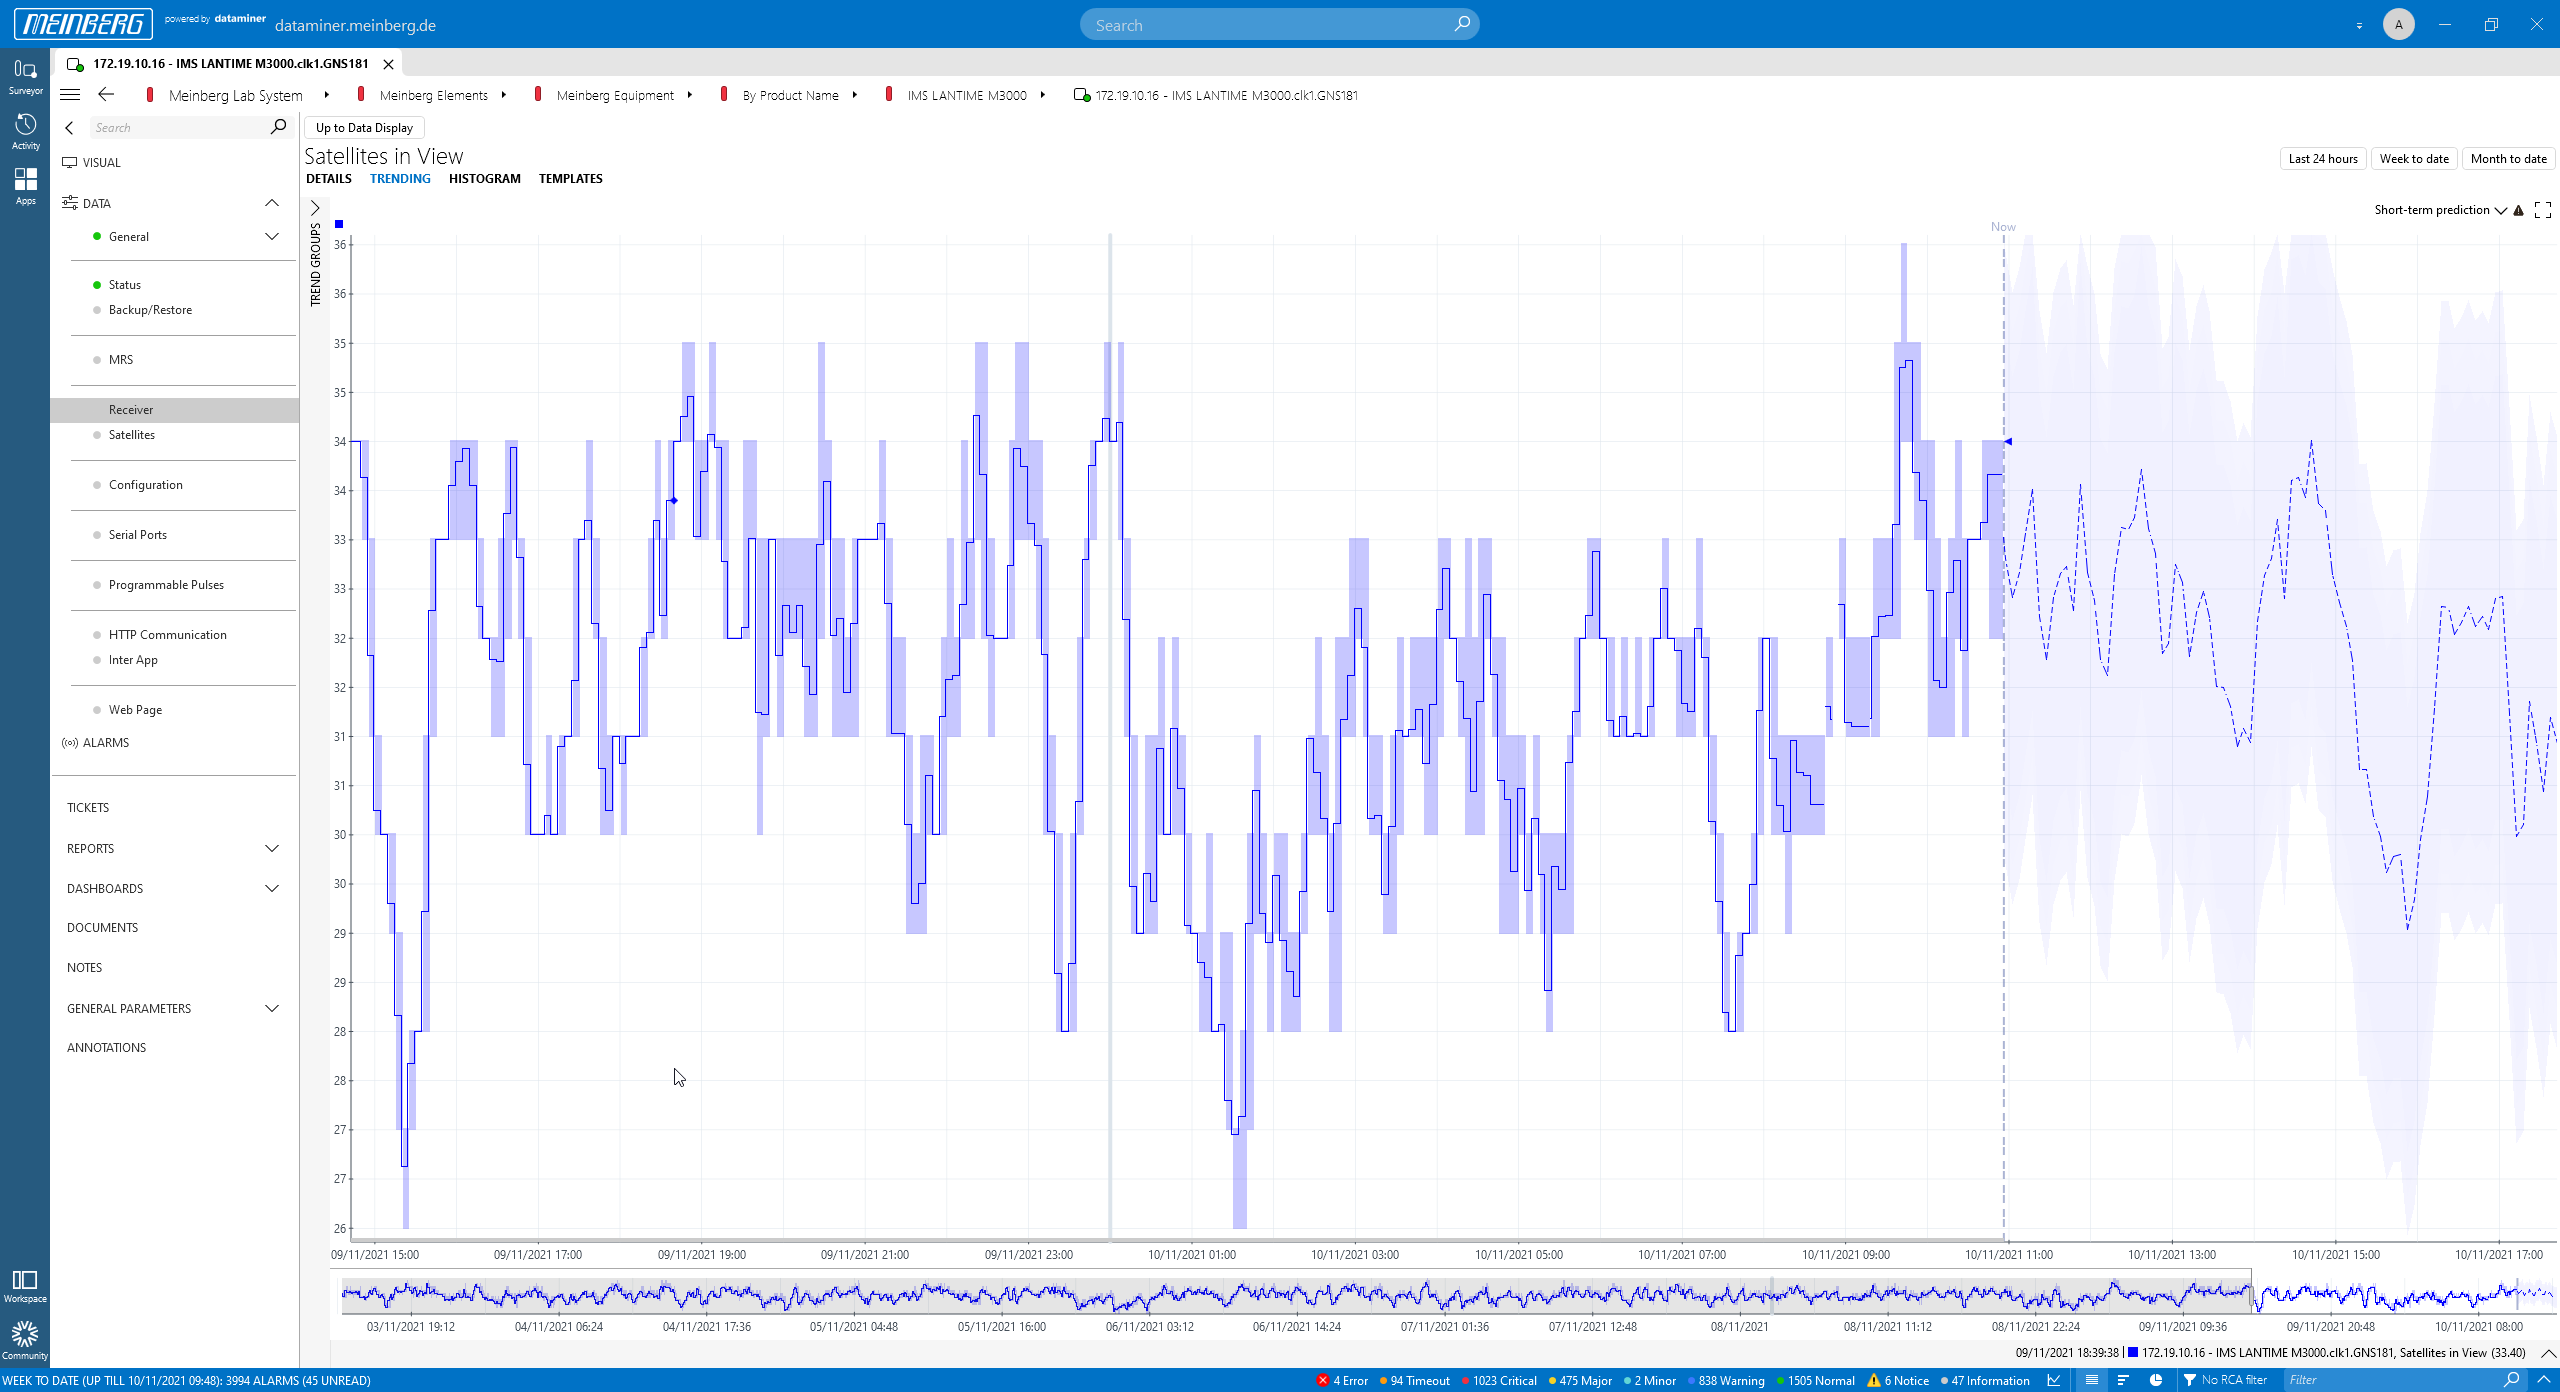 "Satellites in View" trend graph. The dotted line on the right is actually the predicted value, calculated by the ngbNMS AI engine.
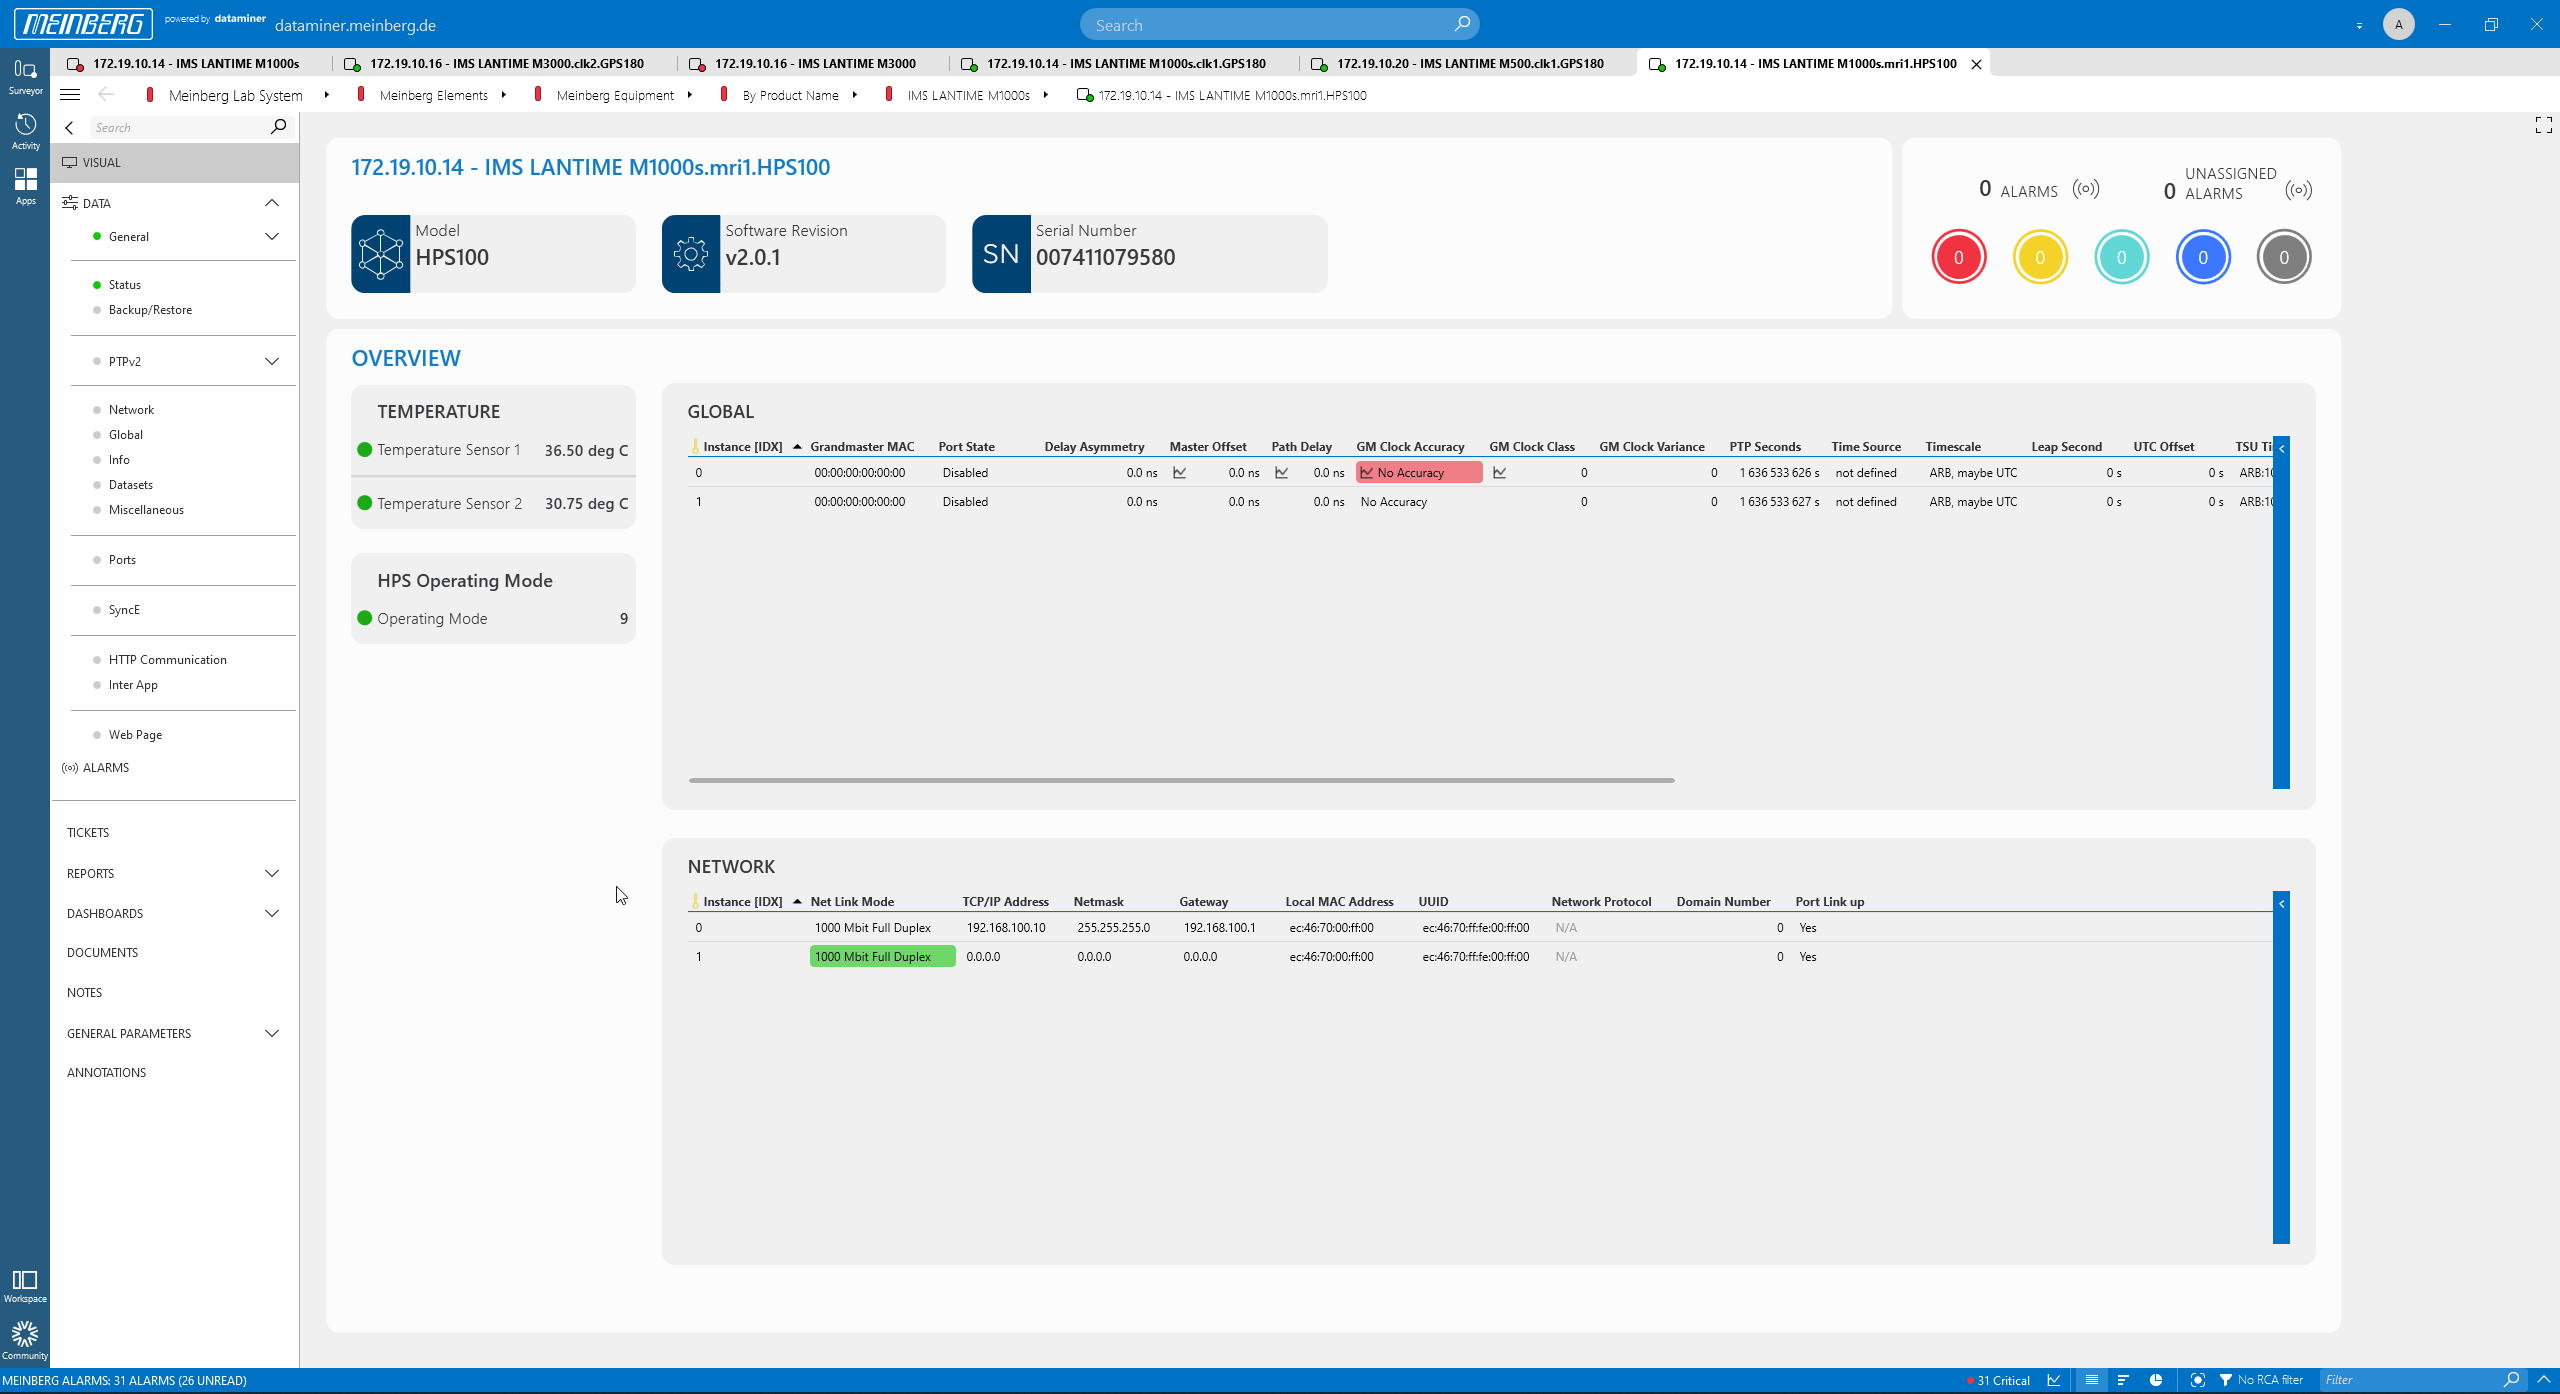 Here is an HPS100 card to manage PTP, showing an alarm. The card could not sync with any PTP Grandmaster.
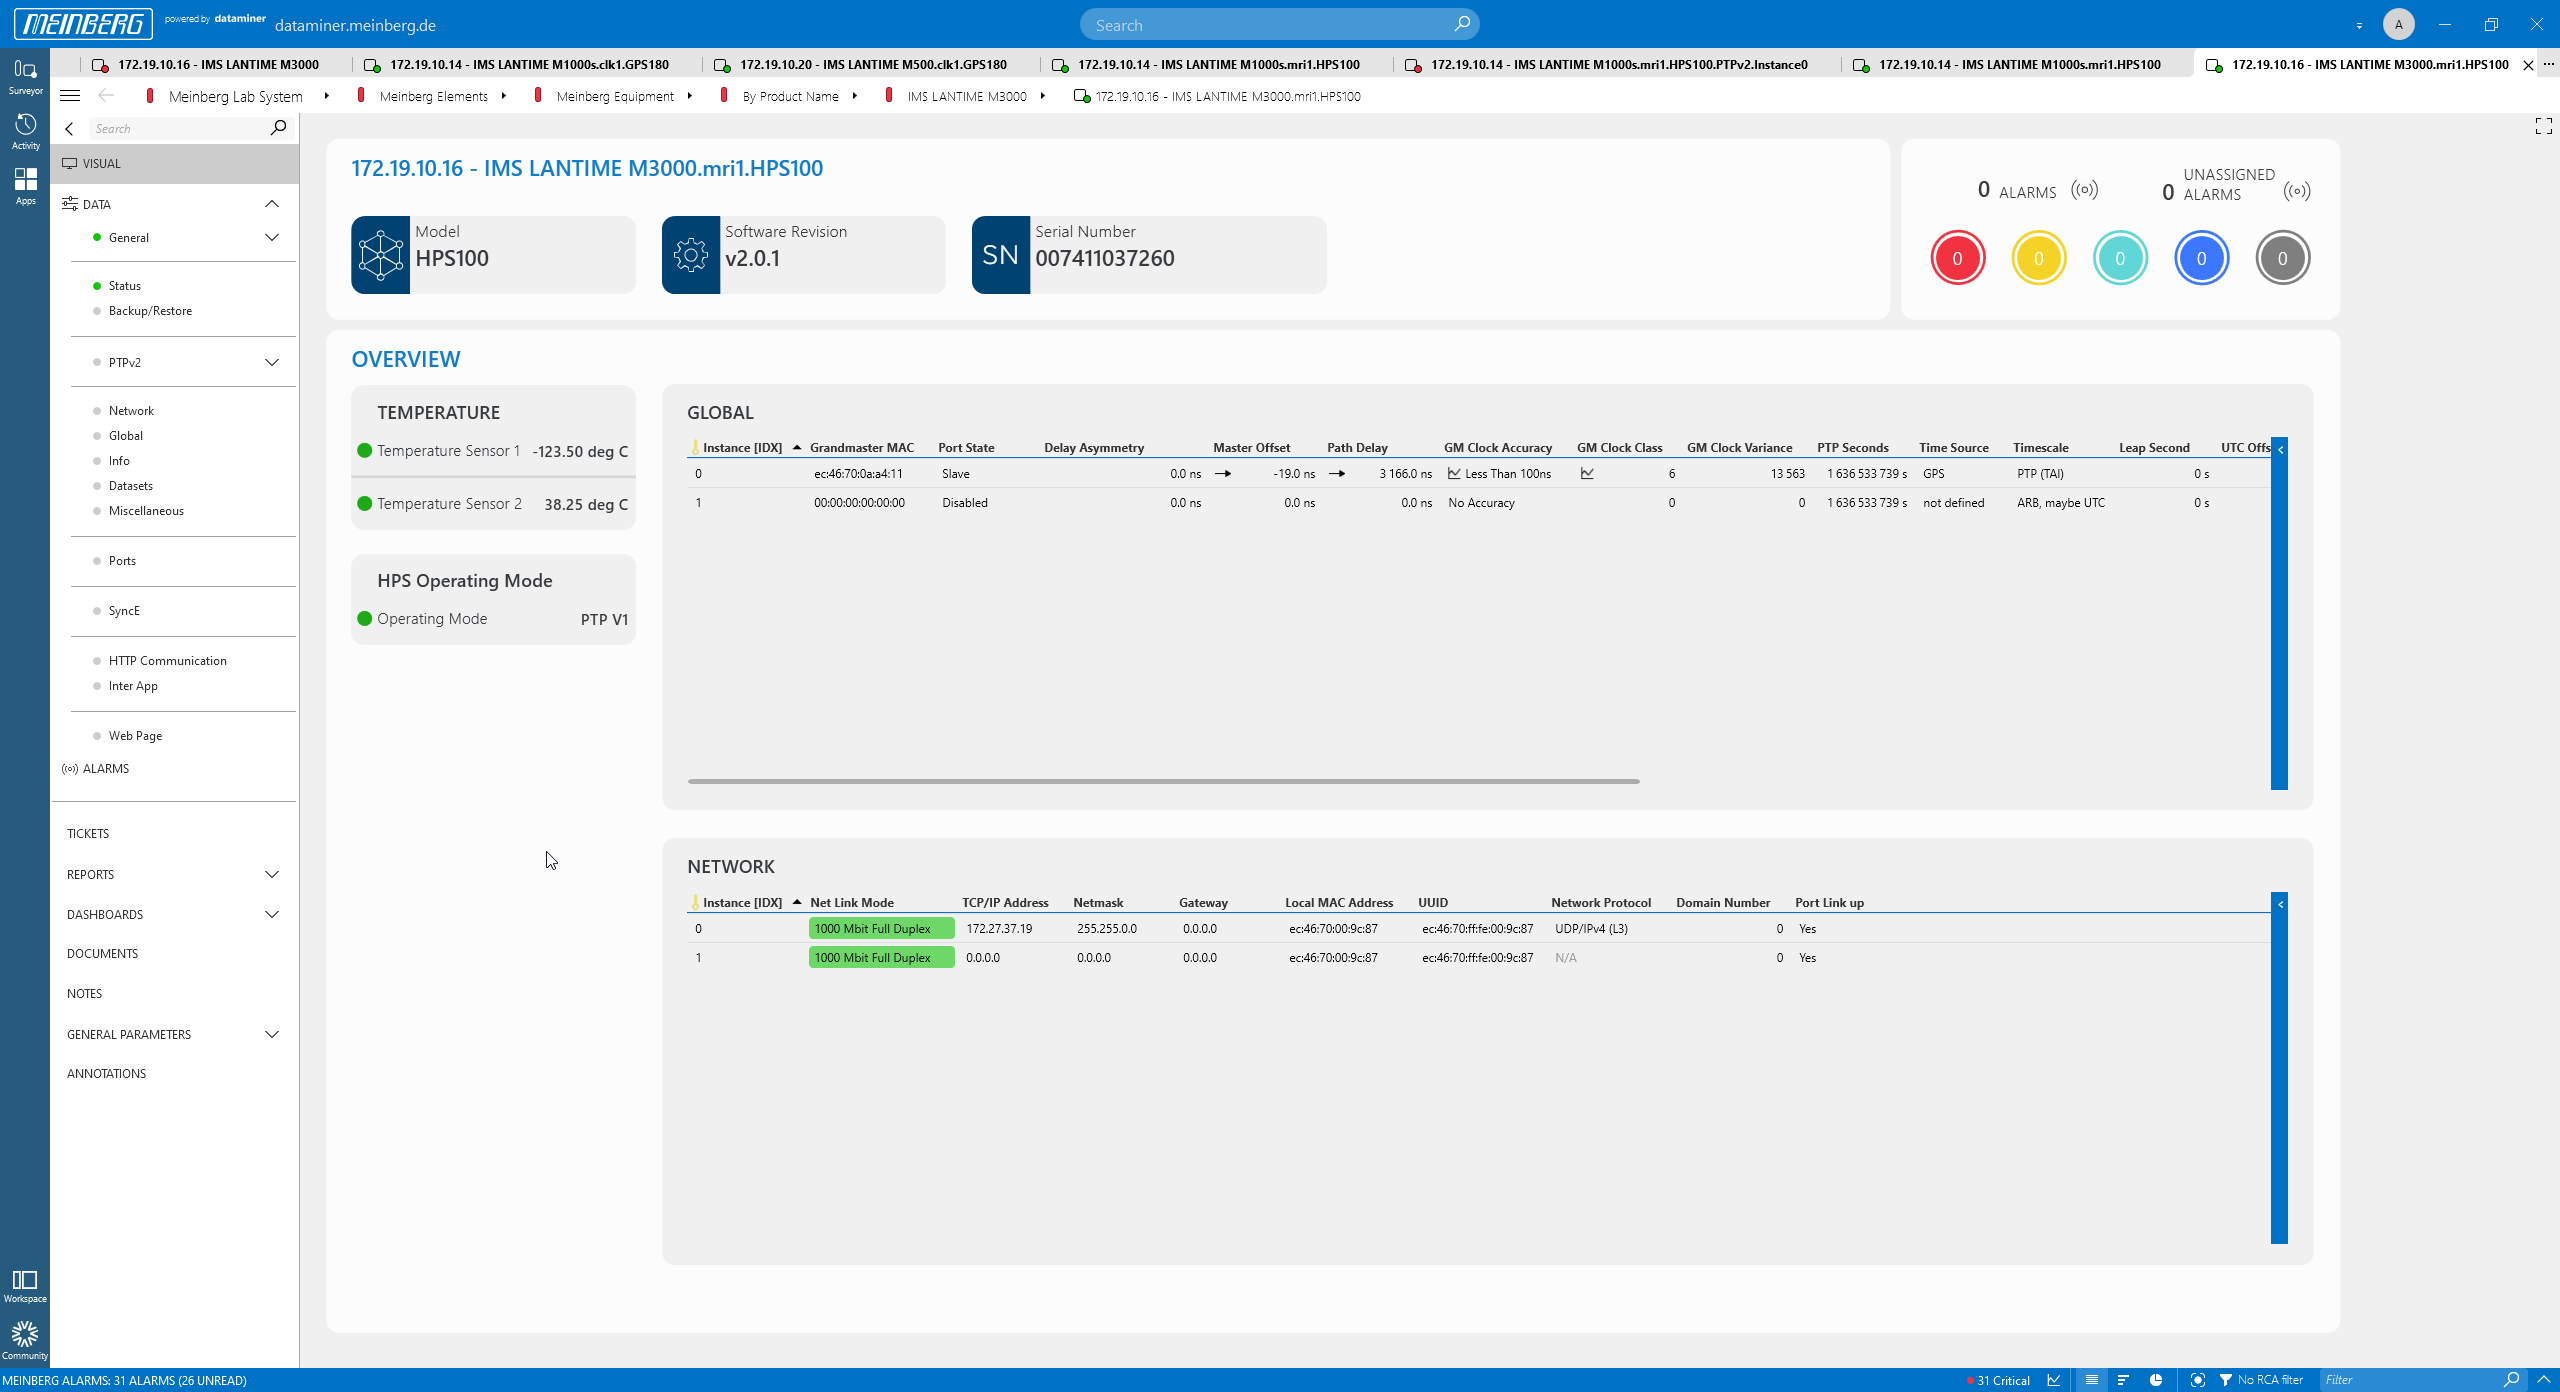 This HPS card is working fine. Alarms on the parameters can monitored and the performance of each parameter can be tracked over time, e.g. for master offset, path delay etc.
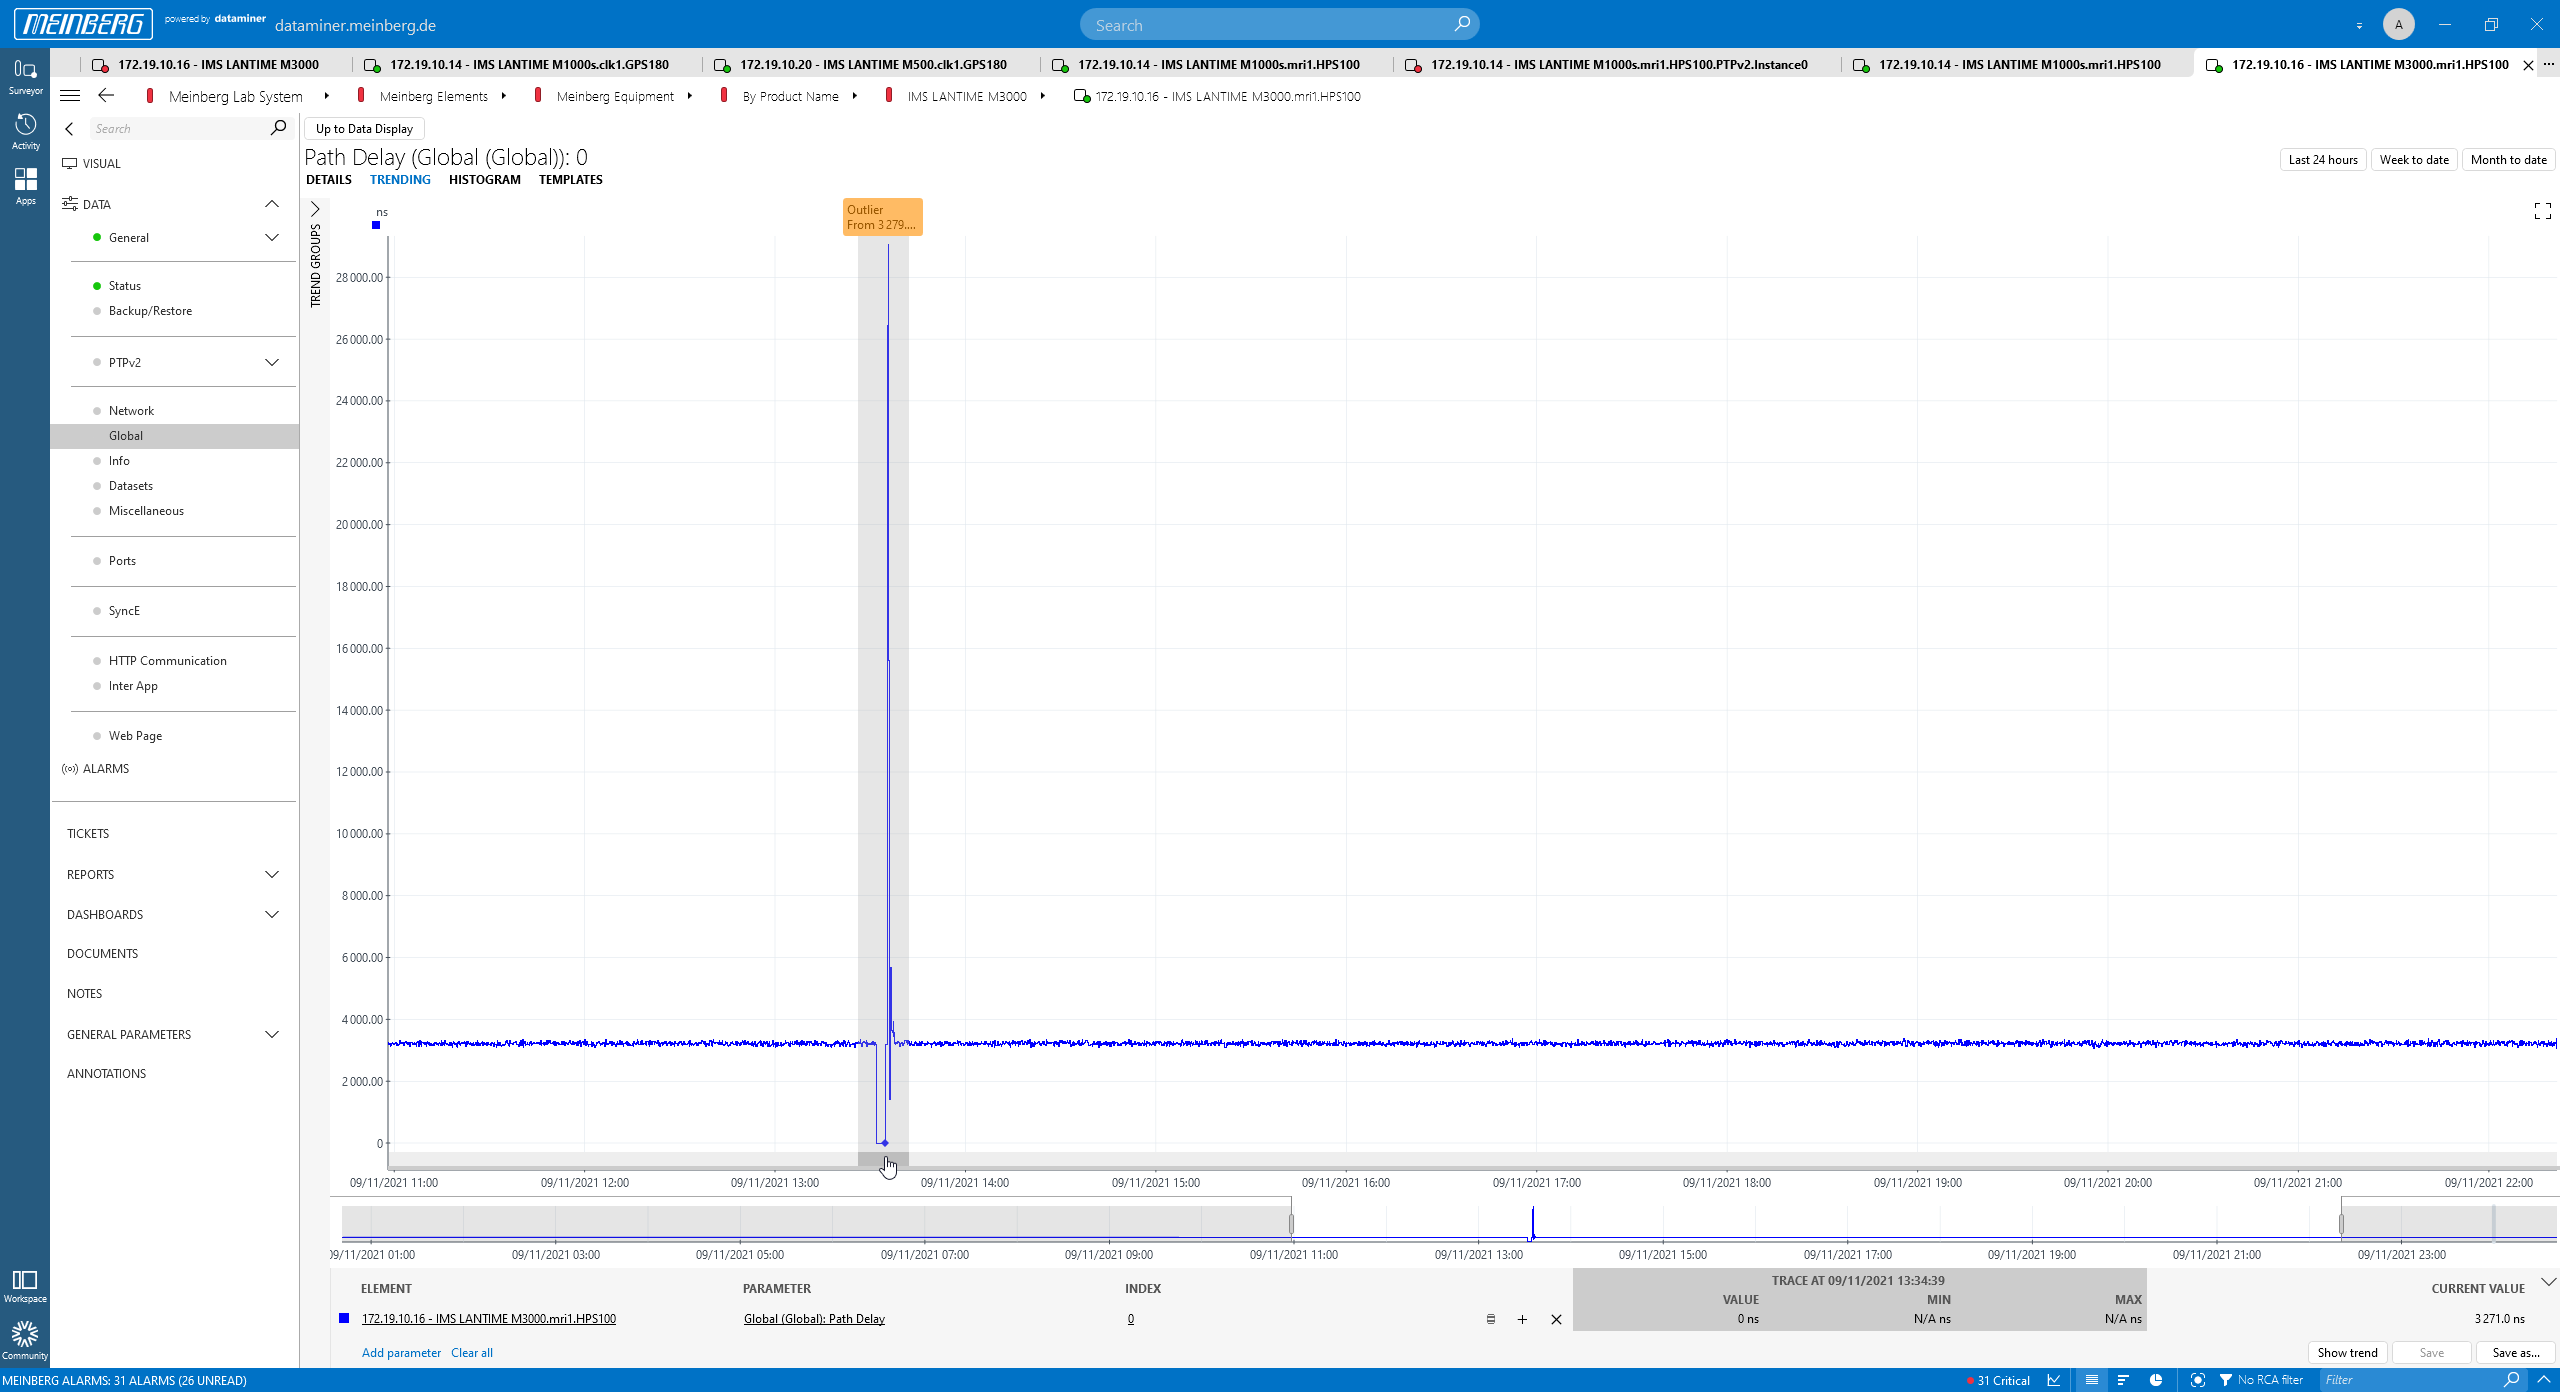 Here is a fairly stable trend graph (for path delay) with one outlier that was automatically detected by the built-in AI functionality of the mbgNMS. While you might say that this peak is obvious, it is important to note that this change got detected without any further configuration; no min. or max. threshold have been configured.
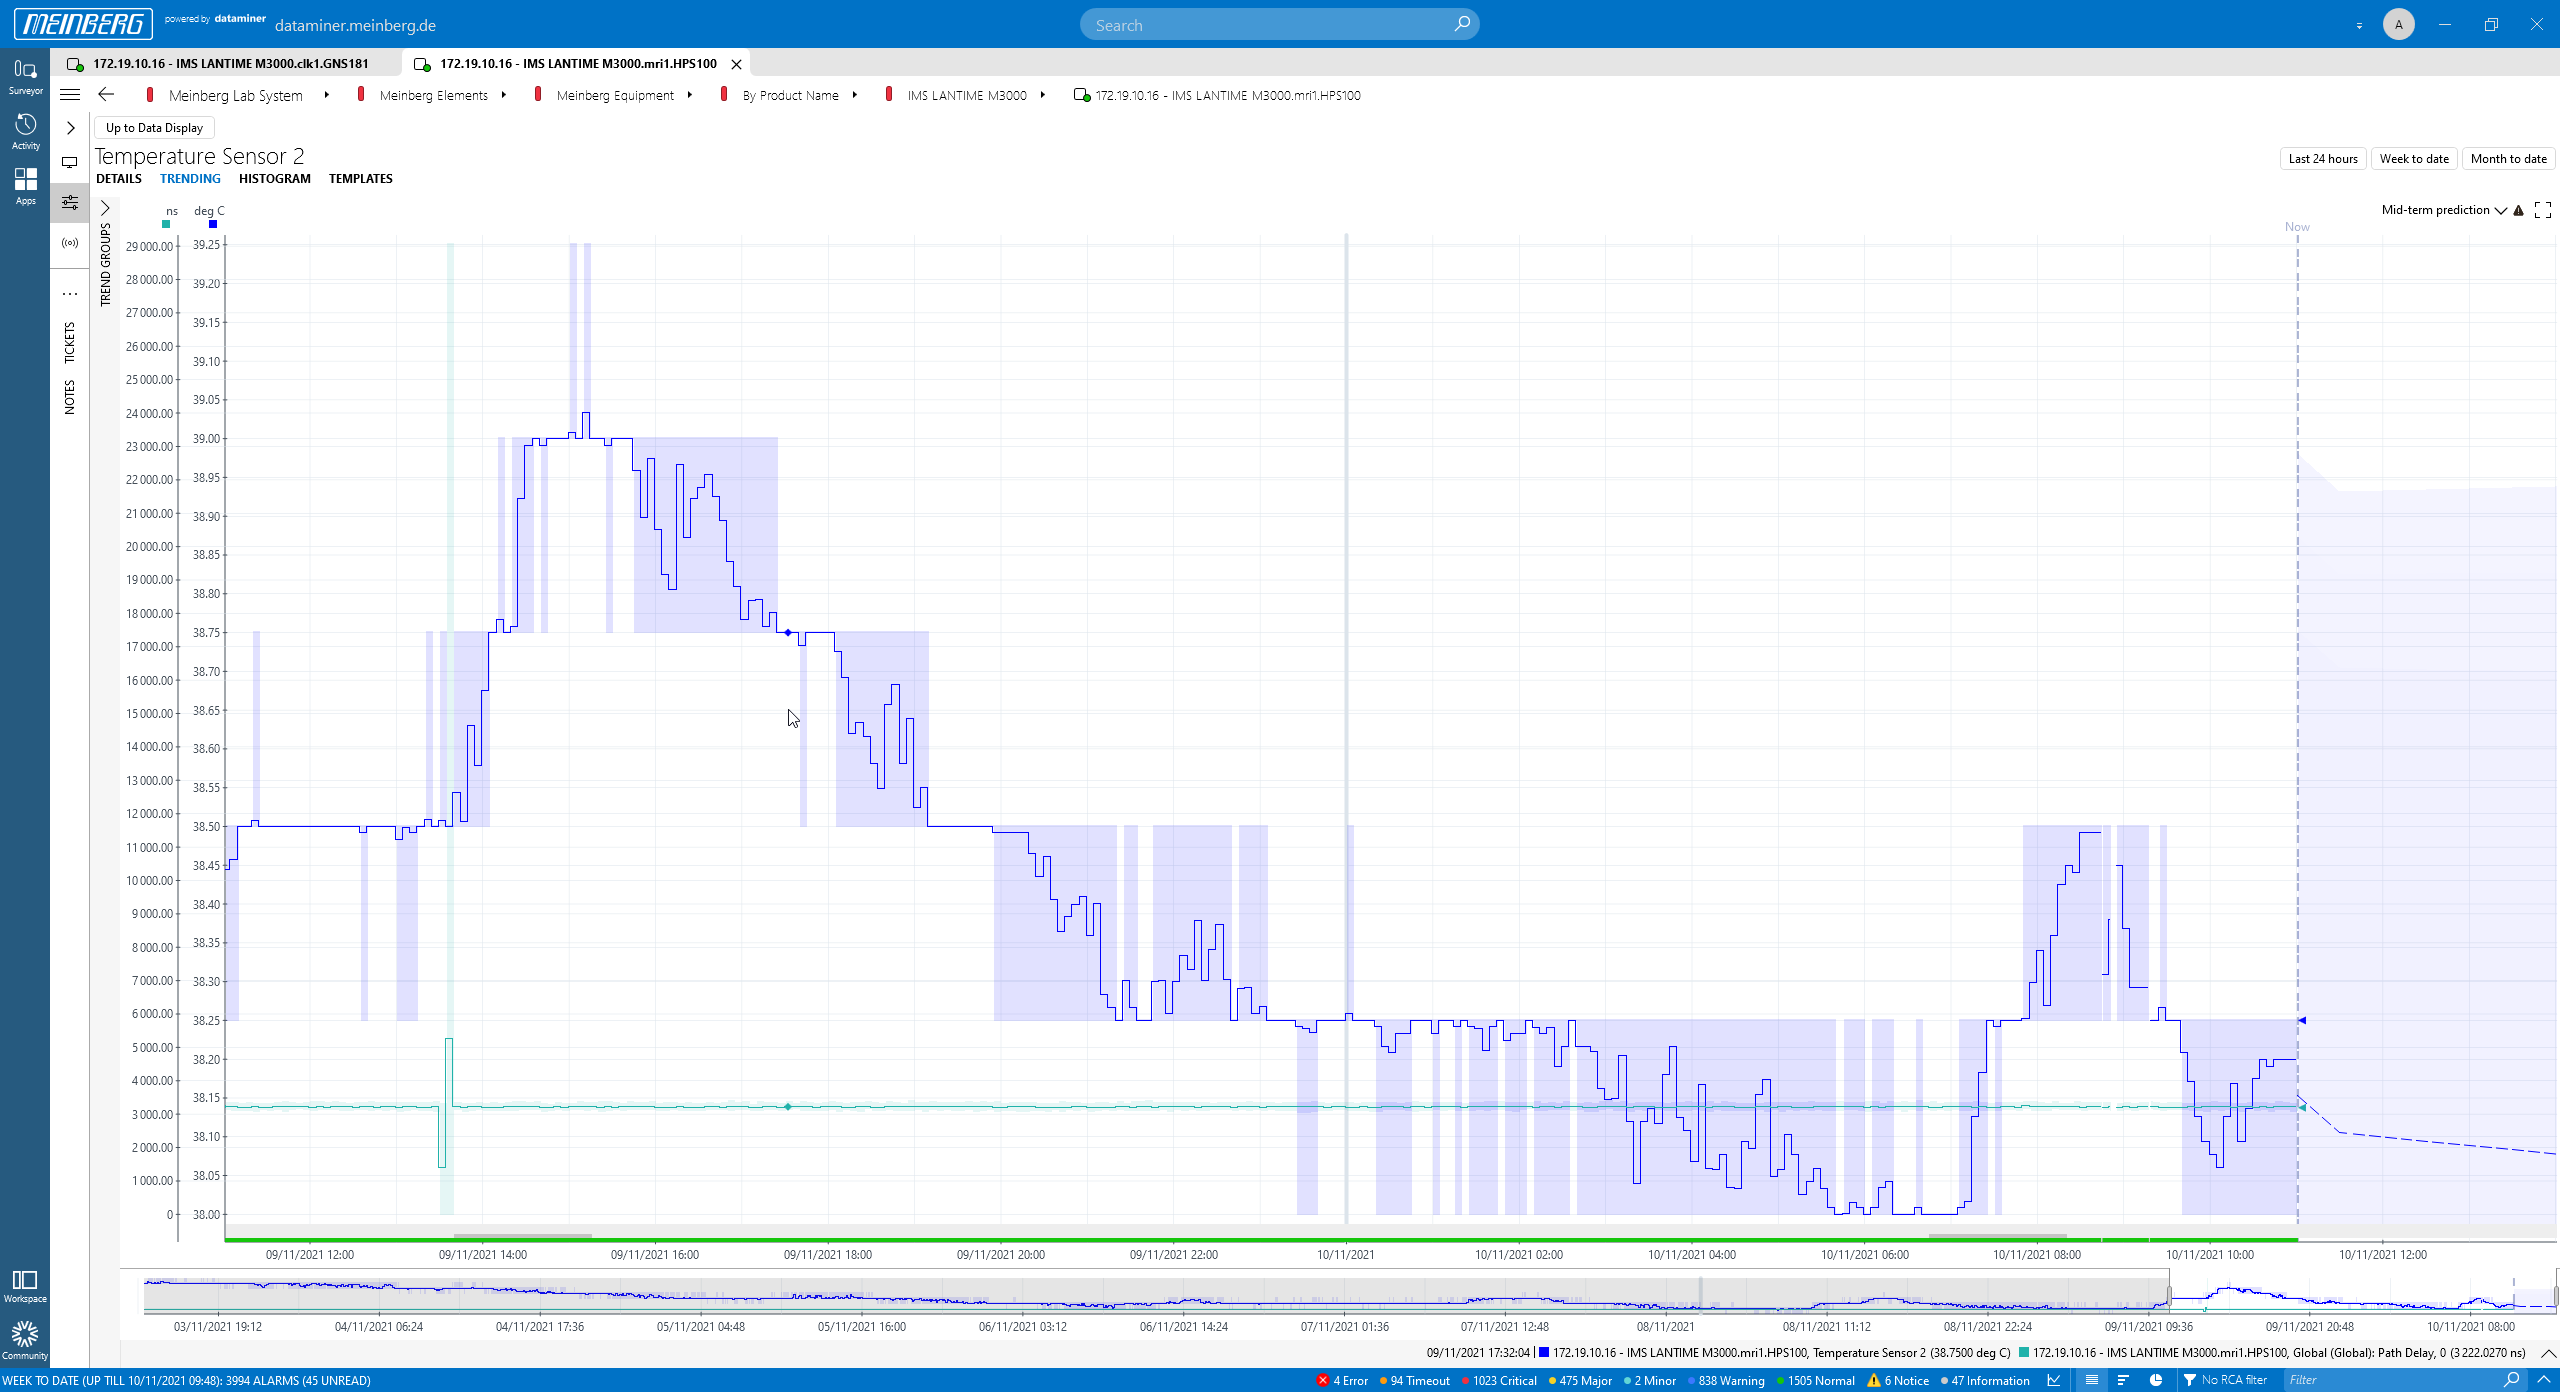 You can also add and overlay additional trend graphs showing parameters from the same device or from other devices. This example shows the temperature sensor and path delay of an HPS card.
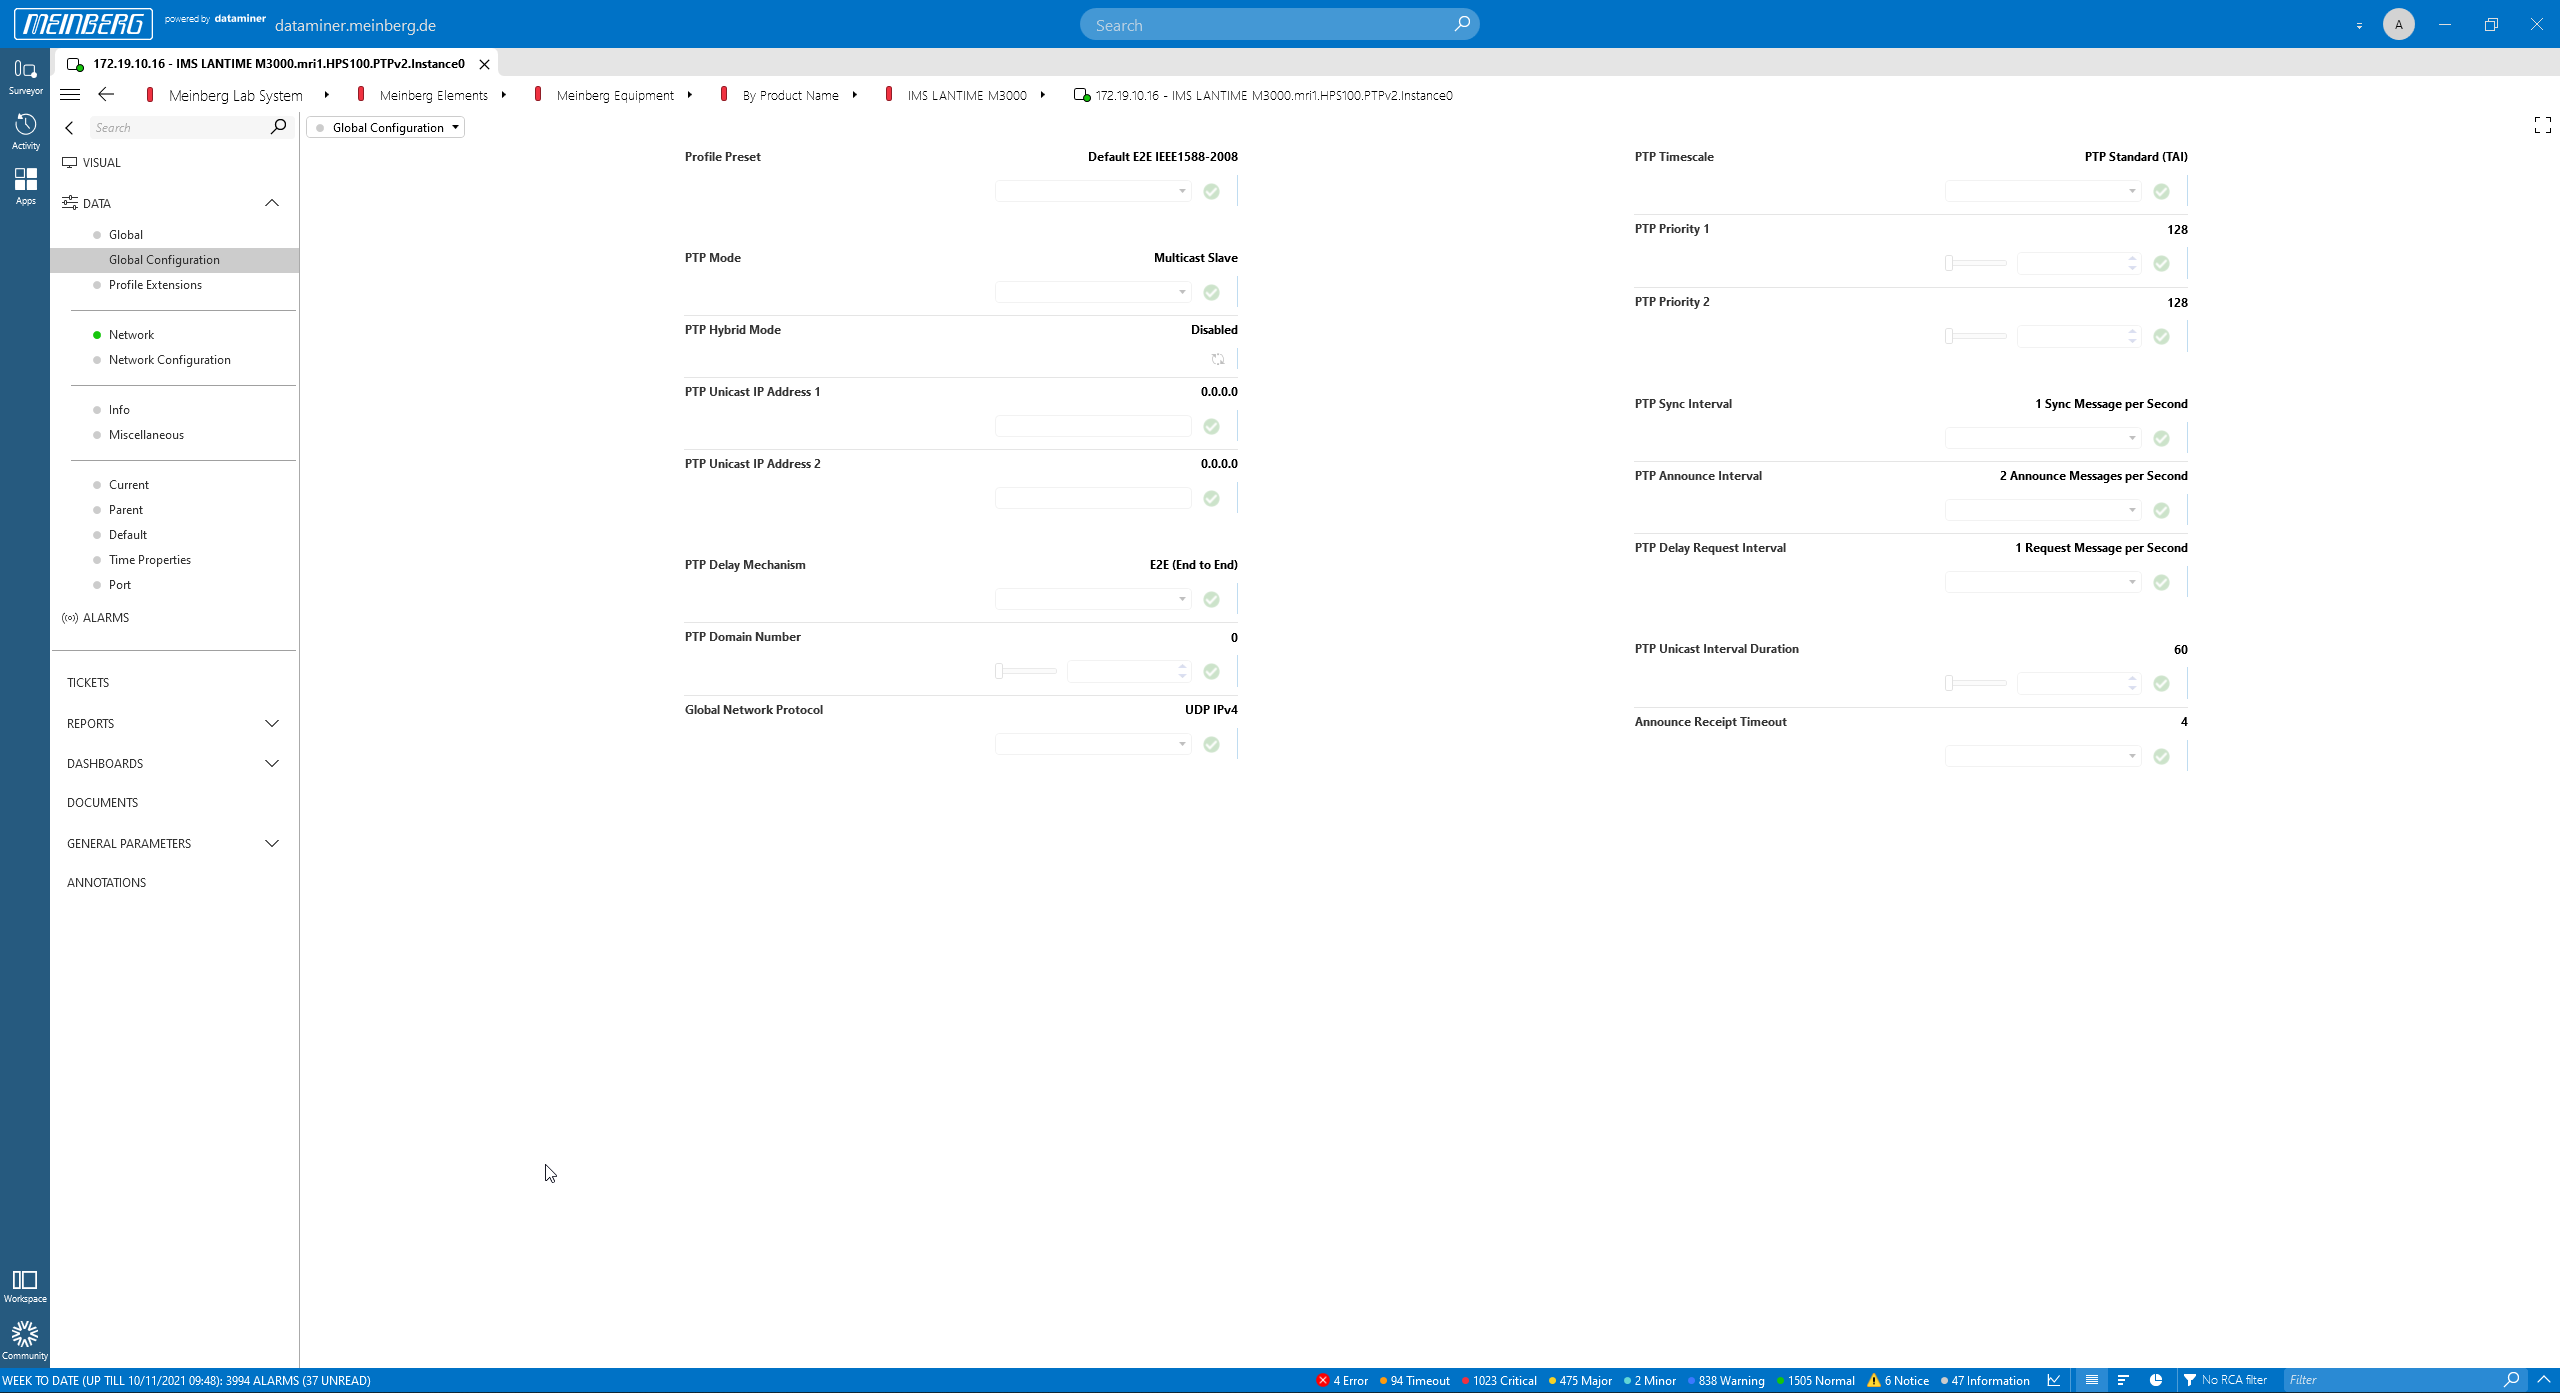 Drill down to any of the data pages of any card to monitor or control every single parameter. This screenshot shows the global PTP configuration of an HPS card.
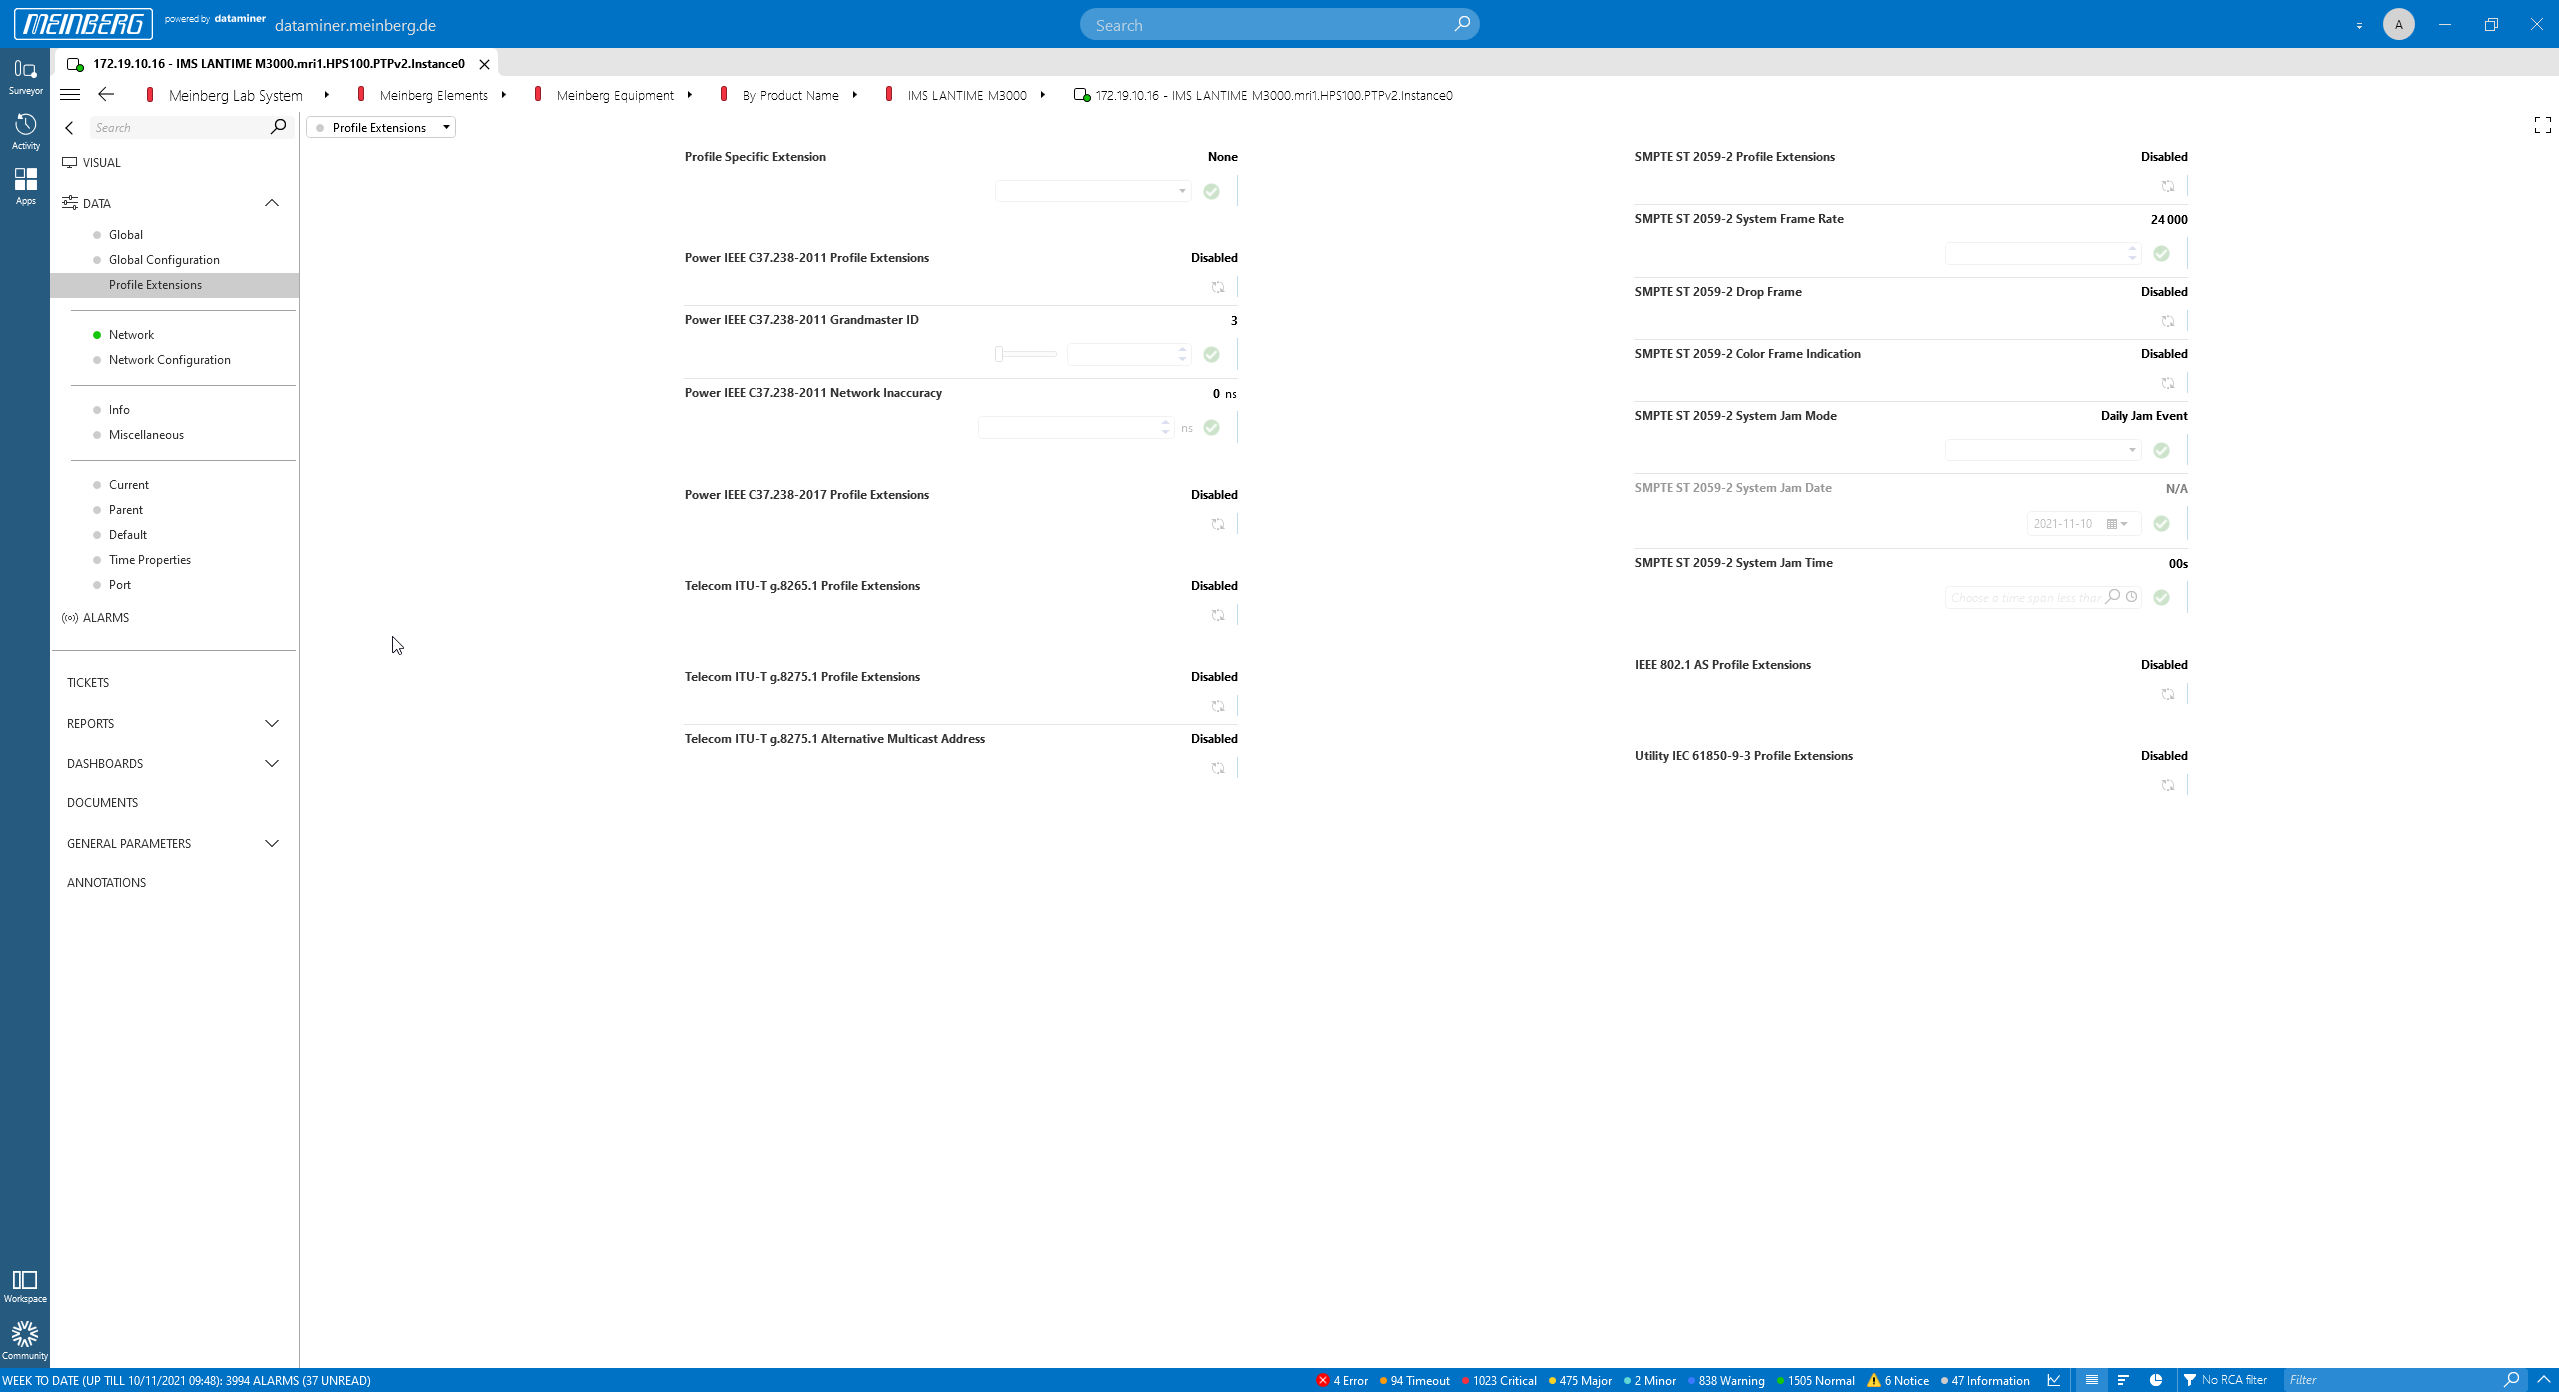 Here PTP profiles can be configured.
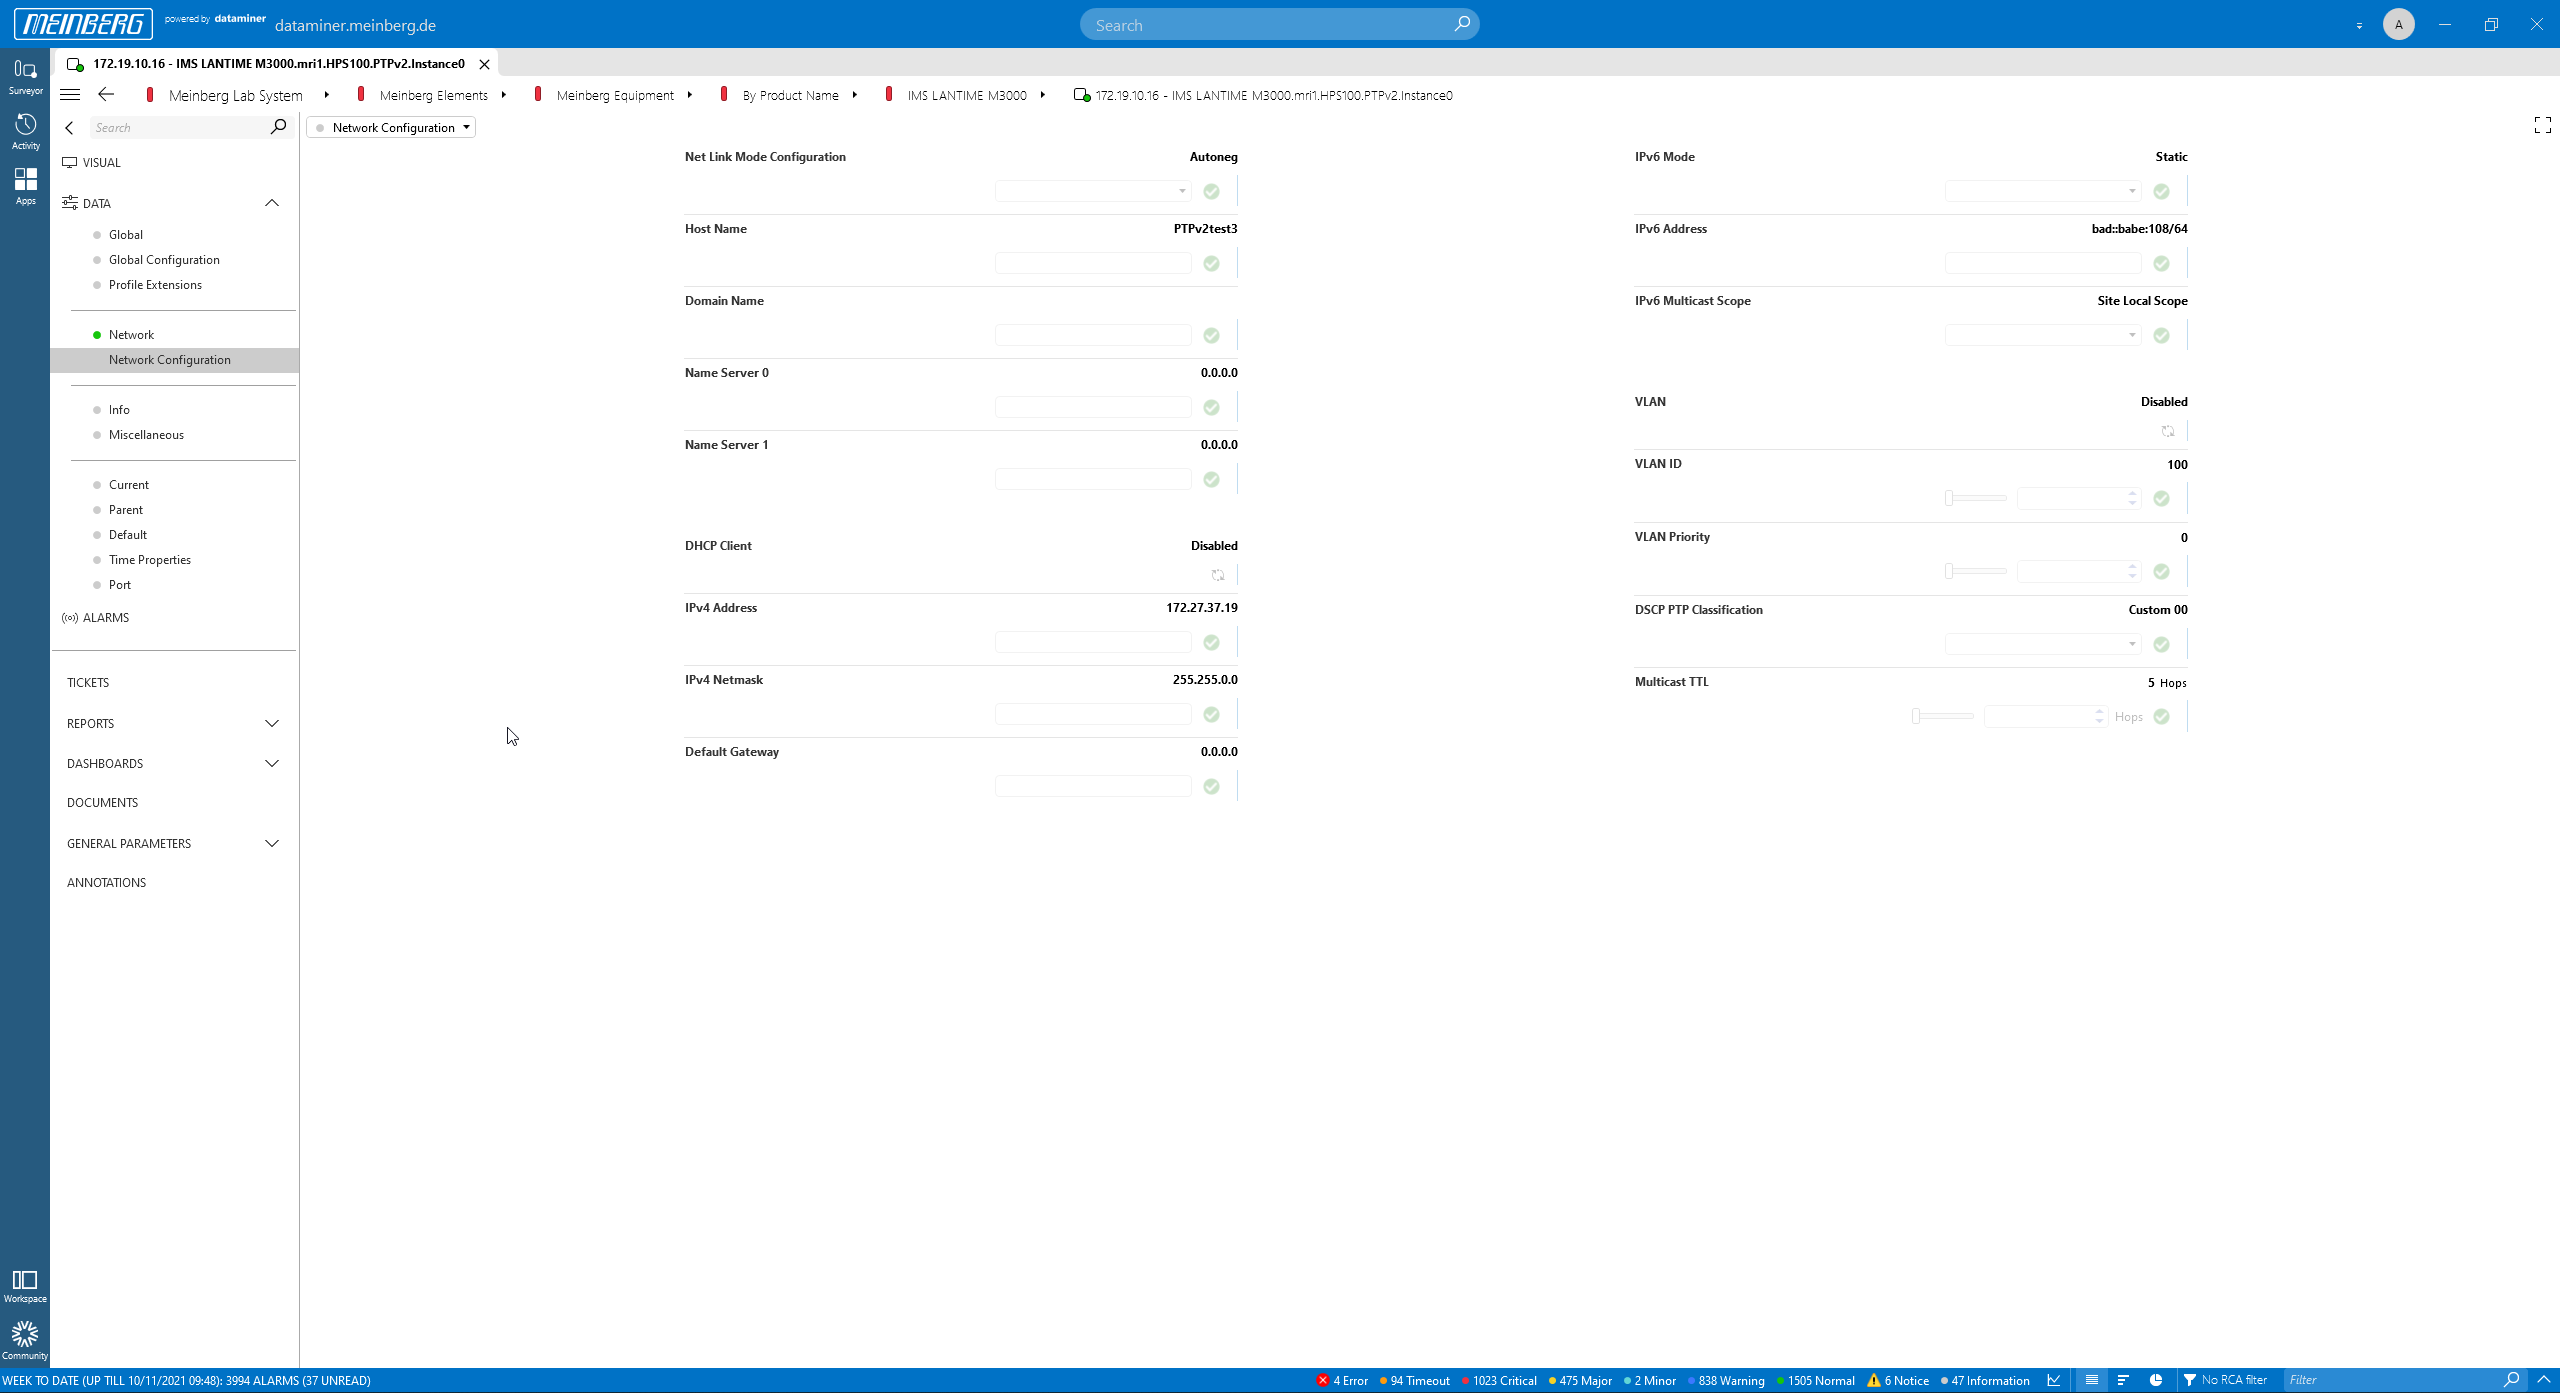 The "Network Configuration" page.
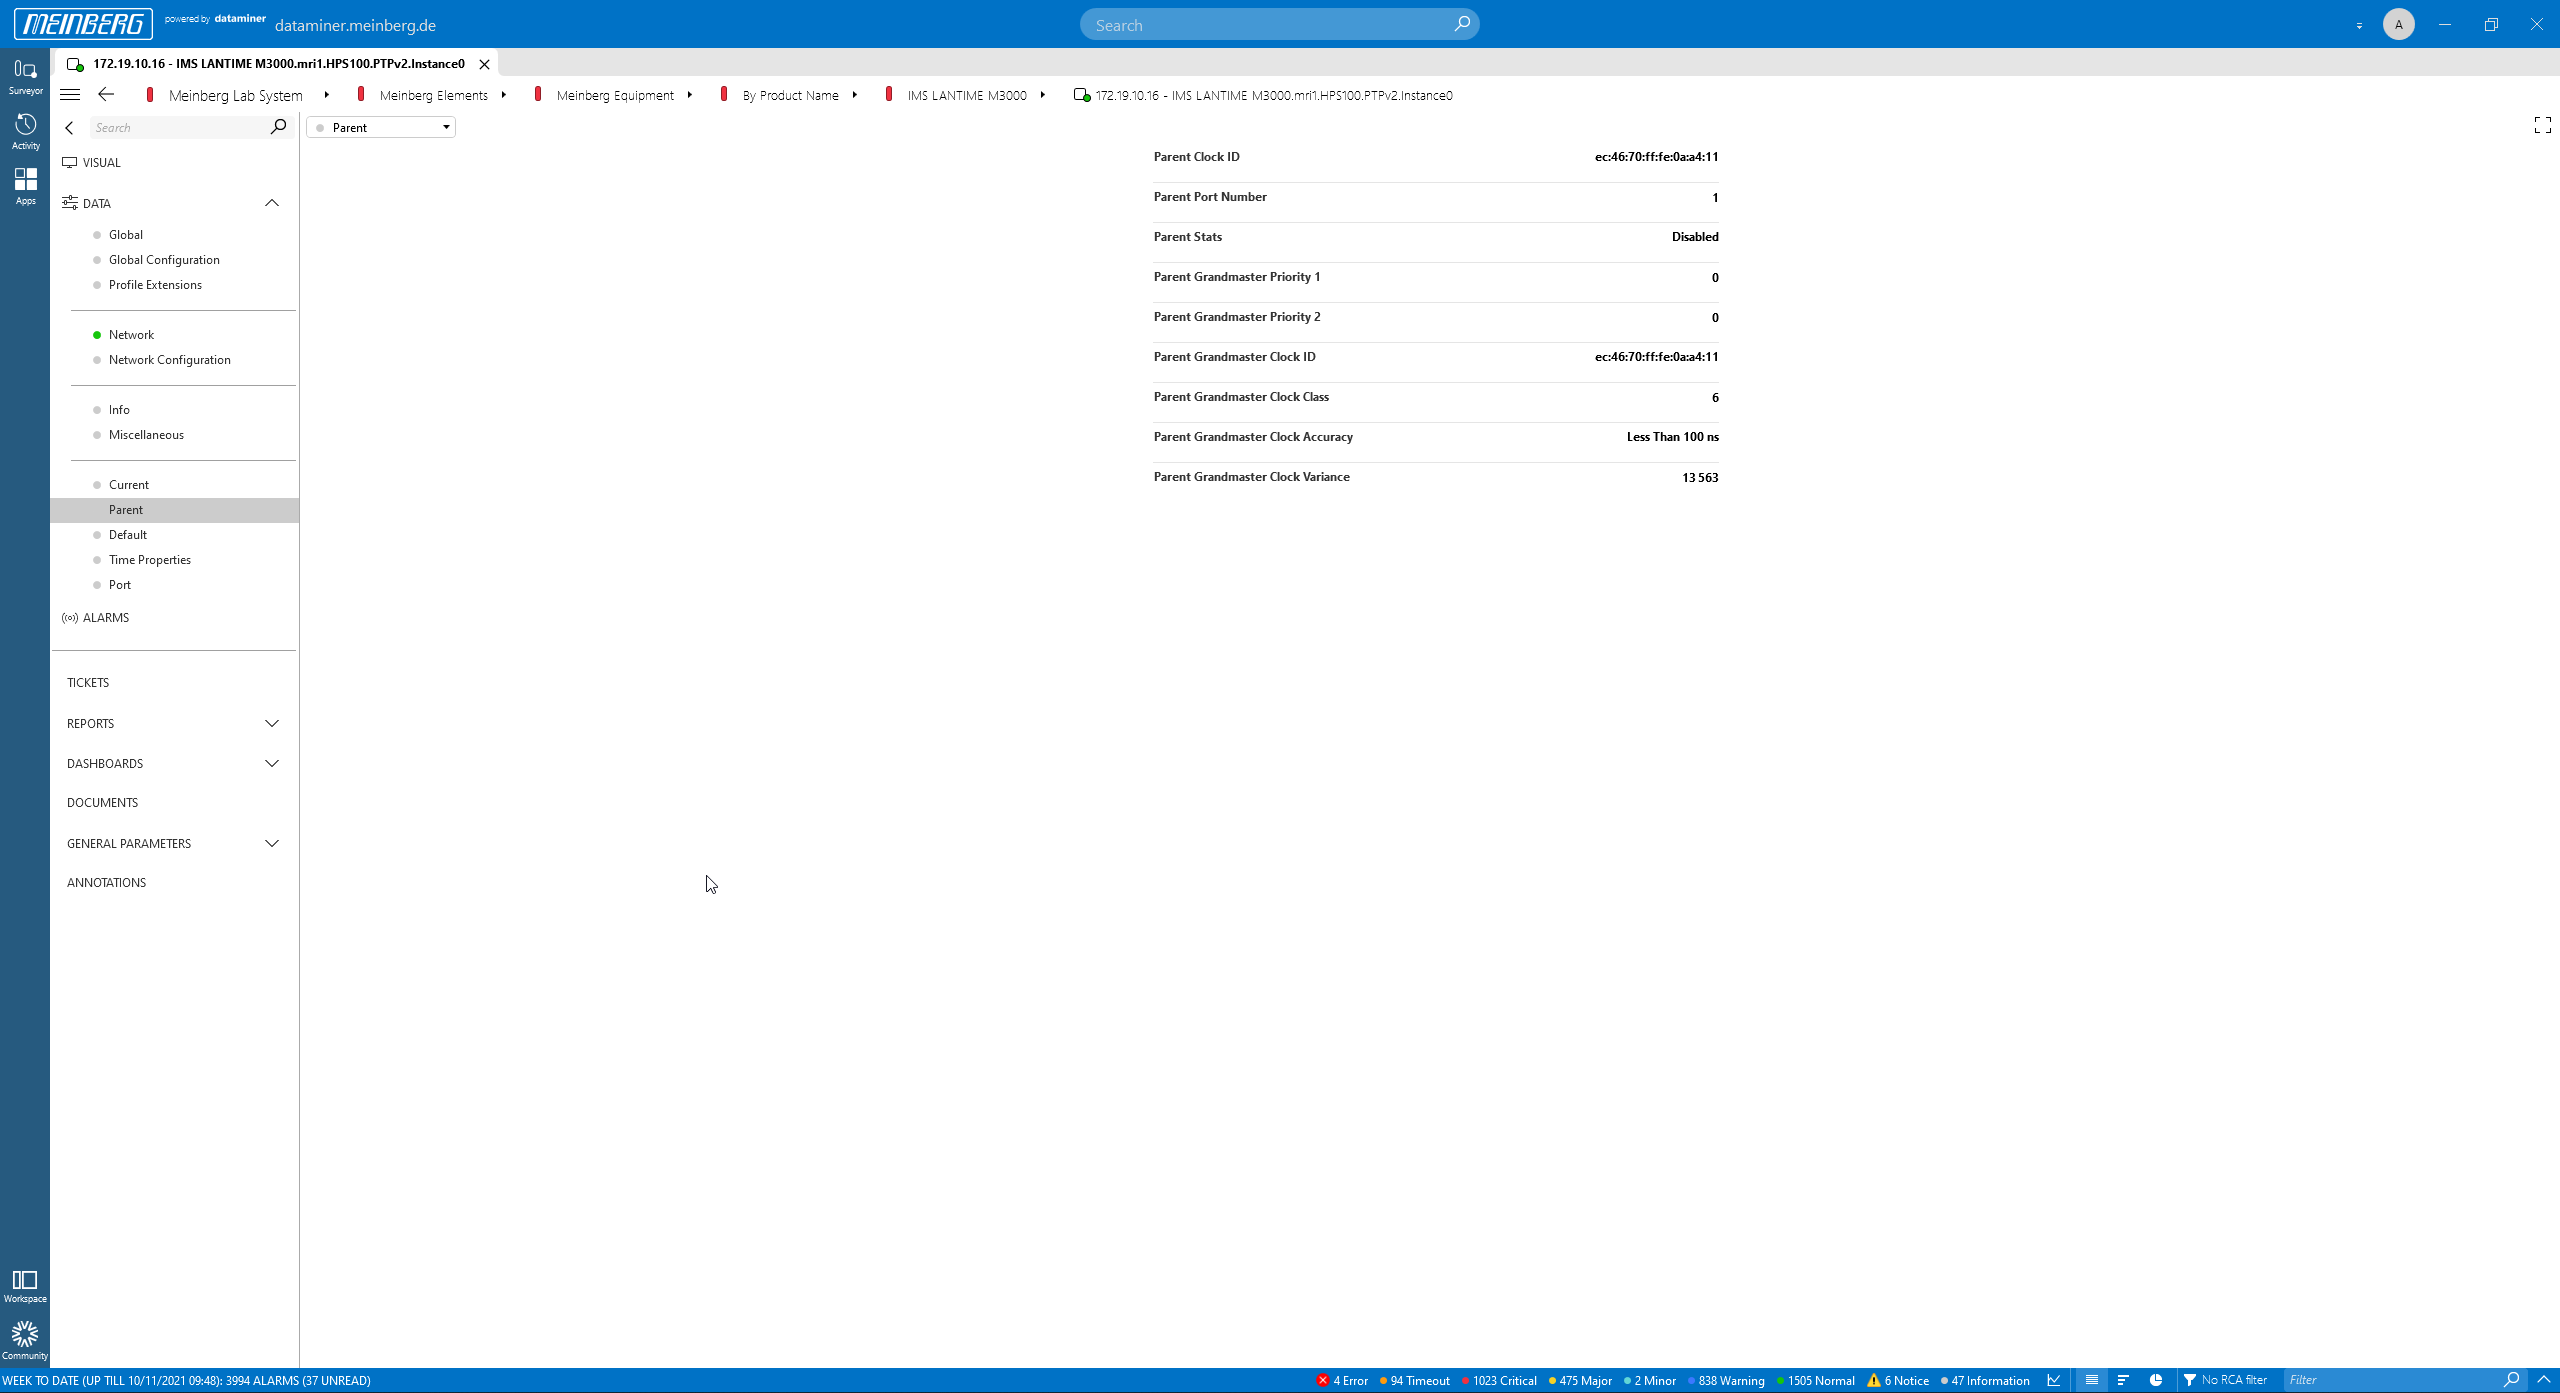 The PTP "Parent" page.
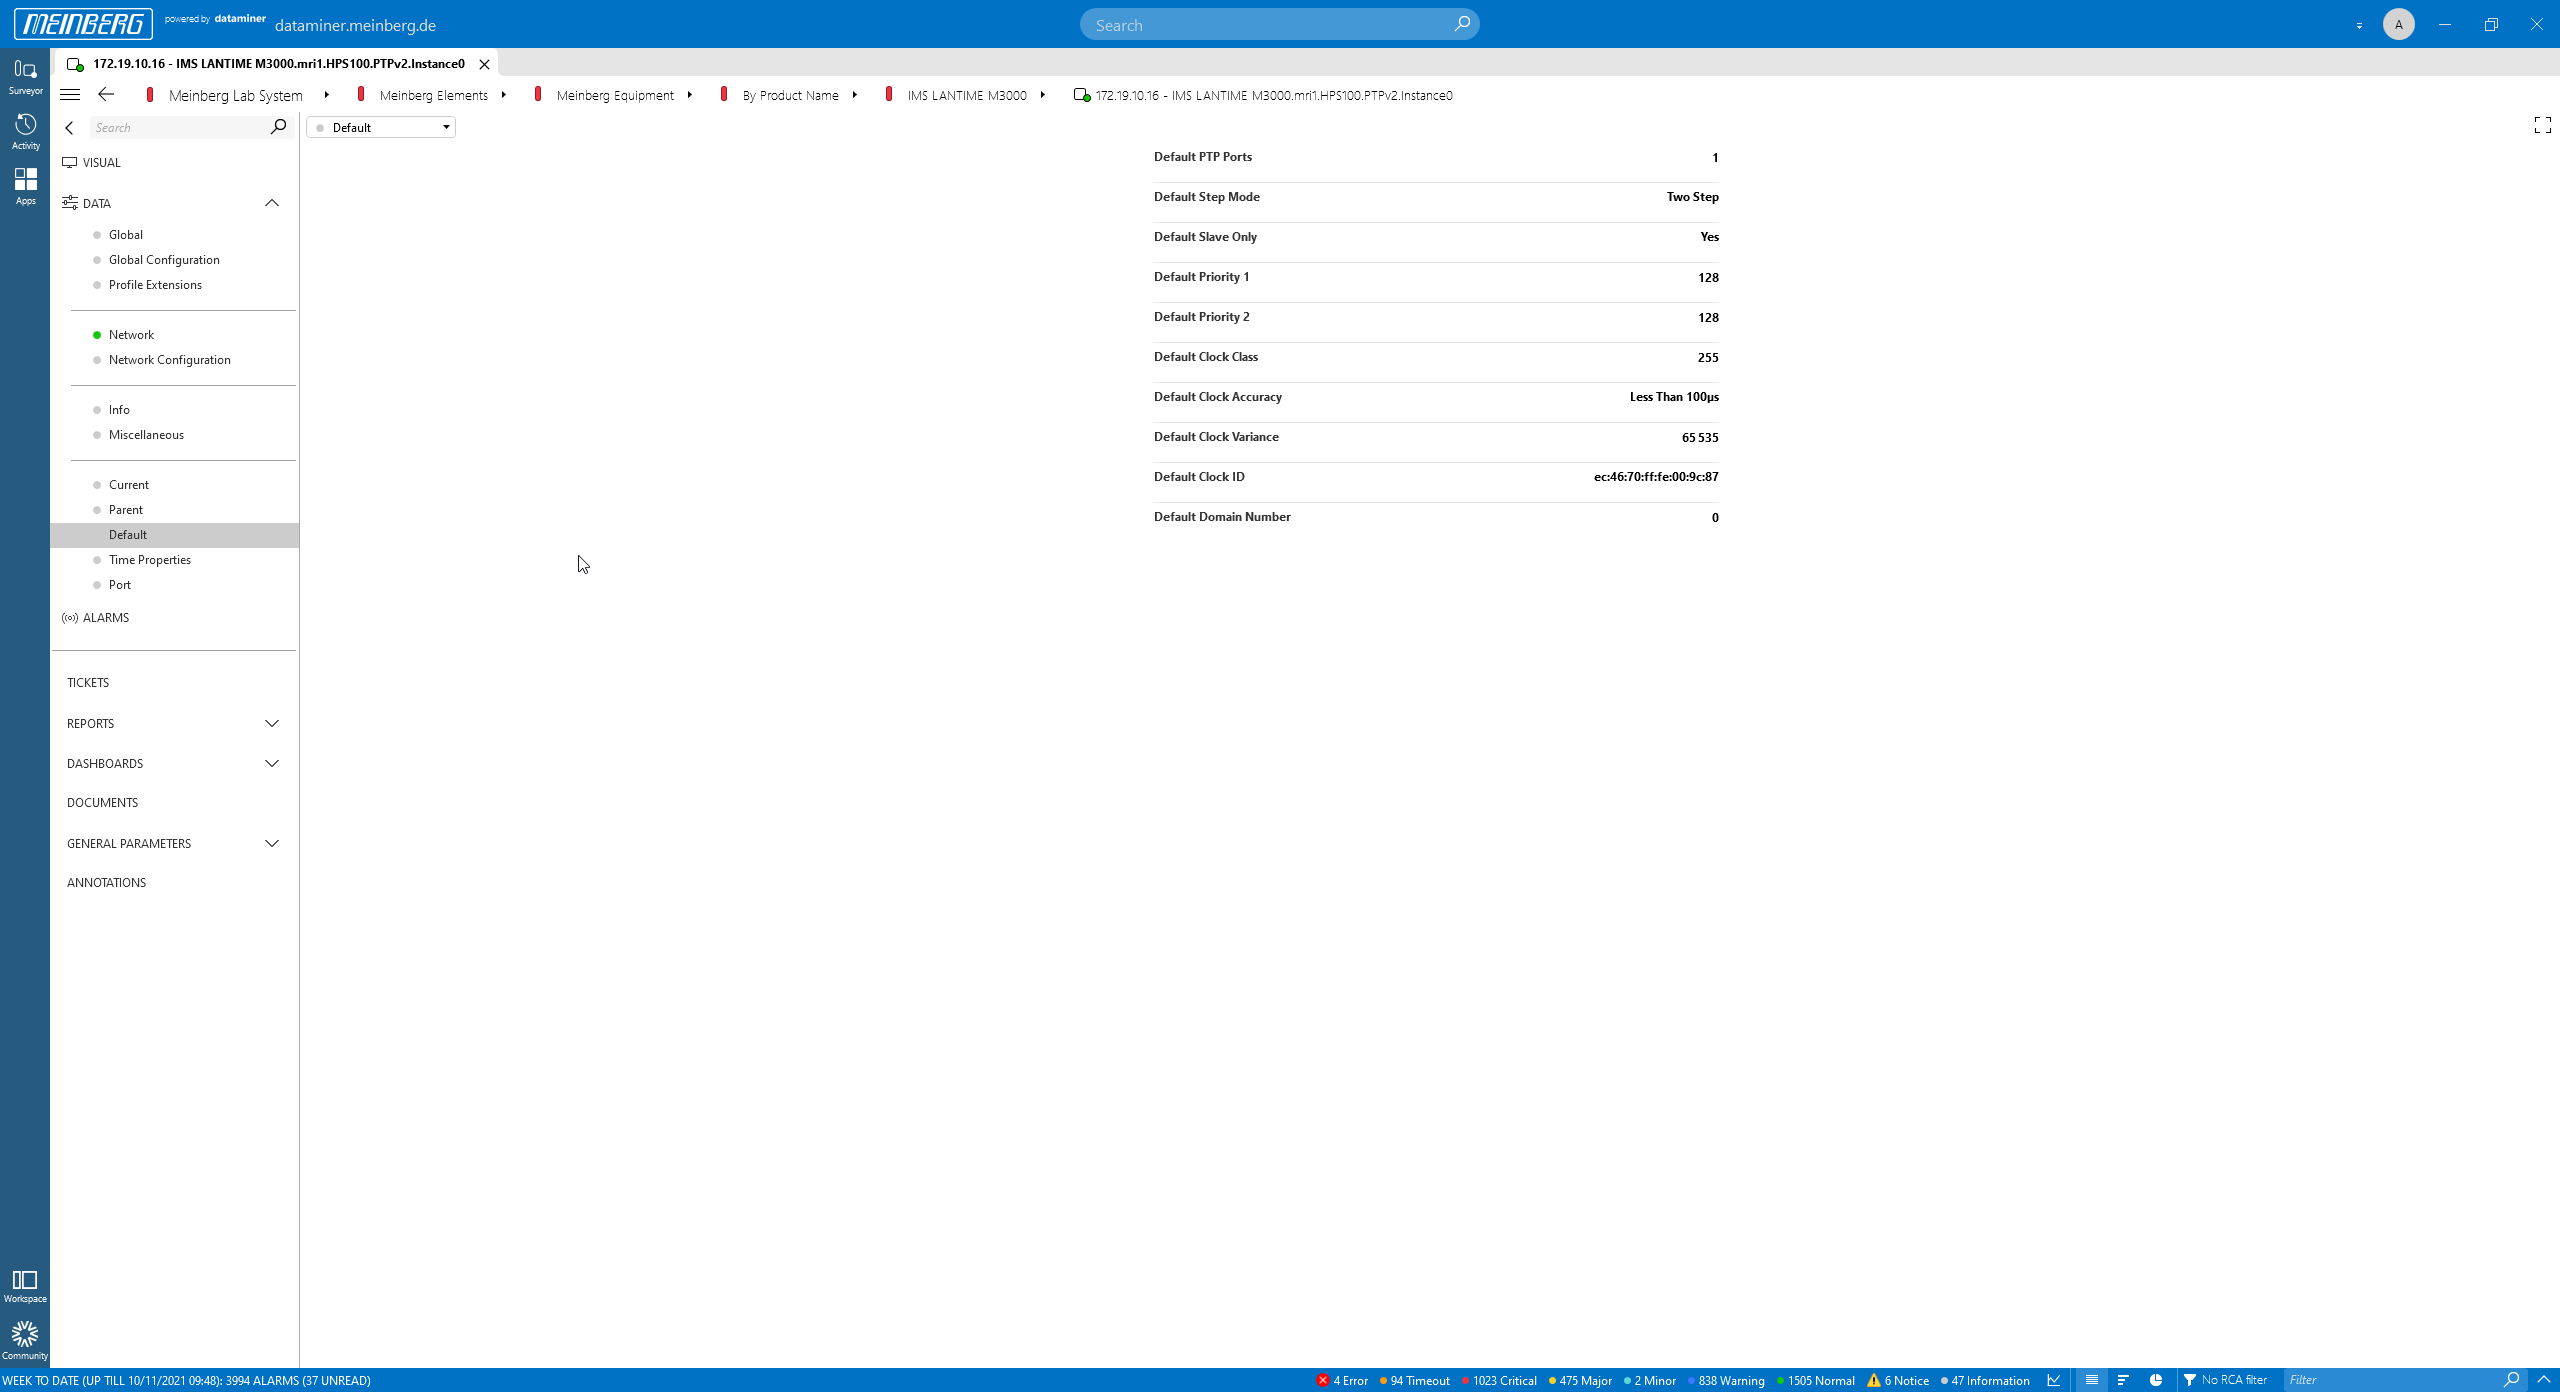 The PTP "Default" page.
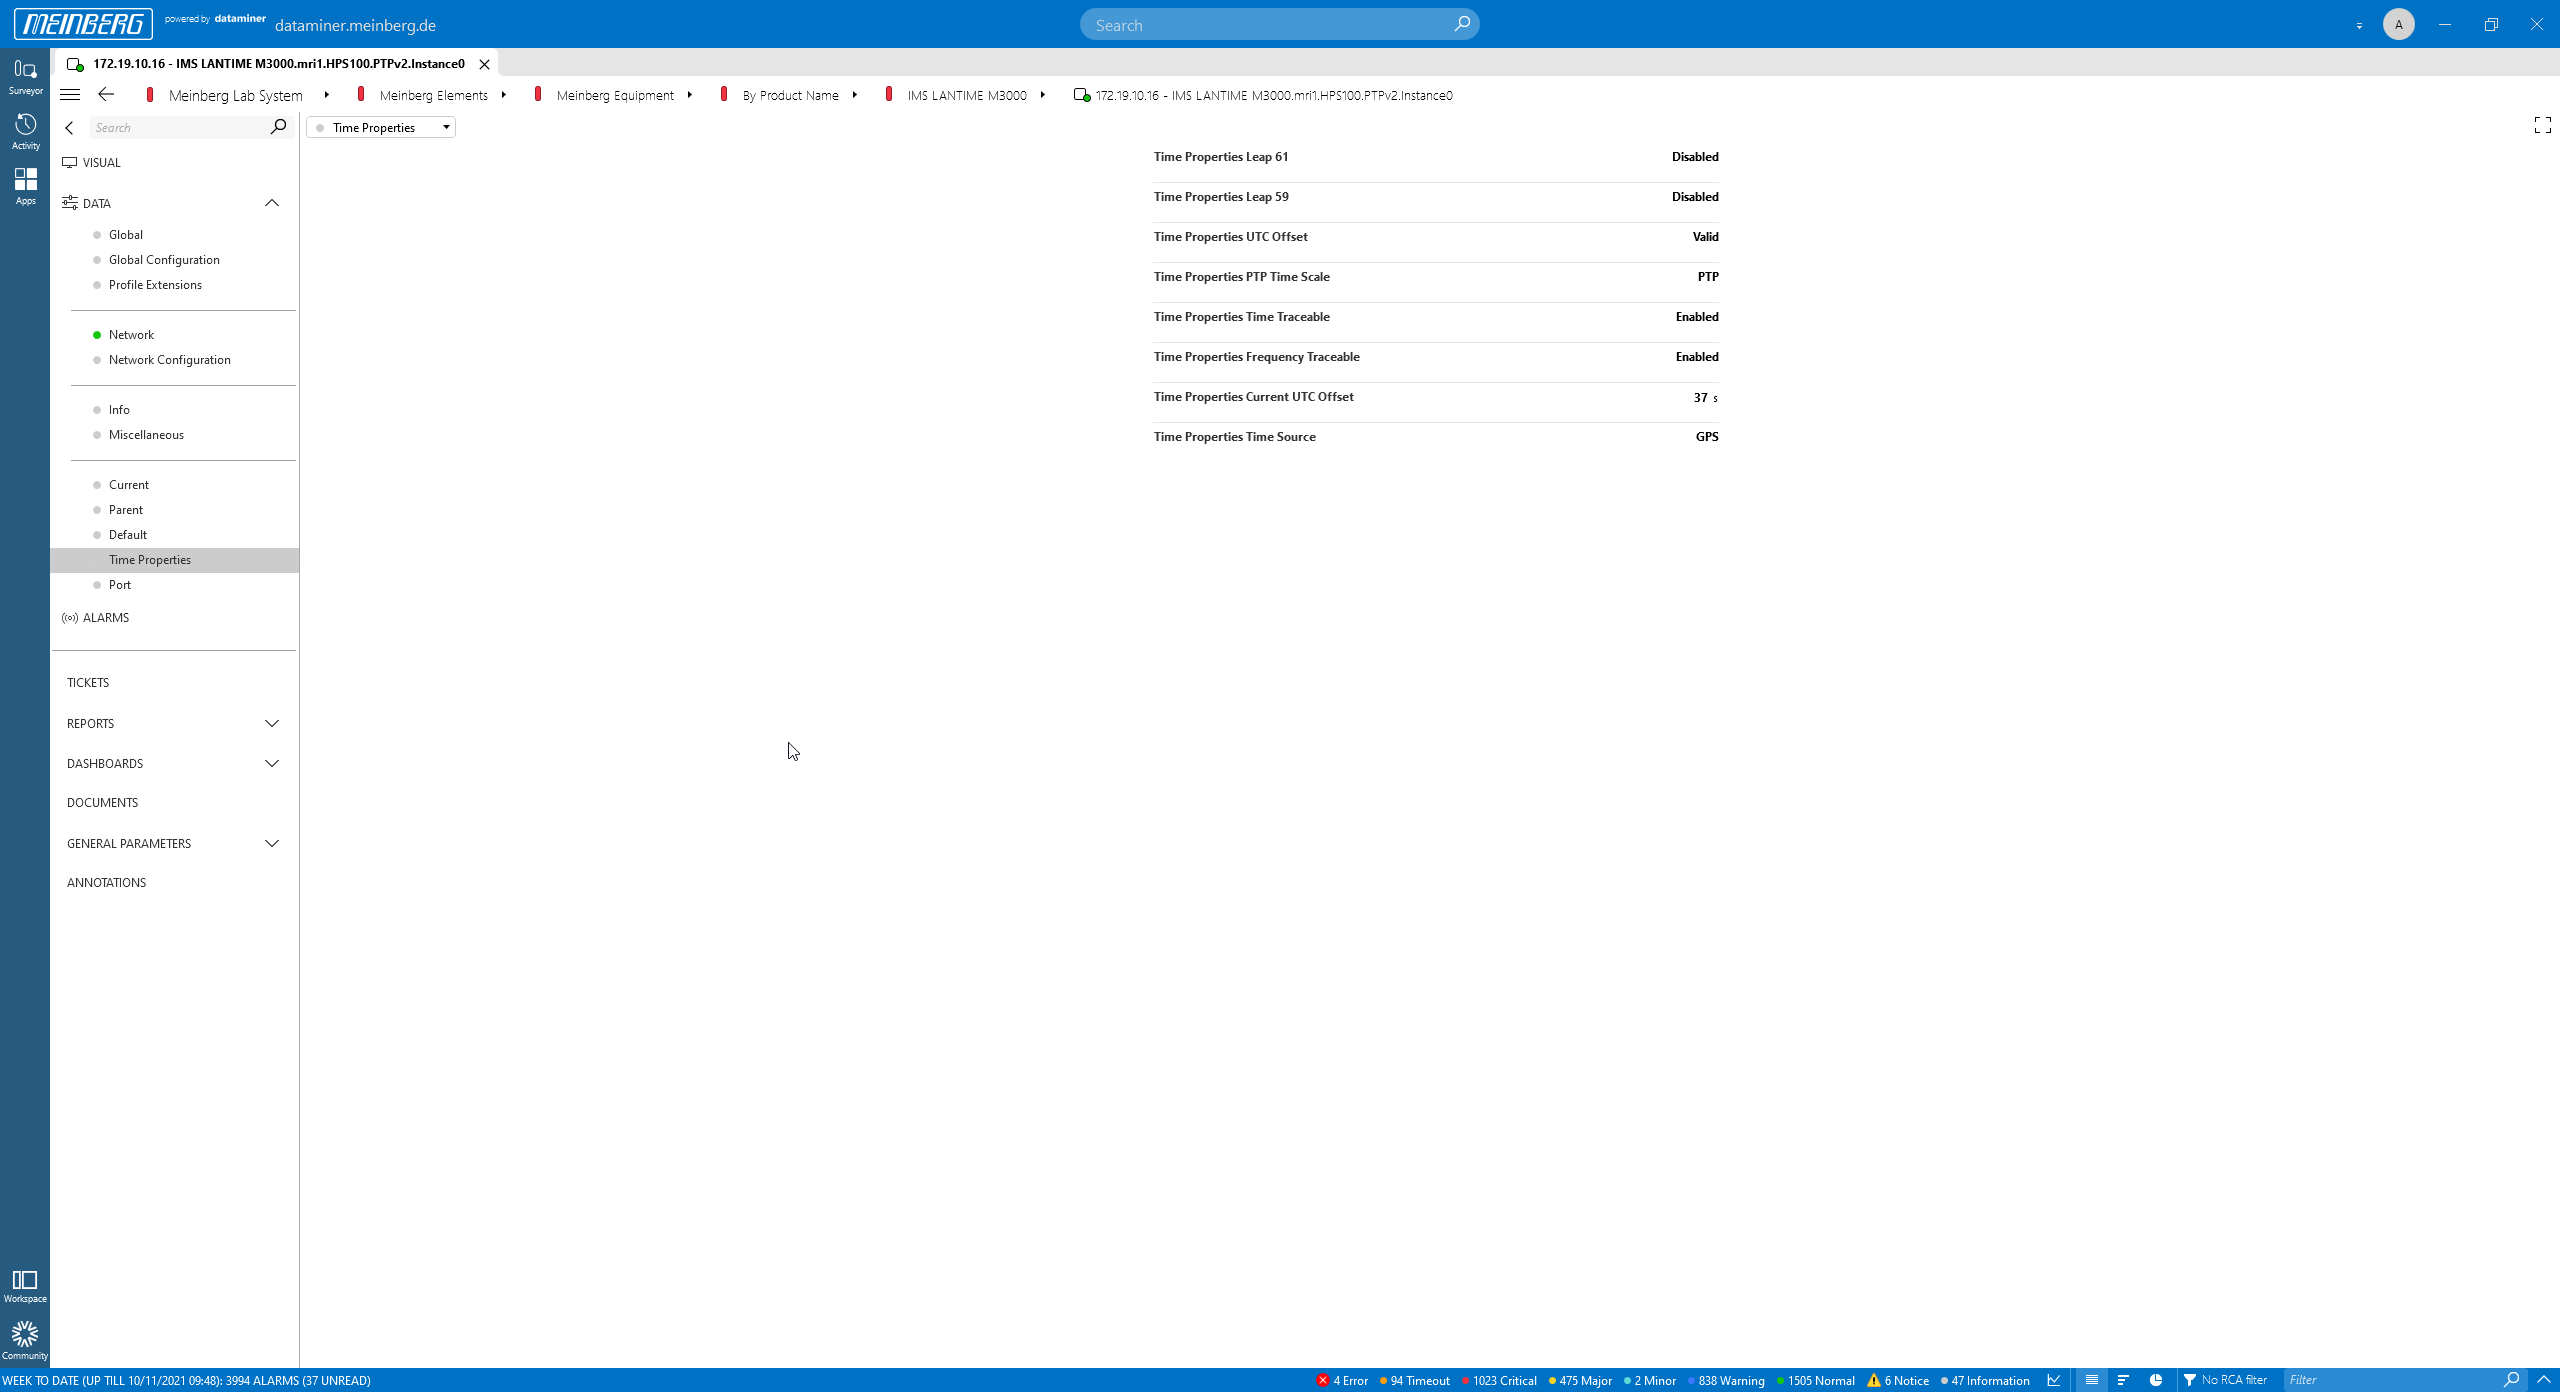 The PTP "Time Properties" page.
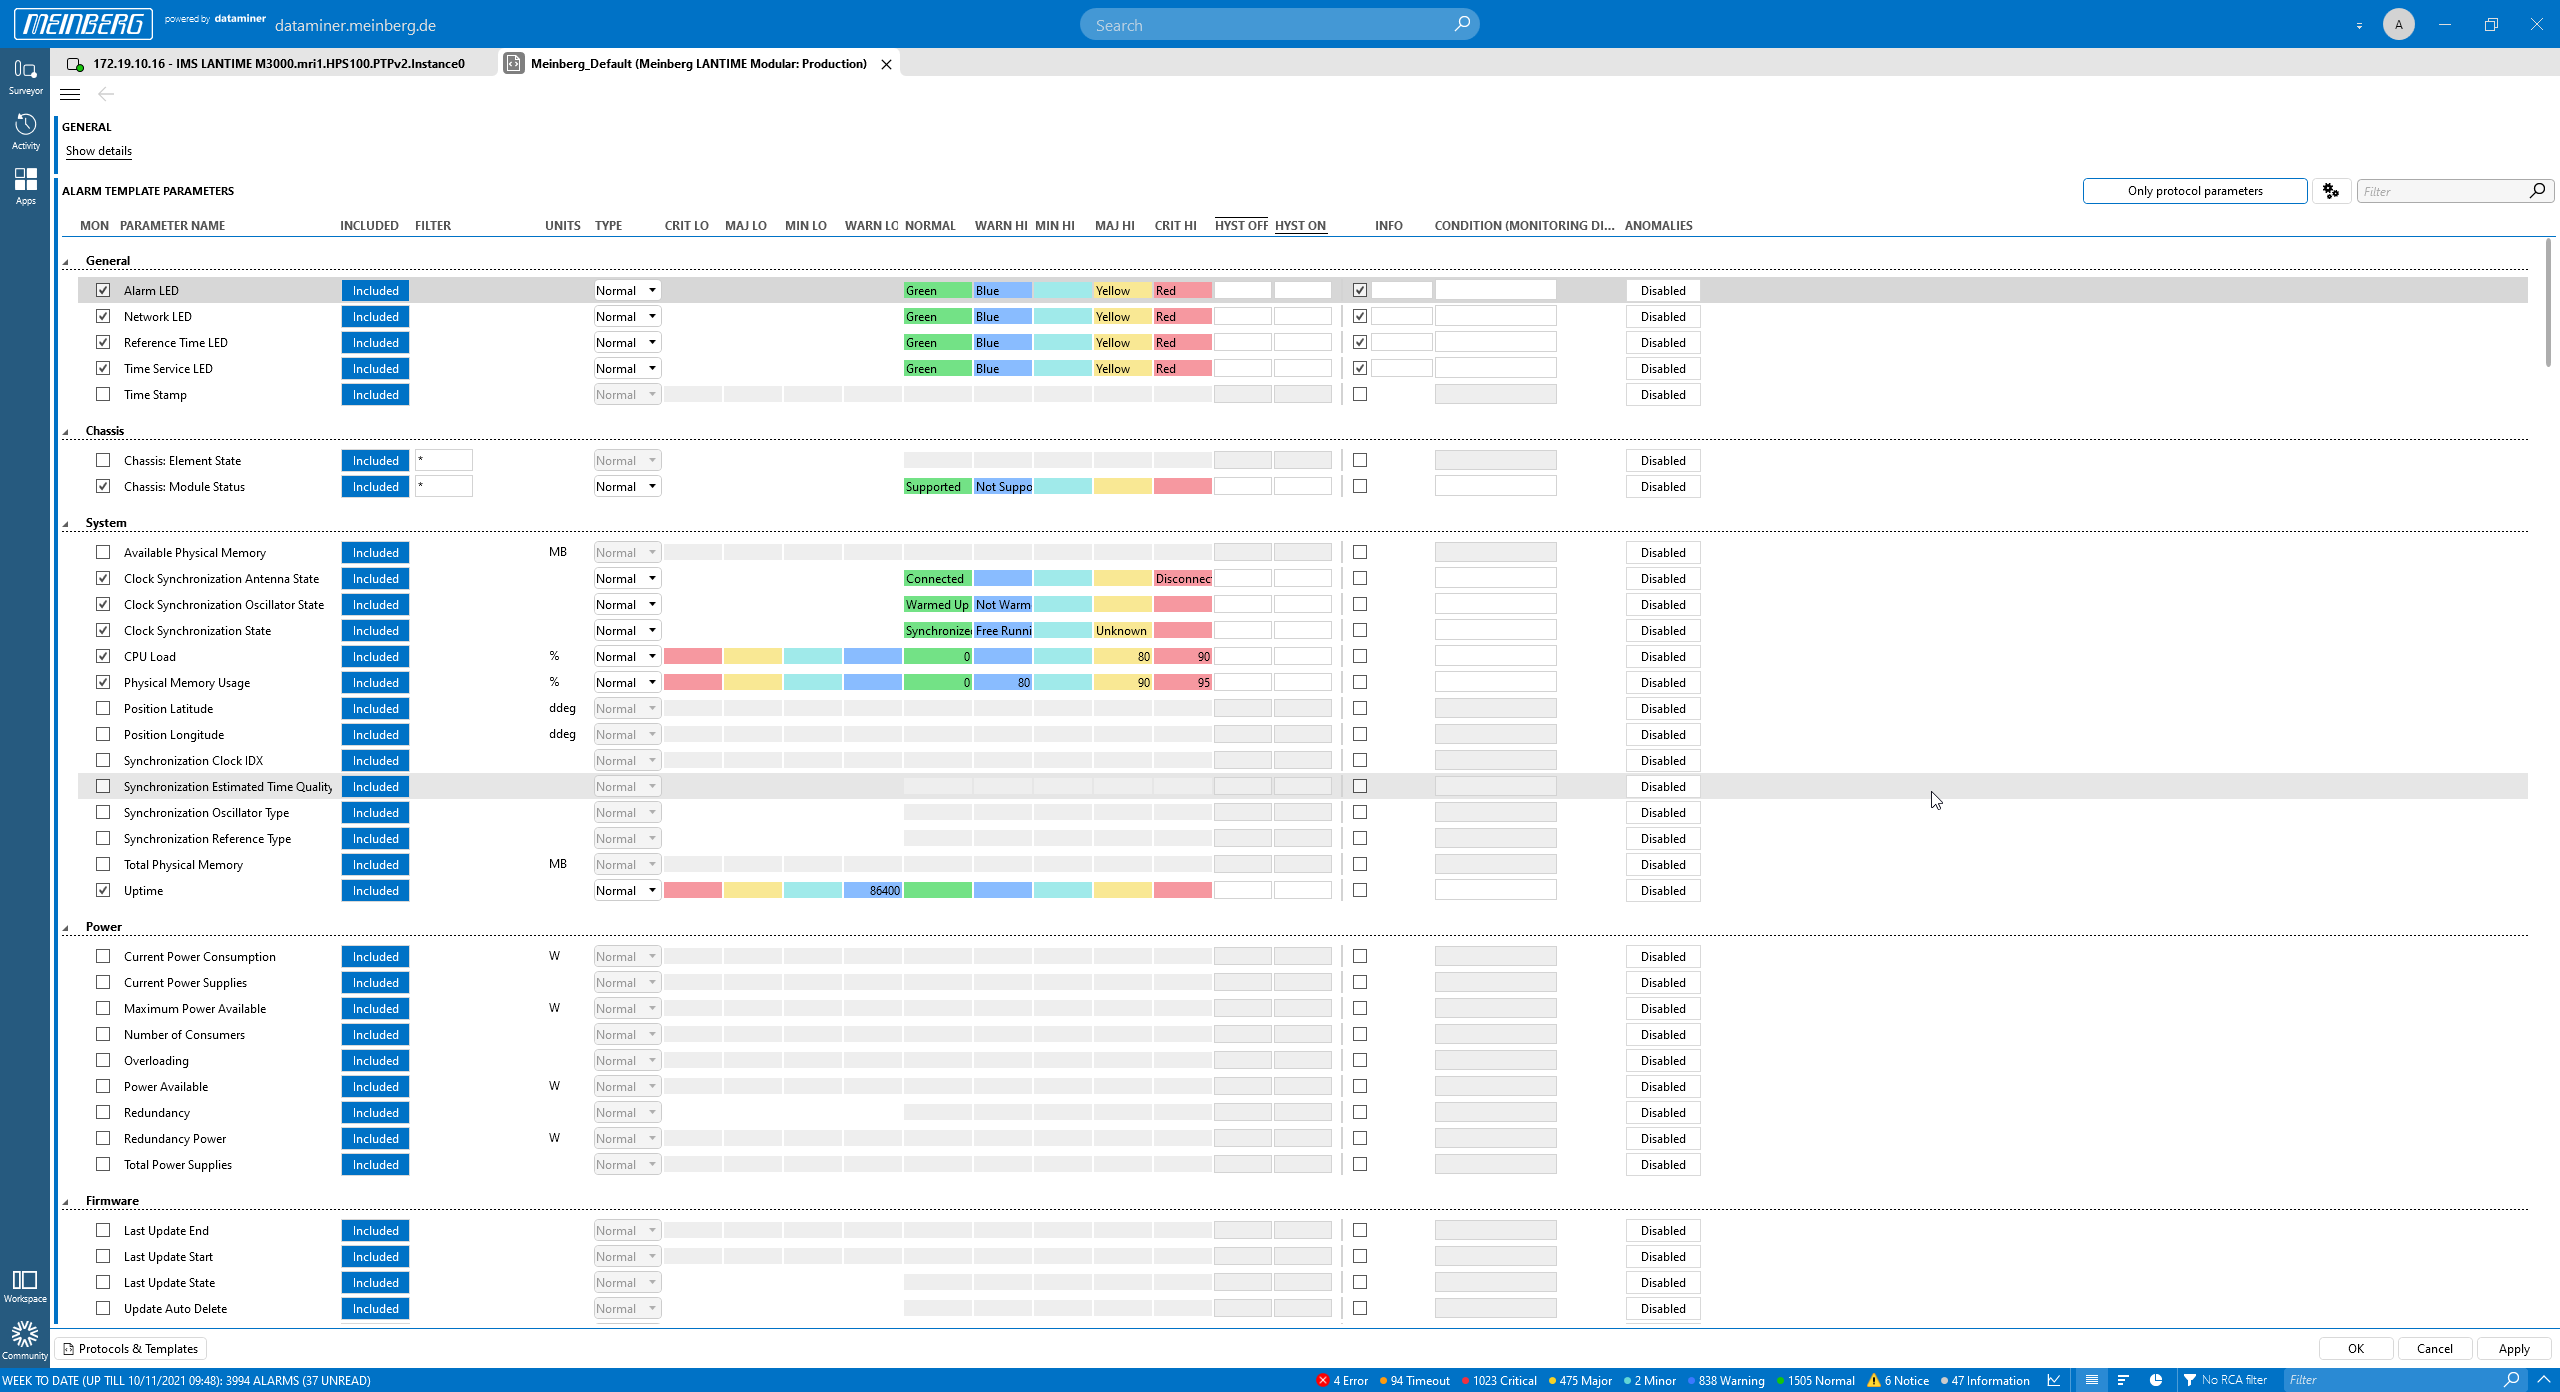 Last but not least, let's have a look at the mbgNMS alarm templates. You can change alarm templates with a few clicks. Everything can be done on the fly.
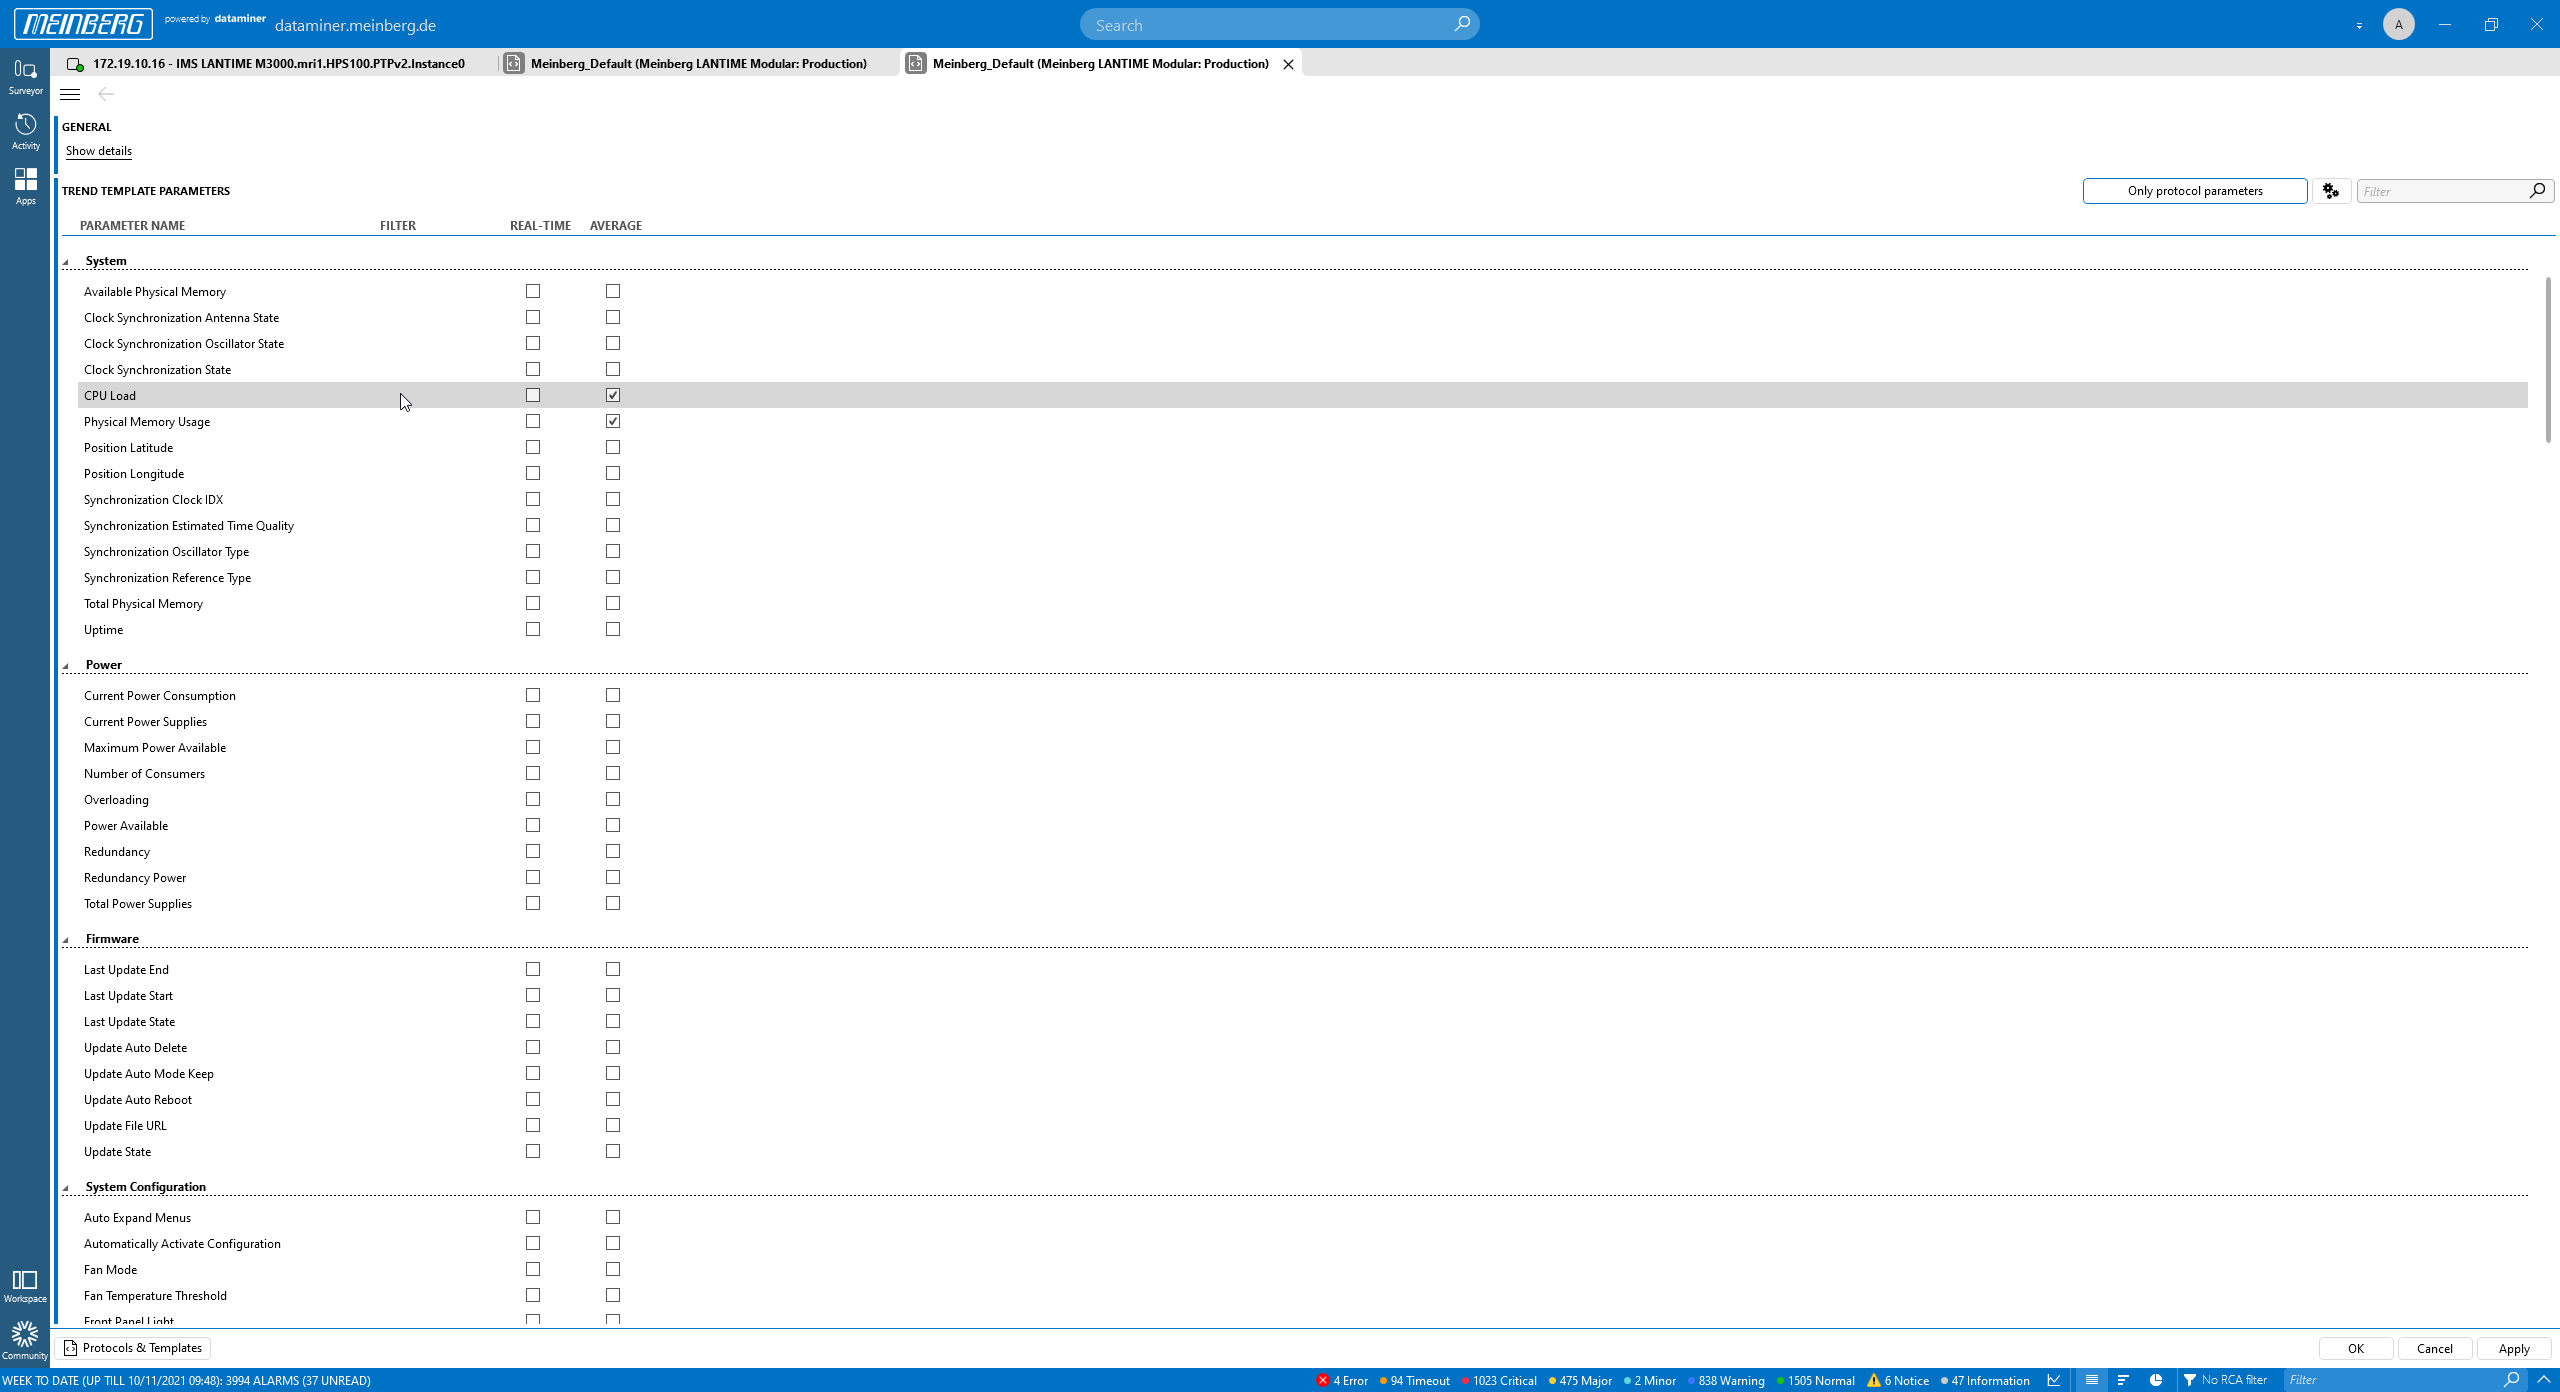 The same goes for trend templates. Simply select the parameters for which you want to measure performance over time. The mbgNMS comes with a a predefined set of templates. At any point in time you can adapt these. The mbgNMS allows you to get started within hours, and at any point in time, you are free to adapt and evolve. Your possibilities are almost endless!