I have a battery graphic that I want the battery capacity to size to match the battery percentage read from the parameter.
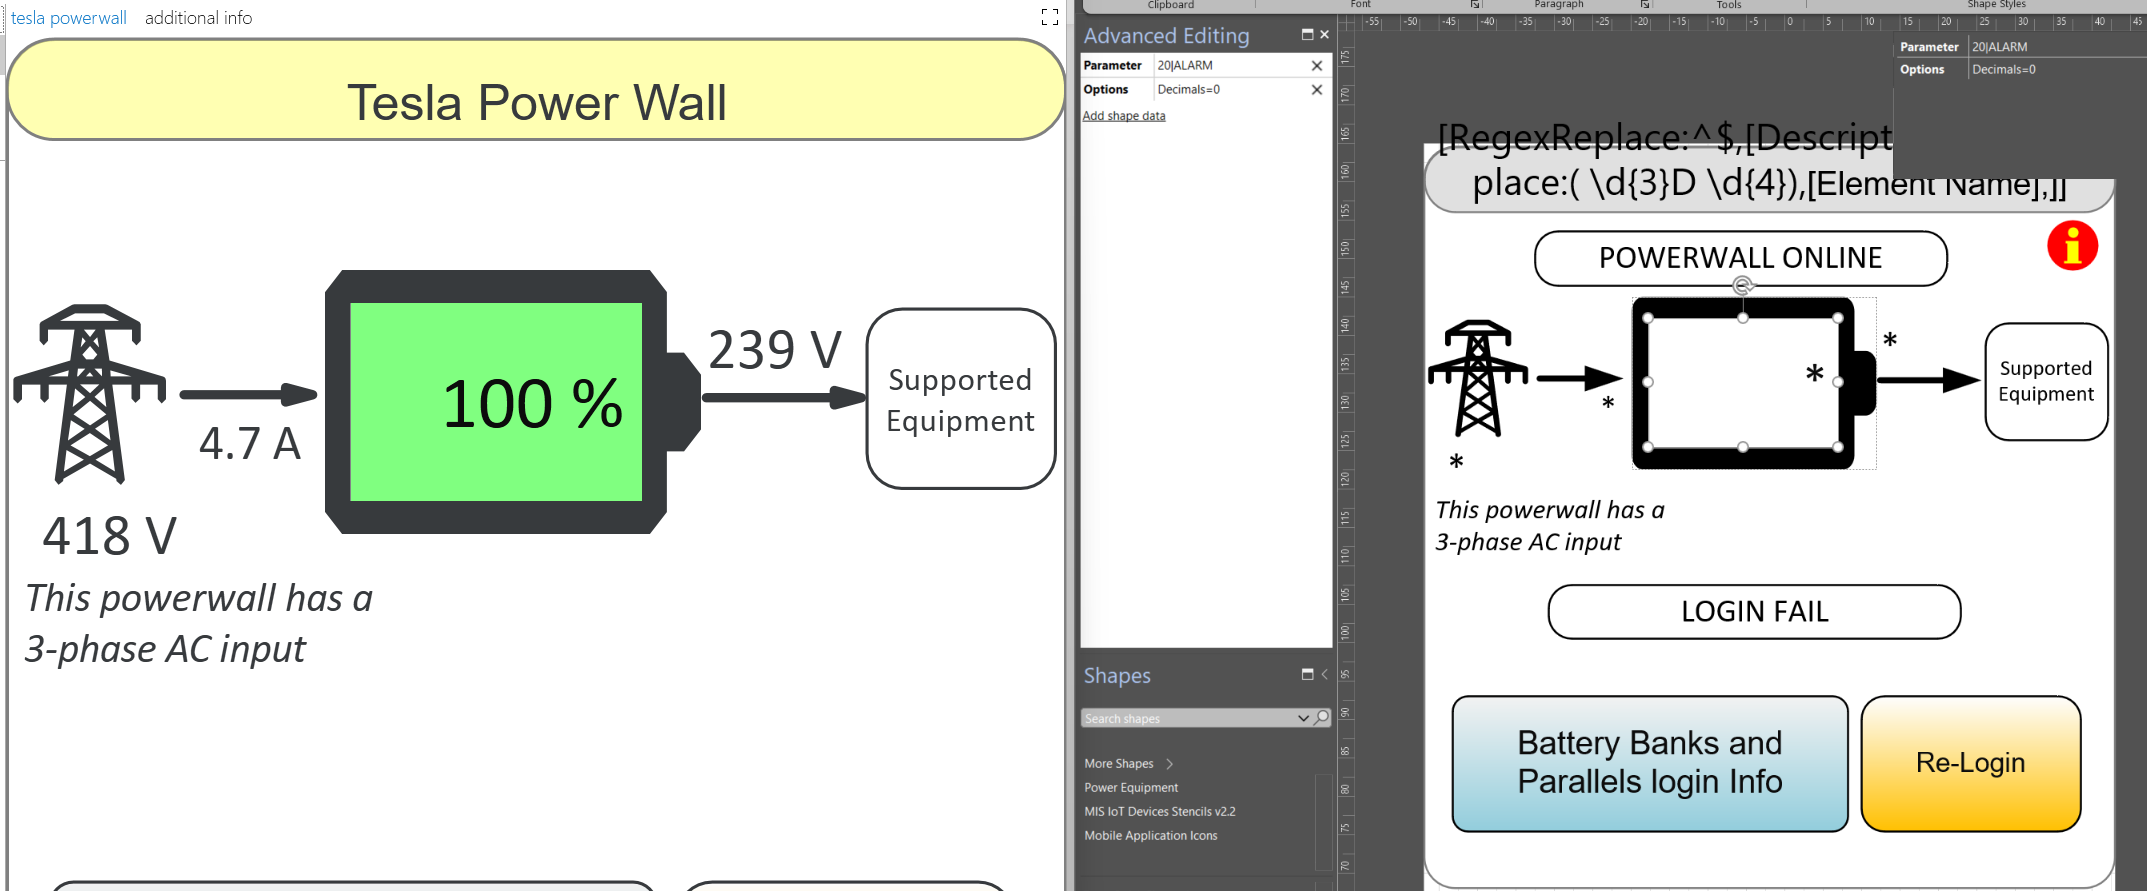
iie: if the battery is 55% charged than the |ALARM colored Parameter box would be 55% the width of the batter shape container.
Reading through the docs I cannot figure out anyway to do this other than to break it down into 5 side by side rectangles and show/hide the set of 5 rectanges based on thresholds 20/40/60/80/100% or similar for example
Before I go down that path is there any way of having a shape width a % of the container or parent shape it is within base on a parameter value?
As this question has now been inactive for a very long time, I will close it. If you still want more information about this, could you post a new question?
Hi Sam,
Another option could be to model this into a dashboard or low-code app (which could also be embedded into the visual overview, if needed). In a dashboard/low-code app, there is an option to color a bar depending on a percentage. 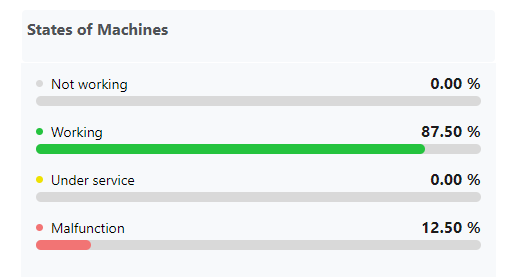
This can be achieved by linking the width of a component on the grid to a parameter
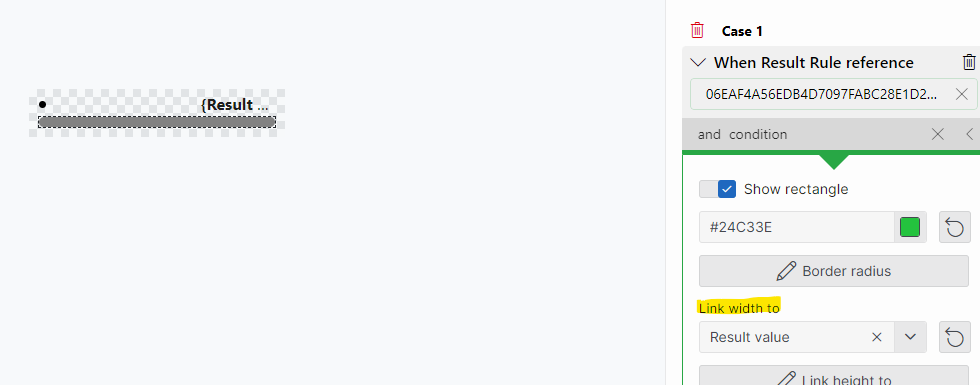
More information on https://docs.dataminer.services/user-guide/Advanced_Modules/Dashboards_and_Low_Code_Apps/Configuring_components/Template_Editor.html#specifying-layer-properties
I see that this question has been inactive for some time. Do you still need help with this? If not, could you select the answer that has been most helpful for you (using the ✓ icon)?