Skip to content
DataMiner DoJo

More results...

Generic selectors
Exact matches only
Search in title
Search in content
Post Type Selectors
Search in posts
Search in pages
Search in posts
Search in pages
Log in
Menu
  • Updates & Insights
  • Questions
  • Learning
    • E-learning Courses
    • Empower Replay: Limited Edition
    • Tutorials
    • Open Classroom Training
    • Certification
      • DataMiner Fundamentals
      • DataMiner Configurator
      • DataMiner Automation
      • Scripts & Connectors Developer: HTTP Basics
      • Scripts & Connectors Developer: SNMP Basics
      • Visual Overview – Level 1
      • Verify a certificate
    • Video Library
    • Books We Like
    • >> Go to DataMiner Docs
  • Expert Center
    • Solutions & Use Cases
      • Solutions
      • Use Case Library
    • Markets & Industries
      • Media production
      • Government & defense
      • Content distribution
      • Service providers
      • Partners
      • OSS/BSS
    • Agile
      • Agile Webspace
      • Everything Agile
        • The Agile Manifesto
        • Best Practices
        • Retro Recipes
      • Methodologies
        • The Scrum Framework
        • Kanban
        • Extreme Programming
      • Roles
        • The Product Owner
        • The Agile Coach
        • The Quality & UX Coach (QX)
    • DataMiner DevOps Professional Program
      • About the DevOps Program
      • DataMiner DevOps Support
  • Downloads
  • More
    • DataMiner Releases & Updates
    • Feature Suggestions
    • Climb the leaderboard!
    • Swag Shop
    • Contact
    • Global Feedback Survey
  • PARTNERS
    • All Partners
    • Technology Partners
    • Strategic Partner Program
    • Deal Registration
  • >> Go to dataminer.services

Trending Future Projected Data

Solved893 views2nd August 2023HTTP trending future data Trending monitoring
3
Chian Hao Aw [SLC] [DevOps Advocate]650 19th July 2023 0 Comments

I am integrating a new API to my connector. The API returns a list of future data entries in 3 hour intervals. I've parsed and recorded them in a table below.

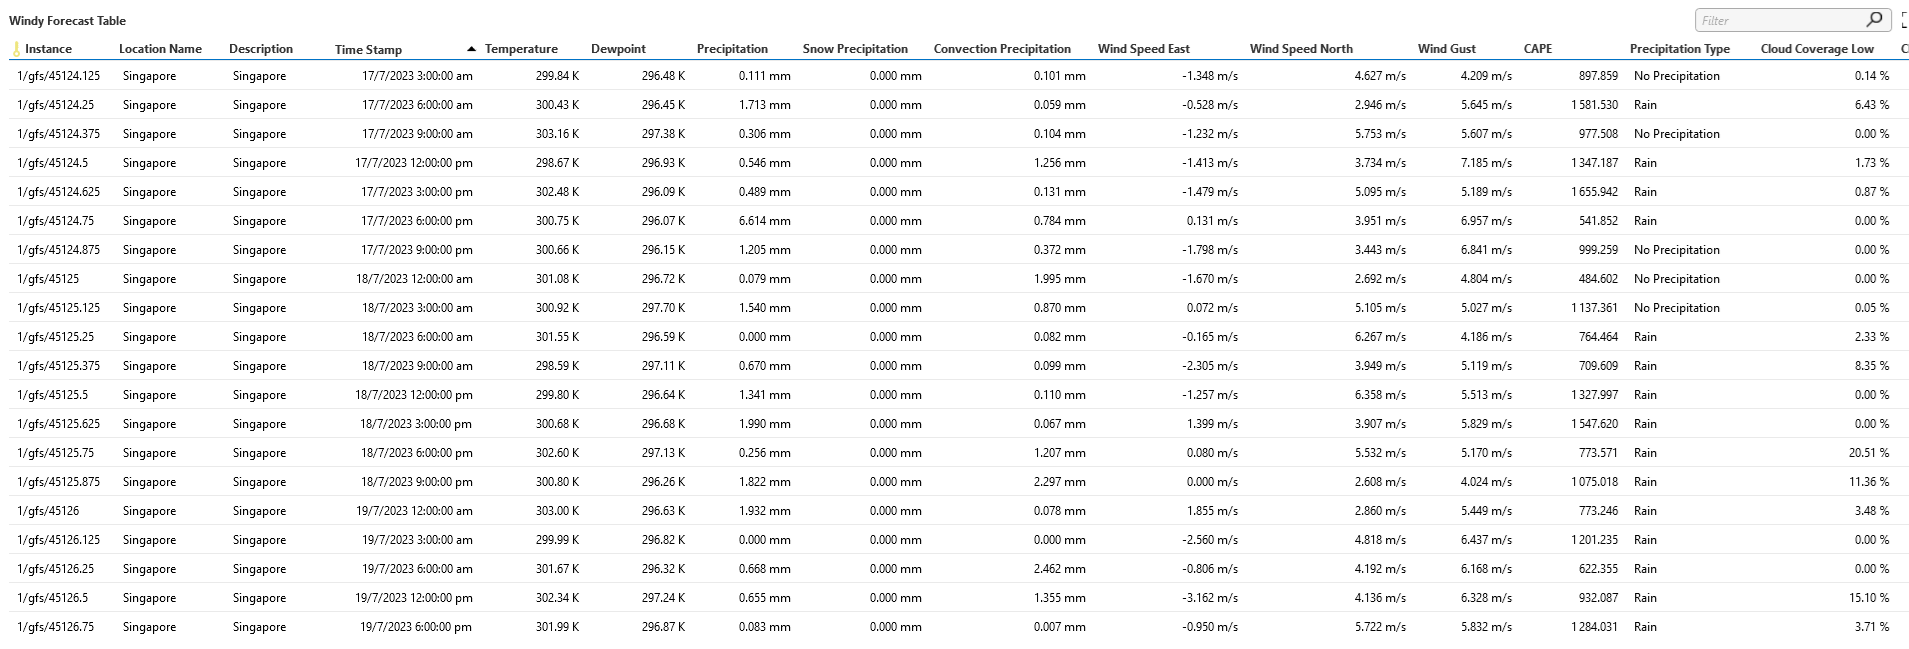
Instead of adding each entry as a row as shown, I would like to update a singular row and trend each column of forecast data to give a graphical view of the projected values of the forecast metrics.

I am having trouble implementing this though as all the data comes at once, and iteratively updating a singular row won't provide the desired results.

DataMiner would be plotting the real-time updates of the table cells instead. I would like to plot the projected data against its given timestamp instead.

I am aware of history setting in a table, but the values are projected so far ahead that I don't think it can support when the protocol updates again after another call to the API.

Could this be implemented in the protocol? Or is there an alternative workaround for this?

Chian Hao Aw [SLC] [DevOps Advocate] Selected answer as best 2nd August 2023

1 Answer

  • Active
  • Voted
  • Newest
  • Oldest
1
Tobe Deprez [SLC] [DevOps Advocate]894 Posted 1st August 2023 0 Comments

I am not aware of a method to do this using a single row in a table. However, if you store the data in multiple rows as you are doing now, you can create a dashboard showing a graph of the relevant metrics with respect to the given time stamp.

To do that, first create a GQI query that fetches both the 'Time Stamp' column and the metric you want to plot by using the 'Get parameter table by ID' and 'Select' operators. Depending on whether your table is already sorted or not, you can then sort on the 'Time Stamp' column.

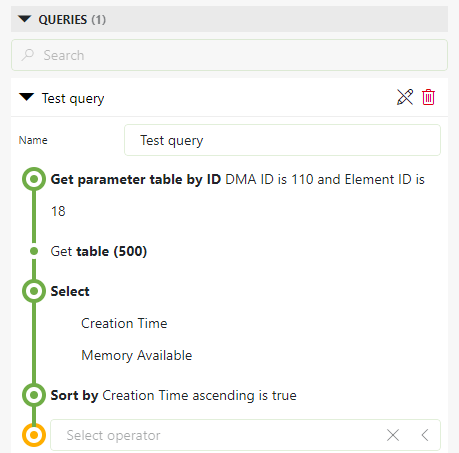
(Note that I am using a different table with different column names in the screenshot above)

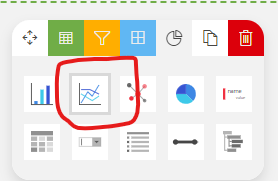
Then drag the query to the dashboard and select the 'Line & area chart visualization.

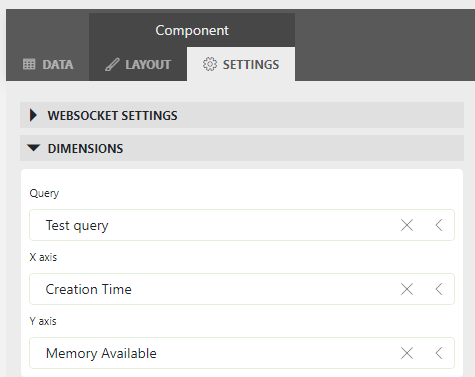
Under Settings -> Dimensions, you can then set the x and y dimensions of your graph.

Chian Hao Aw [SLC] [DevOps Advocate] Selected answer as best 2nd August 2023
You are viewing 1 out of 1 answers, click here to view all answers.
Please login to be able to comment or post an answer.

My DevOps rank

DevOps Members get more insights on their profile page.

My user earnings

0 Dojo credits

Spend your credits in our swag shop.

0 Reputation points

Boost your reputation, climb the leaderboard.

Promo banner DataMiner DevOps Professiona Program
DataMiner Integration Studio (DIS)
Empower Katas
Privacy Policy • Terms & Conditions • Contact

© 2025 Skyline Communications. All rights reserved.

DOJO Q&A widget

Can't find what you need?

? Explore the Q&A DataMiner Docs

[ Placeholder content for popup link ] WordPress Download Manager - Best Download Management Plugin