Is it possible to show the Sum of all the parameters for a saved Trend Graph.
For example if there were 5 parameters that made up the utilization on the Cisco NIC card, could the trend graph show all 5 parameter AND the sum of all 5 giving the total?
Marieke Goethals [SLC] [DevOps Catalyst] Selected answer as best
Paul
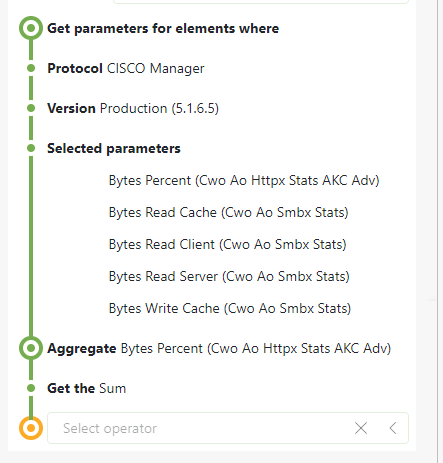
Using GQI on HTML5 dashboards, I am able to do this for one parameter but not for 5 different parameters in one query. Others may have a better solution for this.
Please see the video at DataMiner GQI .
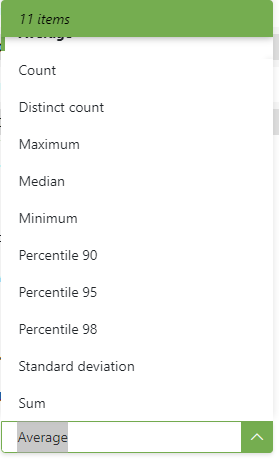
Please see the below screenshots with an example and aggregation methods for what I tried.


Marieke Goethals [SLC] [DevOps Catalyst] Selected answer as best