Skip to content
DataMiner DoJo

More results...

Generic selectors
Exact matches only
Search in title
Search in content
Post Type Selectors
Search in posts
Search in pages
Search in posts
Search in pages
Log in
Menu
  • Updates & Insights
  • Questions
  • Learning
    • E-learning Courses
    • Empower Replay: Limited Edition
    • Tutorials
    • Open Classroom Training
    • Certification
      • DataMiner Fundamentals
      • DataMiner Configurator
      • DataMiner Automation
      • Scripts & Connectors Developer: HTTP Basics
      • Scripts & Connectors Developer: SNMP Basics
      • Visual Overview – Level 1
      • Verify a certificate
    • Video Library
    • Books We Like
    • >> Go to DataMiner Docs
  • Expert Center
    • Solutions & Use Cases
      • Solutions
      • Use Case Library
    • Markets & Industries
      • Media production
      • Government & defense
      • Content distribution
      • Service providers
      • Partners
      • OSS/BSS
    • Agile
      • Agile Webspace
      • Everything Agile
        • The Agile Manifesto
        • Best Practices
        • Retro Recipes
      • Methodologies
        • The Scrum Framework
        • Kanban
        • Extreme Programming
      • Roles
        • The Product Owner
        • The Agile Coach
        • The Quality & UX Coach (QX)
    • DataMiner DevOps Professional Program
      • About the DevOps Program
      • DataMiner DevOps Support
  • Downloads
  • More
    • DataMiner Releases & Updates
    • Feature Suggestions
    • Climb the leaderboard!
    • Swag Shop
    • Contact
      • General Inquiries
    • Global Feedback Survey
  • PARTNERS
    • All Partners
    • Technology Partners
    • Strategic Partner Program
    • Deal Registration
  • >> Go to dataminer.services

Transformation of trend graphs displayed in View

Solved629 views11th December 2023
1
Yuki Arakawa(3496) 荒川 祐貴 [DevOps Advocate]855 8th December 2023 0 Comments

Hi Dojo

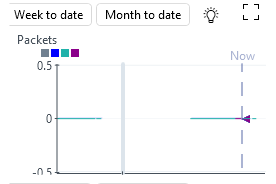
I would like to display a small trend graph in View.
Is there any way to hide the date range buttons?

Also, this parameter starts at 0 and only accumulates.
So no negative value is needed, but can I omit it and make 0 the starting point of the graph?
min=0 did not work.

Yuki Arakawa(3496) 荒川 祐貴 [DevOps Advocate] Selected answer as best 11th December 2023

2 Answers

  • Active
  • Voted
  • Newest
  • Oldest
2
Vikas Choudhary [DevOps Member]556 Posted 8th December 2023 2 Comments

Hello Yuki,

My understating is below, Dojo Community please correct me if I'm wrong here.

From DataMiner 10.3.3/10.4.0 onwards, the Show average, Show minimum, and Show maximum settings are also taken into account when you export a chart to CSV. In addition, if the Show min/max shading option is enabled, minimum and maximum values will always be taken into account in the export. I think you have to write c# code while ingesting data in to graph. you need to set value 0 if it's negative value.

Regarding Date Filter, I think you can create a dashboard and add trend graph for your element & parameter. Please follow the steps mentioned below.

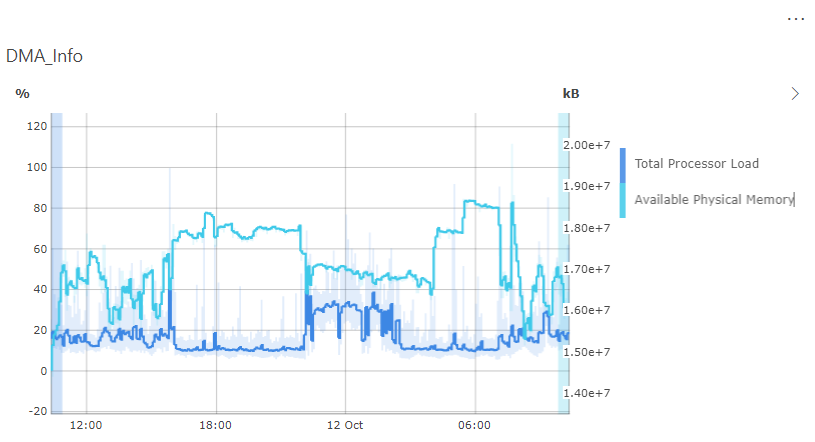
To add a component to a dashboard to show a basic trend graph with several DMA KPIs:

  1. In edit mode, drag the Line & area chart visualization to the dashboard.
  2. Click the  icon to filter the available data in the data pane.
  3. Expand the Parameters section in the data pane and specify the element representing the DMA in the Element box.
  4. Select a parameter you want to display in the graph, and drag it to the graph. Repeat this for each parameter that should be displayed in the graph.TIP
    Select the Trended checkbox at the top of the Parameters section to only view parameters for which trending is enabled. Depending on your DataMiner version, you may need to select the filter icon first.


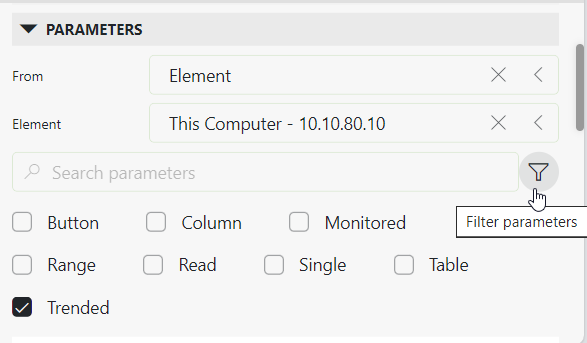
    Parameters section with filter in DataMiner 10.3.11

  5. In the Settings tab, in the Group by box, select Element. This way all KPIs will be shown in the same graph.

https://docs.dataminer.services/user-guide/Advanced_Modules/Dashboards_and_Low_Code_Apps/Visualizations/Available_visualizations/Charts/Line_and_area_chart.html

Sebastiaan Dumoulein [SLC] [DevOps Enabler] Posted new comment 15th December 2023
Yuki Arakawa(3496) 荒川 祐貴 [DevOps Advocate] commented 11th December 2023

Yes, I too know that using the dashboard is the solution to the problem.
But I also know that access using a web browser does not allow all Dataminer operations.

Assume an actual monitoring operation.
Operators do not switch between Cube and browser every times.

They will not open a browser just to monitor the accumulation in a graph.

I hope that the dashboard graphs will also be available in Cube.

Sebastiaan Dumoulein [SLC] [DevOps Enabler] commented 15th December 2023

Note that you can embed dashboards in the Visual Overview using https://docs.dataminer.services/user-guide/Advanced_Modules/Dashboards_and_Low_Code_Apps/Dashboards_app/Creating_and_configuring_dashboards/Embedding_a_dashboard_component_in_a_webpage_or_Visio_drawing.html?q=embeddashboard

You are viewing 1 out of 2 answers, click here to view all answers.
Please login to be able to comment or post an answer.

My DevOps rank

DevOps Members get more insights on their profile page.

My user earnings

0 Dojo credits

Spend your credits in our swag shop.

0 Reputation points

Boost your reputation, climb the leaderboard.

Promo banner DataMiner DevOps Professiona Program
DataMiner Integration Studio (DIS)
Empower Katas
Privacy Policy • Terms & Conditions • Contact

© 2025 Skyline Communications. All rights reserved.

DOJO Q&A widget

Can't find what you need?

? Explore the Q&A DataMiner Docs

[ Placeholder content for popup link ] WordPress Download Manager - Best Download Management Plugin