Skip to content
DataMiner DoJo

More results...

Generic selectors
Exact matches only
Search in title
Search in content
Post Type Selectors
Search in posts
Search in pages
Search in posts
Search in pages
Log in
Menu
  • Updates & Insights
  • Questions
  • Learning
    • E-learning Courses
    • Empower Replay: Limited Edition
    • Tutorials
    • Open Classroom Training
    • Agility
      • Kanban workshop
      • Agile Fundamentals
    • Certification
      • DataMiner Fundamentals
      • DataMiner Configurator
      • DataMiner Automation
      • Scripts & Connectors Developer: HTTP Basics
      • Scripts & Connectors Developer: SNMP Basics
      • Visual Overview – Level 1
      • Verify a certificate
    • Video Library
    • Books We Like
    • >> Go to DataMiner Docs
  • Expert Center
    • Solutions & Use Cases
      • Solutions
      • Use Case Library
    • Markets & Industries
      • Media production
      • Government & defense
      • Content distribution
      • Service providers
      • Partners
      • OSS/BSS
    • Agile
      • Agile Webspace
      • Everything Agile
        • The Agile Manifesto
        • Best Practices
        • Retro Recipes
      • Methodologies
        • The Scrum Framework
        • Kanban
        • Extreme Programming
      • Roles
        • The Product Owner
        • The Agile Coach
        • The Quality & UX Coach (QX)
    • DataMiner DevOps Professional Program
      • About the DevOps Program
      • DataMiner DevOps Support
  • Downloads
  • More
    • Feature Suggestions
    • Climb the leaderboard!
    • Swag Shop
    • Contact
    • Global Feedback Survey
  • Support
  • PARTNERS
    • All Partners
    • Technology Partners
    • Strategic Partner Program
    • Deal Registration
  • >> Go to dataminer.services

Taking values from Spectrum Traces

Solved1.45K views14th July 2023spectrum spectrum analyzer Visio
1
Yohan Silva [DevOps Advocate]166 12th May 2022 0 Comments

Hello guys,

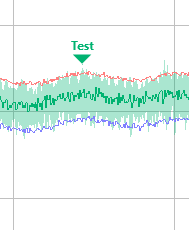
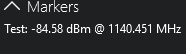
How can we get the value of the Peak from spectrum trace? I looked on the protocol parameters, and I did not find any place where this value is "saved"; Our goal is getting this value of attenuation - as on the "Test" marker at the image - to show it in a visio drawing.


Kind regards,
Yohan

Marieke Goethals [SLC] [DevOps Catalyst] Selected answer as best 14th July 2023

2 Answers

  • Active
  • Voted
  • Newest
  • Oldest
0
Yohan Silva [DevOps Advocate]166 Posted 6th June 2022 0 Comments

Hello, Ben!
Thank you by the support, it was helpful and now the scripts are properly configured to retrieve the amplitude peak. Now, we are trying to show this value in a visio as a parameter, but it is not working... on this attempt the spectrum is being embedded on place of the parameter we want. Do you have any recommendation to how retrieve this information on visio? As I said, it is a variable from spectrum script executed every 30 seconds.

Regards,
Yohan

Yohan Silva [DevOps Advocate] Answered question 6th June 2022
You are viewing 1 out of 2 answers, click here to view all answers.
Please login to be able to comment or post an answer.

My DevOps rank

DevOps Members get more insights on their profile page.

My user earnings

0 Dojo credits

Spend your credits in our swag shop.

0 Reputation points

Boost your reputation, climb the leaderboard.

Promo banner DataMiner DevOps Professiona Program
DataMiner Integration Studio (DIS)
Empower Katas
Privacy Policy • Terms & Conditions • Contact

© 2025 Skyline Communications. All rights reserved.

DOJO Q&A widget

Can't find what you need?

? Explore the Q&A DataMiner Docs

[ Placeholder content for popup link ] WordPress Download Manager - Best Download Management Plugin