Skip to content
DataMiner DoJo

More results...

Generic selectors
Exact matches only
Search in title
Search in content
Post Type Selectors
Search in posts
Search in pages
Search in posts
Search in pages
Log in
Menu
  • Blog
  • Questions
  • Learning
    • E-learning Courses
    • Empower Replay: Limited Edition
    • Tutorials
    • Open Classroom Training
    • Certification
      • DataMiner Fundamentals
      • DataMiner Configurator
      • DataMiner Automation
      • Scripts & Connectors Developer: HTTP Basics
      • Scripts & Connectors Developer: SNMP Basics
      • Visual Overview – Level 1
      • Verify a certificate
    • Video Library
    • Books We Like
    • >> Go to DataMiner Docs
  • Expert Center
    • Solutions & Use Cases
      • Solutions
      • Use Case Library
    • Markets & Industries
      • Media production
      • Government & defense
      • Content distribution
      • Service providers
      • Partners
      • OSS/BSS
    • DataMiner Insights
      • Security
      • System Architecture
      • DataMiner Releases & Updates
    • Agile
      • Agile Webspace
      • Everything Agile
        • The Agile Manifesto
        • Best Practices
        • Retro Recipes
      • Methodologies
        • The Scrum Framework
        • Kanban
        • Extreme Programming
      • Roles
        • The Product Owner
        • The Agile Coach
        • The Quality & UX Coach (QX)
    • DataMiner DevOps Professional Program
  • Downloads
  • More
    • Feature Suggestions
    • Climb the leaderboard!
    • Swag Shop
    • Contact
      • General Inquiries
      • DataMiner DevOps Support
      • Commercial Requests
    • Global Feedback Survey
  • PARTNERS
    • All Partners
    • Technology Partners
    • Strategic Partner Program
    • Deal Registration
  • >> Go to dataminer.services

Spectrum thumbnail in Visio

Solved852 views12th July 2023spectrum analyzer Visio
1
Yohan Silva [DevOps Advocate]166 1st September 2022 0 Comments

Hello Dojo,

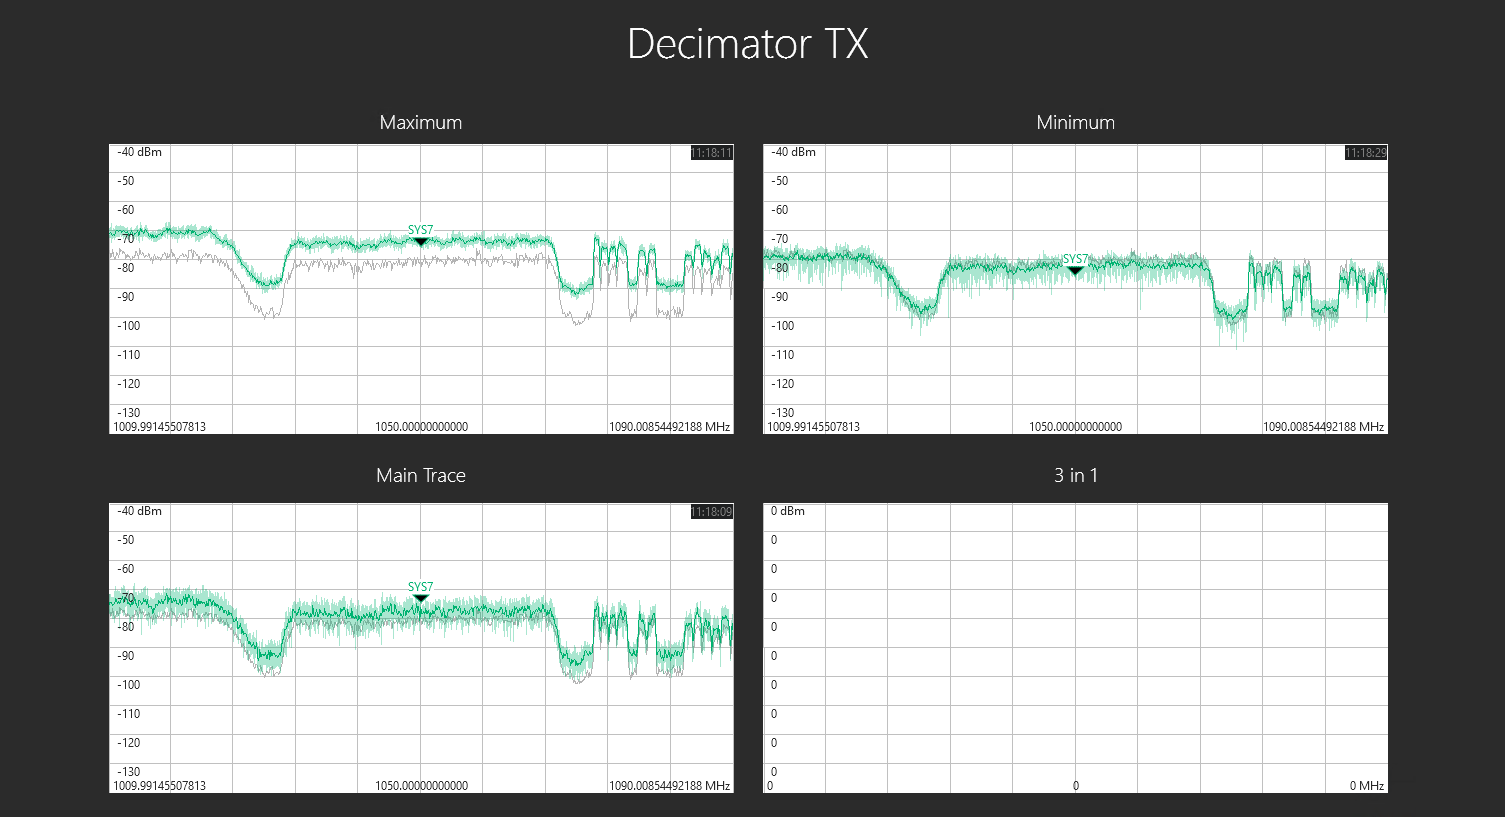
We managed the spectrum analyzer script to get three different traces from the same input: main trace, maximum hold and minimum hold.

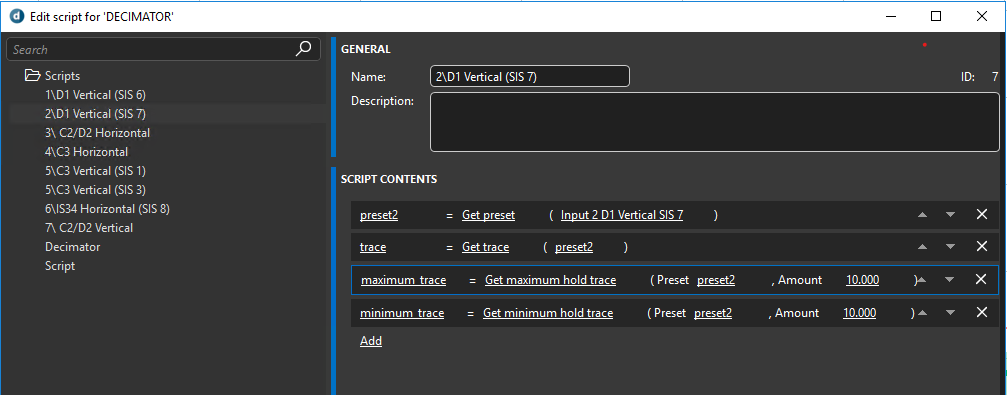
Is it possible to "mix" them 3 in 1 visio thumbnail just as it is shown on the spectrum analyzer?

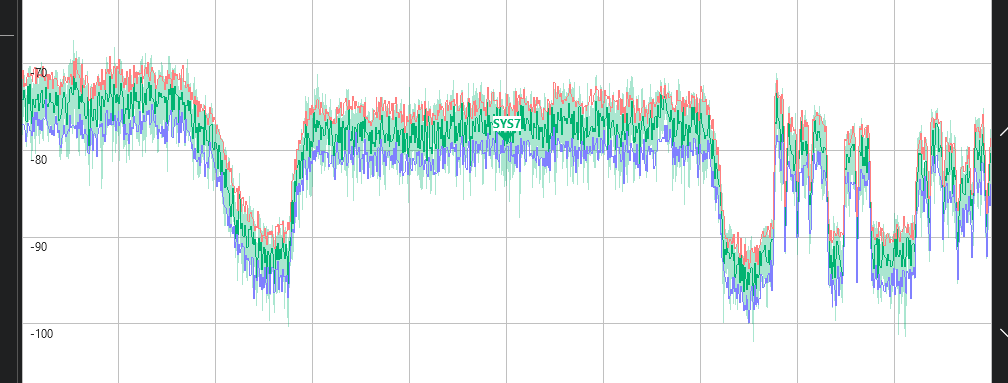
Please find evidences attached.

Regards,
Yohan

Marieke Goethals [SLC] [DevOps Catalyst] Selected answer as best 12th July 2023

1 Answer

  • Active
  • Voted
  • Newest
  • Oldest
1
Masschelein Karl [SLC]180 Posted 2nd September 2022 0 Comments

Hello Yohan,

Unfortunately this visio spectrum thumbnail feature doesn't exist yet. See available 'SpectrumOptions' on DataMinerDocs. Feel free to suggest a new feature request.

In case the visio setup has only few spectrum visualisations, you might consider using an embedded Spectrum Analysis component. Do note that this uses an extra spectrum session handling real live spectrum trace updating in the same way a regular spectrum element card does.

Kind regards,

Marieke Goethals [SLC] [DevOps Catalyst] Selected answer as best 12th July 2023
You are viewing 1 out of 1 answers, click here to view all answers.
Please login to be able to comment or post an answer.

My DevOps rank

DevOps Members get more insights on their profile page.

My user earnings

0 Dojo credits

Spend your credits in our swag shop.

0 Reputation points

Boost your reputation, climb the leaderboard.

Promo banner DataMiner DevOps Professiona Program
DataMiner Integration Studio (DIS)
Empower Katas
Privacy Policy • Terms & Conditions • Contact

© 2025 Skyline Communications. All rights reserved.

DOJO Q&A widget

Can't find what you need?

? Explore the Q&A DataMiner Docs

[ Placeholder content for popup link ] WordPress Download Manager - Best Download Management Plugin