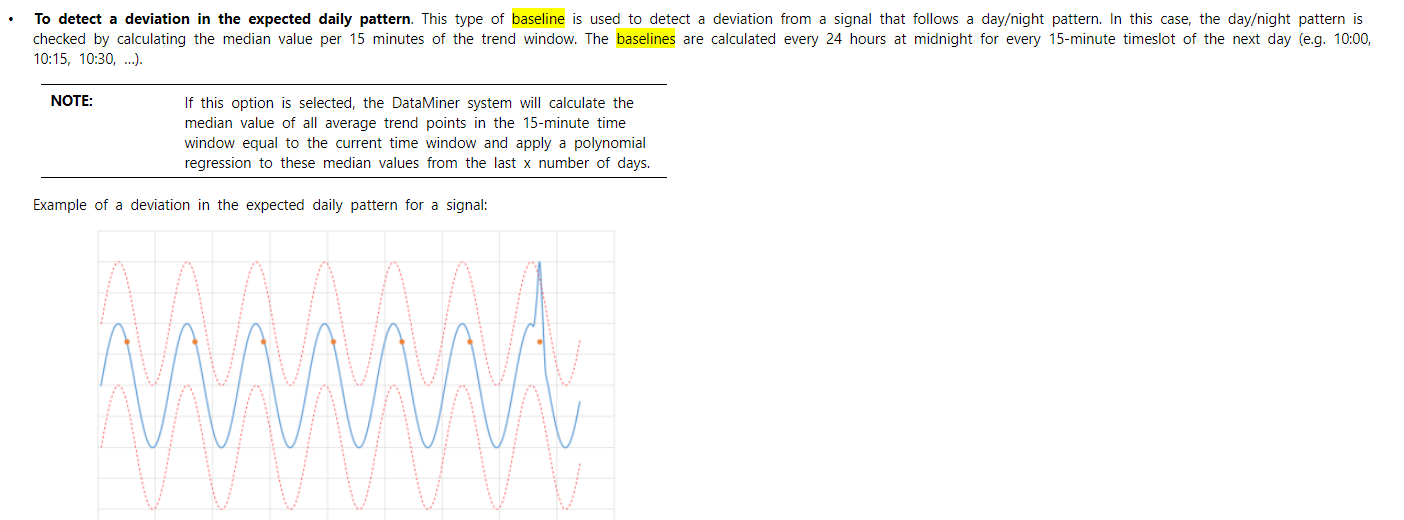
Hi,
If we need to verify the internal calculations done by Dataminer when determining the smart baseline value for a given parameter, specially for the option 'daily pattern deviation', what do we need to do?
The Help states that with the averaged 15-minutes trend points, a polynomial regression is applied. What is the polynomial degree? Applied to which points exactly? When is then the smart baseline read from the polynomial function?
Would it be possible to describe the complete algorithm so we can compute the expected values ourselves having as an input just the trending values of the respective parameter?
Thanks in advance.
Hello Paulo,
I opened the code and investigated how the smart baseline is calculated in the case of a daily pattern deviation, assuming you do not select “handle weekend days separately”.
The first thing to note is that a day consists of 288 five minute intervals, namely 0h00 until 0h05, 0h05 until 0h10,….,23h55 until 0h. For each of these intervals, the algorithm tries to figure out the typical value of the parameter during that interval. To do this, the algorithm fetches the last week of 5’ averages from the database. Then, for each of the aforementioned five minute intervals, it checks the value of the parameter during that interval on Monday, Tuesday,… Sunday and it takes the median M of these 7 values.
After this, we are left with the following information:
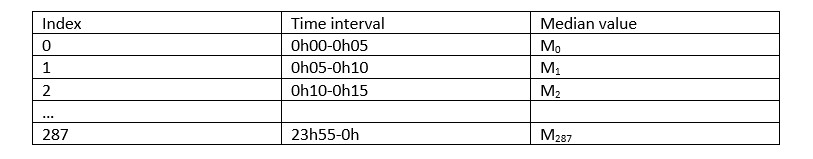
Every 15 minutes, DataMiner will check which baseline value to use for the upcoming 15 minutes. In order to this, we could just use this table. So, if during the interval 0h10-0h15, DataMiner wants to check which baseline it should use for the upcoming 15 minutes, just use M2 as the baseline. The downside of this method however is that keeping this table requires some memory, definitely for systems that have many parameters with smart baseline enabled. This is why the algorithm is going to try and summarize the information in this table by doing a polynomial regression of degree 8.
To explain this (I know you know Paulo, but for anybody else reading this), let me note that a polynomial of degree 8 is a function described by 9 numbers

which maps any number t to

Ideally, what we would like is to find the 9 coefficients a in such a way that when you fill in an index t=i, that

equals the i'th median Mi. If you can do that, then you don’t have to remember all the median values M anymore (this saves memory) and you can just remember the 9 coefficients instead.
Unfortunately, in most cases this is not possible, so instead the algorithm is going to try to find the a’s in such a way that P(i) is as good of an approximation as possible for the i'th median Mi.
The above procedure (fetching a week of data and calculating the aj) is repeated once per day for each parameter with a smart baseline enabled, typically around midnight.
Apart from that, every 15 minutes, DataMiner will calculate which baseline value to use for the next 15 minutes. So, assume, it was now 15’ ago since our last calculation. Then DataMiner does the following:
1) Look at the current time: what is the corresponding index i?
e.g. if it is 10h02, it lies in the interval 10h until 10h05 which has index i=120.
2) As a baseline, use the number P(i)
e.g. at 10h02, DataMiner will use P(120) as baseline value to decide when to trigger alarms.
I hope this explanation clarifies how the smart baseline works. If you have any further questions, please don’t hesitate to reach out!
Regarding the pictures you posted, thank you, Paulo, for sending me the datasets. I will look into these today and get back to you.
Thank you Dennis for the detailed explanation of the algorithm.
Using an 8th degree polynomial to fit a curve that has 288 different values is a bit optimistic, to say the least. Basically, you are trying to approximate the daily pattern curve with a polynomial function of only degree 8 which it may work well for regular and slow changing patterns, but for irregular and the ones changing the value very quickly, the result will be far away from the intended. I believe there is a lot of room to improve here in these calculations of the smart baselines.