Hi, a user has the following use case for SLA:
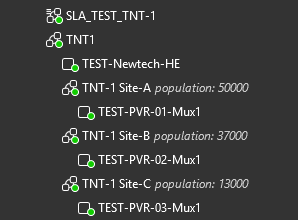
A single SLA (SLA_TEST_TNT-1) to keep track of availability of a single service (TNT1)
- A critical alarm raised by TEST-Newtech-HE will impact the SLA by 100%
- A critical alarm raised by TEST-PVR-01-Mux1 will impact the SLA by 50%
- A critical alarm raised by TEST-PVR-02-Mux1 will impact the SLA by 37%
- A critical alarm raised by TEST-PVR-03-Mux1 will impact the SLA by 13%

We have attempted to configure and test out a few Violation configurations but each time, the elements in the child services (TNT101 Site-X) will contribute 100% impact to SLA.
For example, the expected outcome of the following config should be that TEST-PVR-01-Mux1 will impact the SLA by 50% but we observe that the impact is still 100%.

Any guidance to configure an SLA to meet the above use case would be much appreciated.
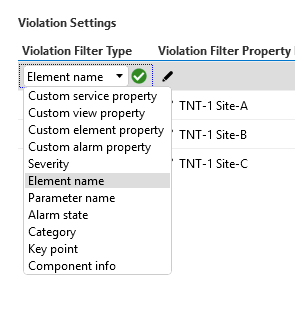
Updated question with additional info: The following are options for Violation Filter Type:

Hi Bing,
The Filters are being processed one by one in the table. As the element “TEST-PVR-01-Mux1” is not an element directly under the service view, I don’t think it will match the filter in your table. As there is no matching filter, it will impact 100% (Violation Filter Exclusive is Continue for all).
Is there an option to filter on the service “TNT-1 Site-A”?
Any reason why the elements can’t be included directly in the service?
Otherwise, you might want to ask for a new feature that enables you to filter on services as well.
Thanks. We’ll consider those options Michiel.
An update here. The root cause of why the expected entries were not taking effect was due to the use of the same value in the ‘Violation Filter Sequence’ column. When doing so, it appears that the entry with the lowest Violation Filter Id only takes effect, even when it is ‘Disabled’.
Hi Bing,
Can it be that you use an alias for the included elements in your service?
You can verify the actual element name that the SLA receives (and filters on) in the “Current Active Service Alarm Element” column on the “Active Service Alarms” page.
What you see in the surveyor is the Alias of the element. But the SLA receives “raw” alarms from the element, that does not know of any Alias for services.
Hi Nicolas, so I raised an alarm from each of the elements (TEST-Newtech-HE in the ‘root’ service as well as TEST-PVR-01-Mux1 in the ‘child’ service). For both cases, I see an entry in the Outage List with ‘End Timestamp’ = ‘now’ indicating that an outage is occurring and impacting the SLA. However, for both cases I observed that the contents of the ‘Current Active Service Alarms’ table is empty. This does not seem right does it?
On the “Advanced Configuration” page you can find the “Active Alarms” parameter. If this is set to “Hide” you will not see the current active alarms as described above.
You can toggle this to “Show” to see the current active alarms. (Note that you may need to increase your security level to do this)
I hope this solves your issue.
Hi Nicolas, thanks for that advice. The alarms I raised are now listed in the ‘Current Active Service Alarms’ table.
I can also see that the ‘Current Active Service Alarm Element’ is populated with the actual Element Name. And this is expected as we are not using Aliases.
Then this could indeed be an issue, as on my internal test setup this seems to be working fine for me.
Could you also list the SLA version and DMA version?
Hi Michiel, thanks for chipping into this discussion. There does not appear to be an option to filter on Service name (I updated the question with the selection of options).