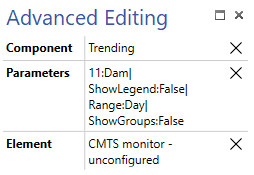
In Visual Overview (visio), I can add a trend graph of a parameter and show the last day of trending with the following options.

Is there a way to show the last two days instead of the last day?
Tobe Deprez [SLC] [DevOps Advocate] Selected answer as best
Here's how to set it up. There's 1 tricky part as you don't want to update the range constantly with the current time. Therefore we need to first store the current time in a variable instead of directly using it in the Range of the chart.
On the page:
- InitVar => [sep::$]Now$[DataMinerTime] (note the sep is necessary because in our culture DataMinerTime outputs a value with ':' characters)
- Options => PageVariable
On the trend graph
- ParametersOptions => Range:Start=[subtract:[pagevar:Now],2.00:00:00],End=[pageVar:Now]
Relevant help links other than DataMinerTime and InitVar:
Tobe Deprez [SLC] [DevOps Advocate] Selected answer as best