Hello,
Is it possible to plot multiple parameters on a single chart using reports and dashboards? When adding a new parameter it will be plotted on a separate chart but inside the same component
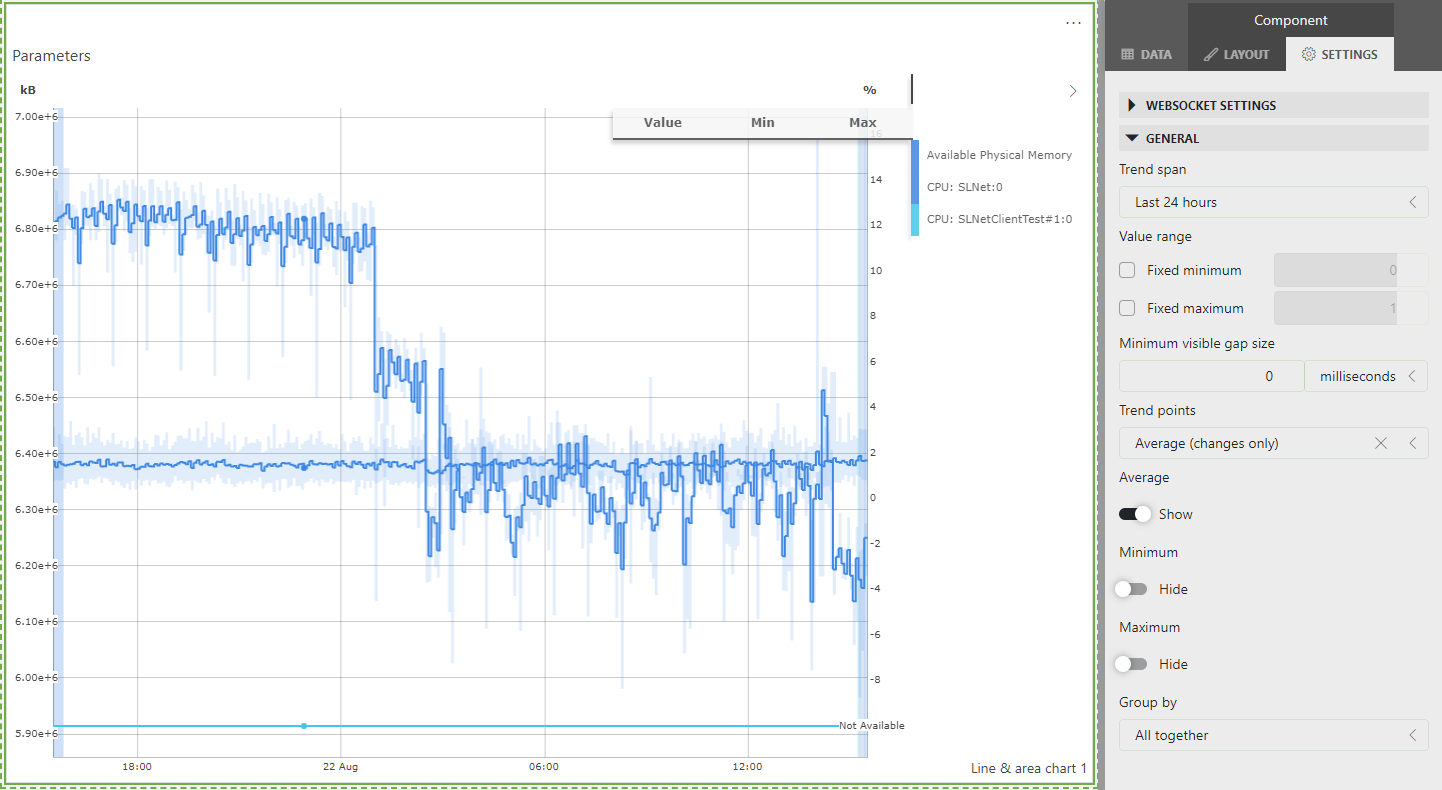
As the screenshot shows, after adding three parameters, they were plotted inside the same component but on separate charts, so the user has to scroll down to see them and it becomes difficult to see any correlation between them.
In the trending interface, multiple parameters can be easily plotted on the same graph as the following.
Hello Fares
This can be achieved through the group by setting of the chart.
Select your component > Settings tab > General > Group by all together.
