Greetings everyone,
we use multiple Juniper devices which we want to monitor the data-traffic in terms of bit in/out, visualized in a Line & area chart.
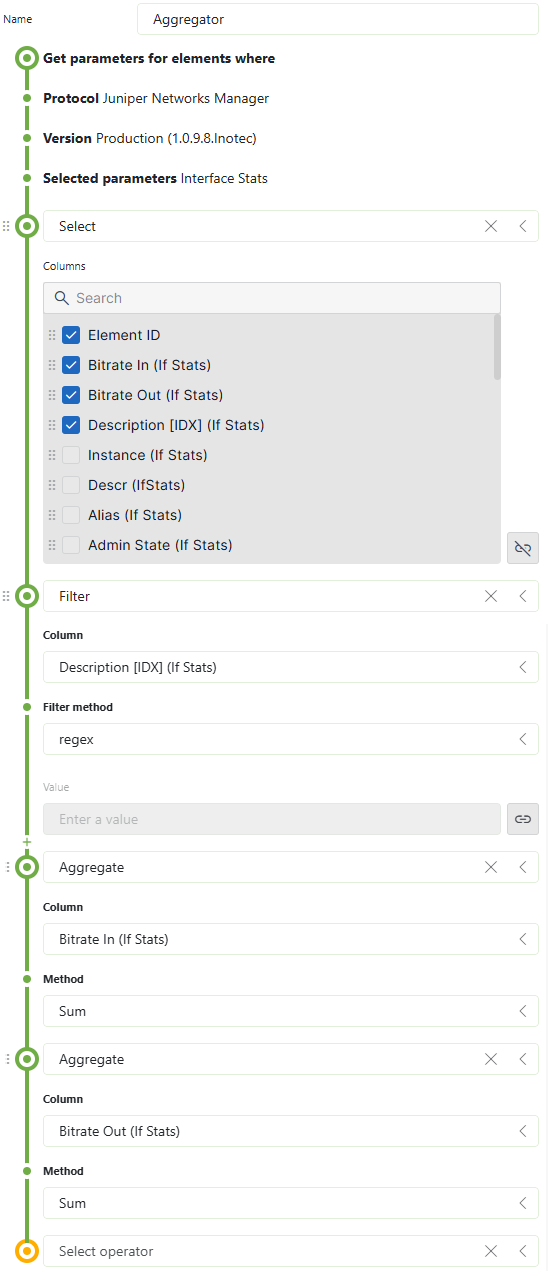
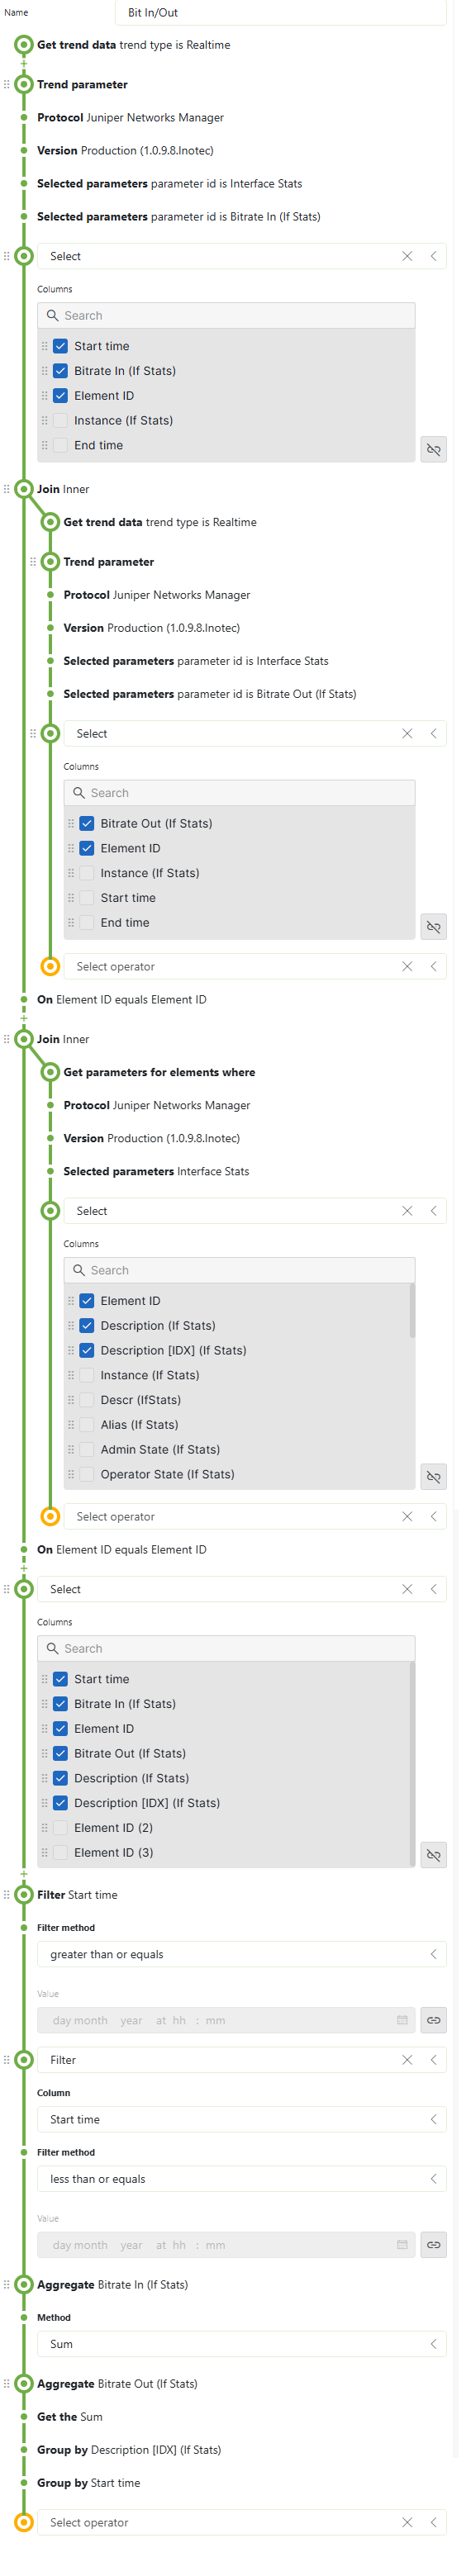
I've managed to create queries with selected interfaces we want and need to monitor and to sum the value for bit in and out in a parameter table. Challenge is now to visualize it into a graph, but it needs timestamps
The "aggregator" shows successfully the selected interfaces we choose from the parameter table "selector".
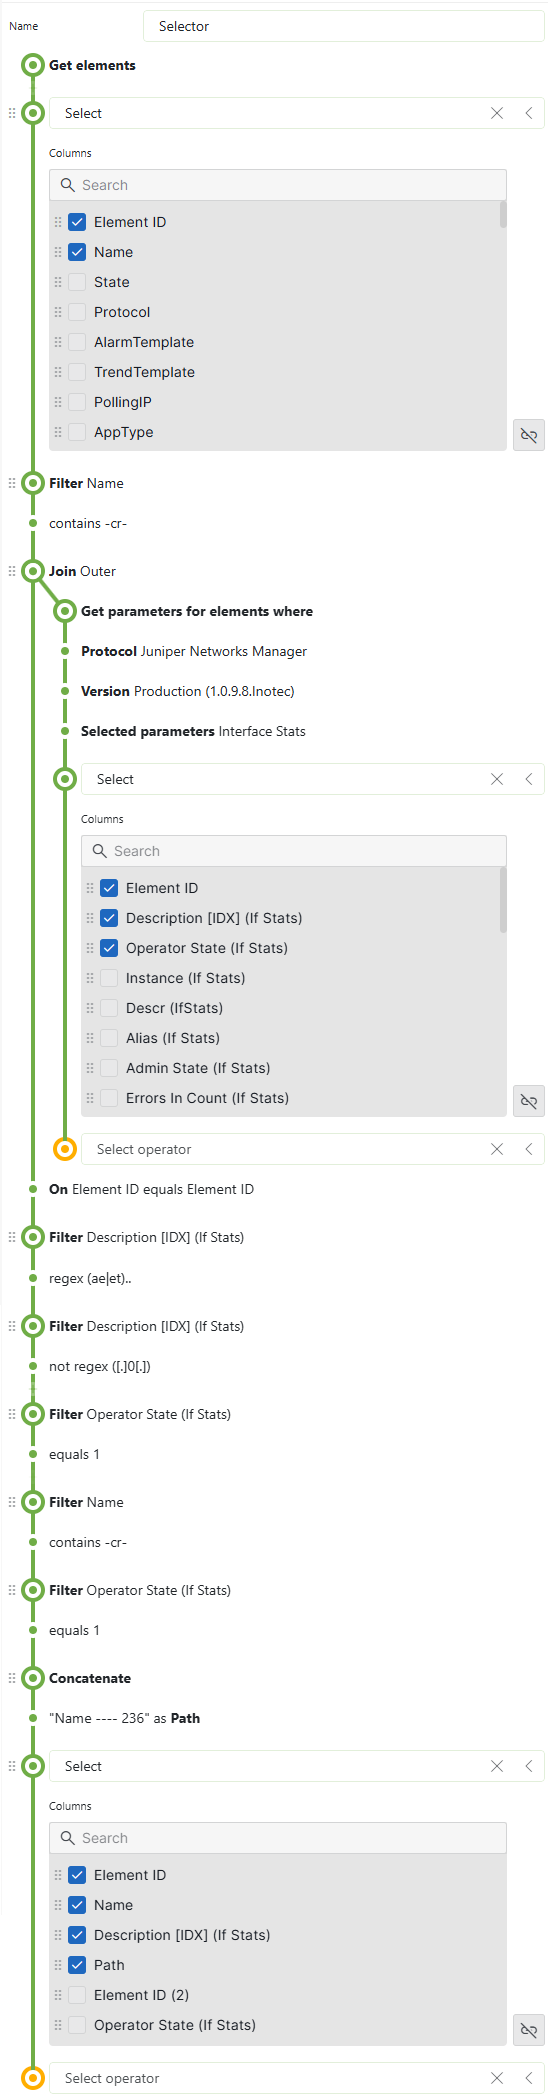
For this query i've tried to join multiple tables to match elements with "element id" and description [IDX] to bind into column "start time" which i then filter it with a timespan.
Unfortunately the parameter table wont show every entry we need of our juniper devices nor does it show anything at all due to many entries.
Any hints on solving this request?
Ive concerns that used the "join" wrongly but couldn't figure it out.
Thank you in advance!
Hi Minh,
If I am not mistaken, your GQI is trying to sum all rates for a subset of interfaces available in the `Interfaces Stats` table across different timestamps. I believe this approach may not be optimal. Rather than executing this action for all timestamps at runtime, it will more efficient to compute the aggregation once and store the results in DB.
Below some possible alternatives:
- Use aggregation rules to calculate the sum. Aggregations rules allows you to aggregate data from tables and persist the result in a DB.
- Use the Data Aggregator. Data Aggregator allows you to execute the GQI query and offload the result in a CSV file. For example, once a day you can execute a query that will perform this aggregation and stores the result in a CSV file. This file can be mapped into a GQI query using an ad-hoc data source.
- Implement an extra parameter in the connector that performs the aggregation.
Hope it helps.
Hi Minh,
In this case, I will go for one of the approaches:
– Aggregation rules
– New driver feature that calculate the aggregated result
Hey Miguel,
in Aggregation rules how do i set the condition to filter on selected description on created dashboard?
Like: calc sum bitrate In with condition match regex on choosen description interface from the parameter table.
1 paramater table for the rule to show the values of the interface
1 parameter table or smth which suites the most to filter/select the interface
1 line chart then to display it.
thanks in advance!
Greetings Miguel,
It is kinda mandatory to have the data in a live Line & area chart.
Once a day or so is unfortunately not an option.
In such topic we were advised from our support to ask the community.
Because it looked like the only solution were hidden in a magical query.
Anyways thank you very much for your insights!