Hi, is it possible to manually specify the color of the lines in line graphs in Dashboards? If yes what are the steps to configure?
Bing Herng Chong [SLC] [DevOps Advocate] Selected answer as best
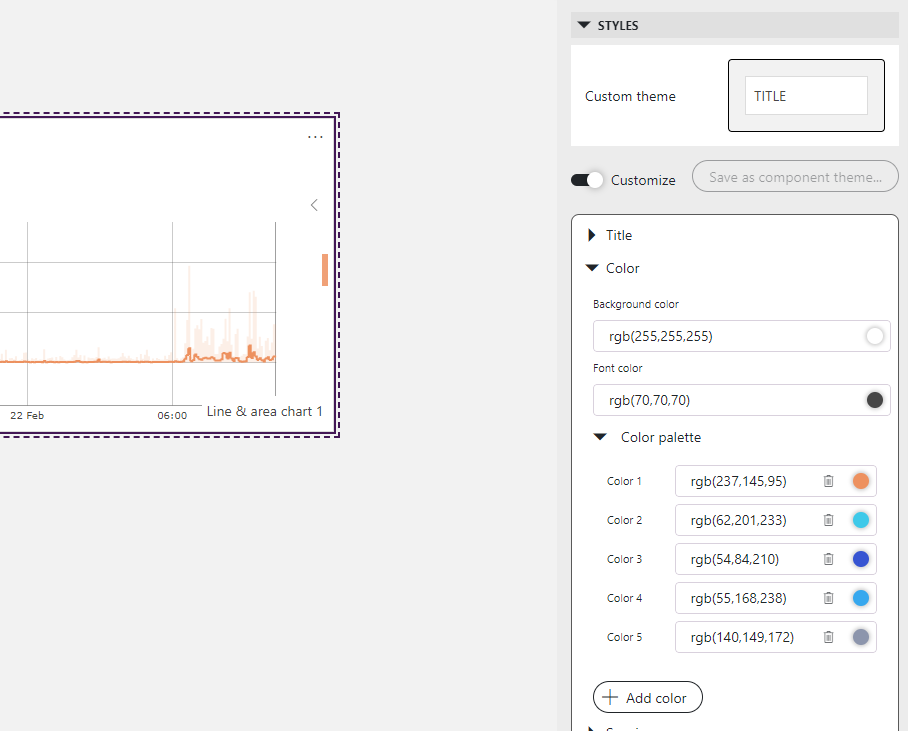
Hi,
It is possible to change the color of lines in a linechart:
1) Select the linechart
2) Open the component layout settings
3) Under the styles tab click the ‘customize’ toggle
4) Click color -> color palette
Here you can change the colors of the lines in the linechart.
Small note: Right now the color is not linked to the parameter but rather the order in which the data is fed to the component. We have a task on our backlog to adress this.
Bing Herng Chong [SLC] [DevOps Advocate] Selected answer as best