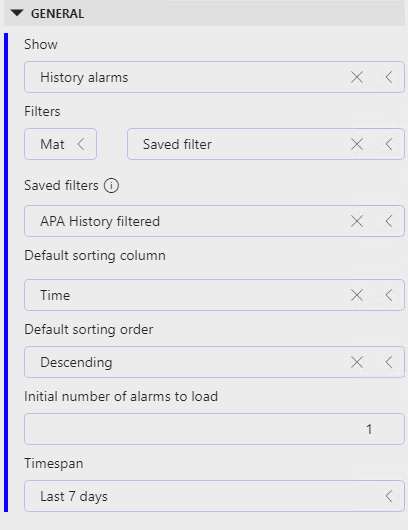
We have created a Low code app for a customer with one page showing a table for an Elements Active alarms and another table showing the Elements History Alarms.
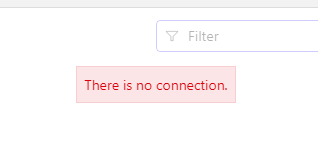
The Active Alarms table works fine but for the History Alarms table when selecting History or Sliding Window I just get the Loading Alarms message on the table and after a while then get a red "There is no connection" or "An unknown error Occurred (Status: 500)". This happens regardless of time span or if using no filter, a saved filter or selecting an Element etc.
Is this a known issue ? Running DM v10.2.12 CU2
Hi Ruben, Yes in the Alarm console itself all works as expected.
and about how many alarms did you receive in the selected time window?
Hi Pieter, It doesnt matter if I use a saved filter that returns 1 alarm over the past 7 days or one that returns multiple alarms over 30 days the result is the same in the low code app. Nothing loads and eventually you get the "There is no connection" message. All other pages and Active alarms table load without issue.


Hi Chris, I meant the number of alarms in the time window with no filter at all
Can you confirm the alarms show up in a timely manner through the Cube alarm console, using the same filters?