Hi All.
Is there a way to display live bar graphs like below in a Visio shape.
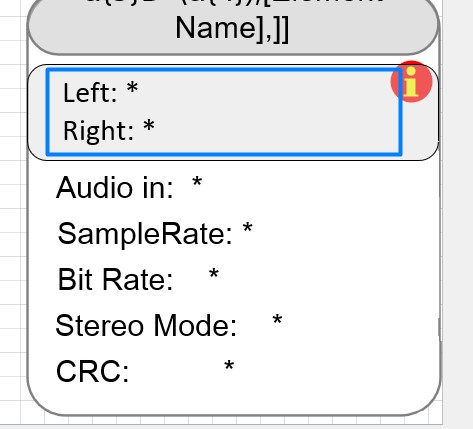
I wanted to display the left and right audio levels from a device on a mimic where I only have number values.
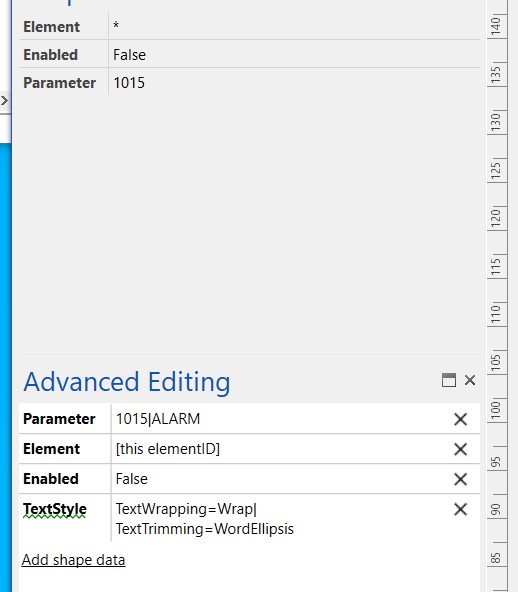
Below is how I currently display the shape data.


This is what I was hoping to display as a visual on a mimic

Nathan Sciani [DevOps Member] Answered question
Nathan Sciani [DevOps Member] Selected answer as best