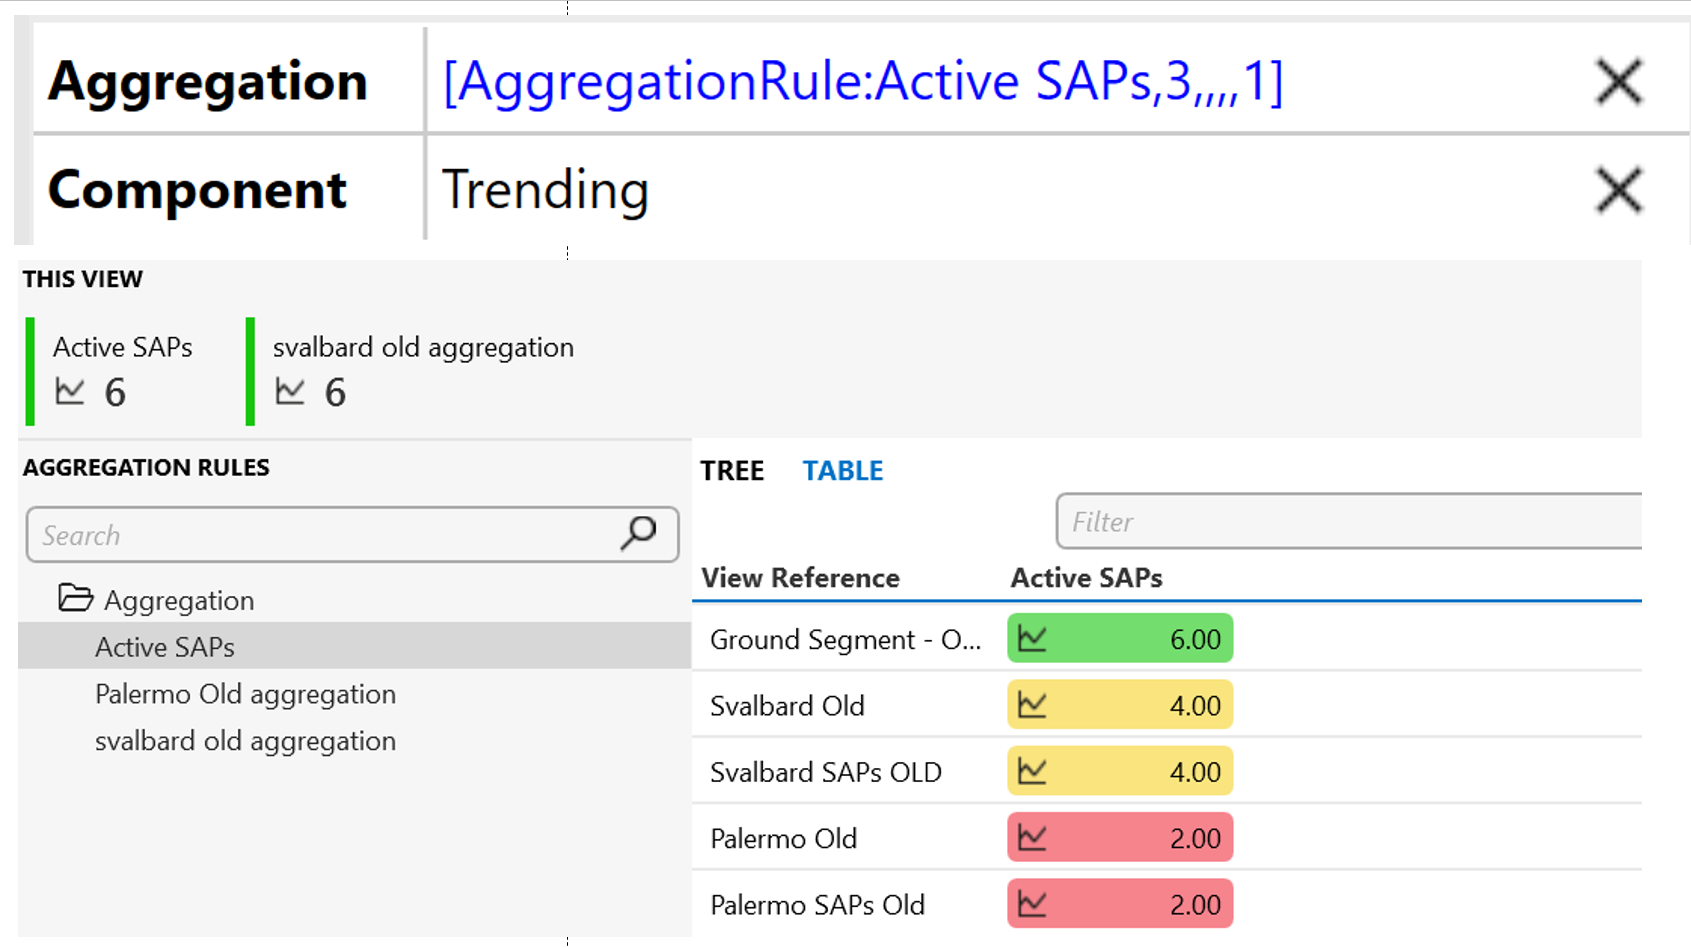
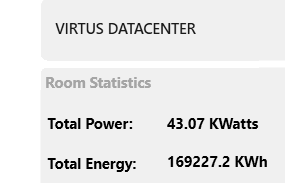
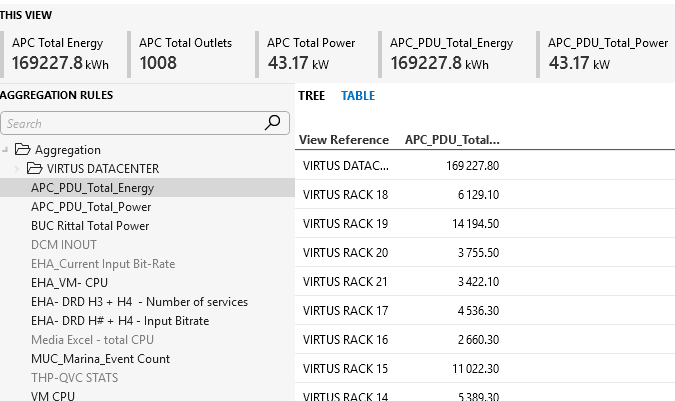
I am trying to display the values (with alarm colouring) from a specific row or rows of an aggregation rule in a visio shape, however, the shape doesn’t get populated. Additionally, I’d like to display the trending graph on visio.
Could there be something missing?
The View ID that I want to Aggregate from is ID: 3, which provides the result on this screenshot.
Hi Elvio,
The first step is to get the shape populated (only then are we sure that the correct index has been generated). Make sure every field of the placeholder is correctly filled in (see Help).
We can then show the trending of the aggregation rule by using the syntax of the trend component (see Help). So you’ll need to use the Parameters shape data instead of Aggregation.
Hi Joerg, the alarm status color is shown automatically. No additional configuration is required.
Just to clarify
I was looking for the solution to show the related alarm color to the aggregated value.
It’s quite easy: create a new shape (rectangle) and assign a shapeData:
shapeData.label = Aggregation
shapeData.value = dmaID/elementID:4005:aggregationIndex
That’s correct, the alarm status color is used as a background color automatically.
Here is an example of where I linked and aggregation rule. There are 10 USC chassis per rack. The view represents a the Server Rack. I am aggregating and finding the average metrics across the 10 servers per rack and displaying them in the Visio below.
To link the Overall Utilization aggregation I used the following in the shape data:
[AggregationRule:UCS/UCS Overall Utilization,[this viewID]]
Aggregation Folder: UCS
Aggregation Rule: UCS/UCS Overall Utilizaiion
The following dynamically links me to the view I select with [this viewID]
This next Image shows the aggregation rule table for an Equipment Row (Row Mission 503) that contains 11 equipment racks (Mission 503.10 is a rack, Mission 503.11 is a rack). I can now click on any Row or Rack View and dynamically view the aggregation values per row or just per rack. The blue line indicates the USC folder and the aggregation rules. The Red line is the example of the view I showed above.
The images are small so send me an email at randy.ulvenes@skyline.be and I can give more details if needed.
Hi,
I am trying to build the same thing.
Based on Sebastiaan answer I have check and:
Step1: I have a shaped with the following specs

The results are good. It is returning the correct values

based on Aggregation rules

Step2: Created a new shape and aded the Component:Trending Data Field and the Parameters Filed

The result:

What am I doing wrong ? Is the syntax ?
Also Can I trend any of the rows from the Aggregation Rule Table ?
Thank you.
Hi Sebastiaan
Just one question.
I managed to show the value of the aggregation rule in a shape in a visual.
shapeData.label = Aggregation
shapeData.value = dmaID/elementID:4005:aggregationIndex
Unfortunately the alarm status color is not reflected in the shape data.
Do I need an additional shape date option to achieve that?
I appreciate your support