Skip to content
DataMiner DoJo

More results...

Generic selectors
Exact matches only
Search in title
Search in content
Post Type Selectors
Search in posts
Search in pages
Search in posts
Search in pages
Log in
Menu
  • Updates & Insights
  • Questions
  • Learning
    • E-learning Courses
    • Empower Replay: Limited Edition
    • Tutorials
    • Open Classroom Training
    • Certification
      • DataMiner Fundamentals
      • DataMiner Configurator
      • DataMiner Automation
      • Scripts & Connectors Developer: HTTP Basics
      • Scripts & Connectors Developer: SNMP Basics
      • Visual Overview – Level 1
      • Verify a certificate
    • Video Library
    • Books We Like
    • >> Go to DataMiner Docs
  • Expert Center
    • Solutions & Use Cases
      • Solutions
      • Use Case Library
    • Markets & Industries
      • Media production
      • Government & defense
      • Content distribution
      • Service providers
      • Partners
      • OSS/BSS
    • Agile
      • Agile Webspace
      • Everything Agile
        • The Agile Manifesto
        • Best Practices
        • Retro Recipes
      • Methodologies
        • The Scrum Framework
        • Kanban
        • Extreme Programming
      • Roles
        • The Product Owner
        • The Agile Coach
        • The Quality & UX Coach (QX)
    • DataMiner DevOps Professional Program
      • About the DevOps Program
      • DataMiner DevOps Support
  • Downloads
  • More
    • DataMiner Releases & Updates
    • Feature Suggestions
    • Climb the leaderboard!
    • Swag Shop
    • Contact
    • Global Feedback Survey
  • PARTNERS
    • All Partners
    • Technology Partners
    • Strategic Partner Program
    • Deal Registration
  • >> Go to dataminer.services

Line and Area Chart Axes starting from zero

Solved433 views17th December 2024Dashboard line and area chart
1
Daniel Lentoiu619 17th December 2024 0 Comments

Hi Dojo,

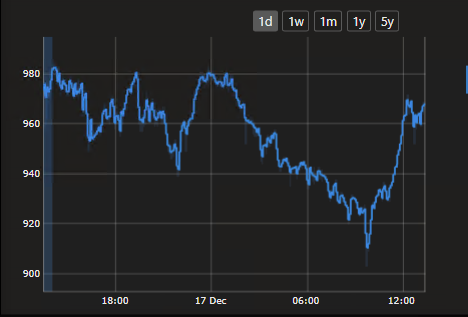
i would like to have the vertical axes starting from “zero” and not zooming in following values on the Dashboard App.

How can I achieve that ?

Thanks.

Daniel Lentoiu Selected answer as best 17th December 2024

1 Answer

  • Active
  • Voted
  • Newest
  • Oldest
1
Robin Debel [SLC] [DevOps Enabler]1.45K Posted 17th December 2024 0 Comments

Hi Daniel,

For GQI data, as of now there is no way to achieve this…
We have a task on our backlog to introduce the ability to set a static Y-axis range. When this feature is implemented we will let you know here.

If you are using a trended parameter you can use these settings:

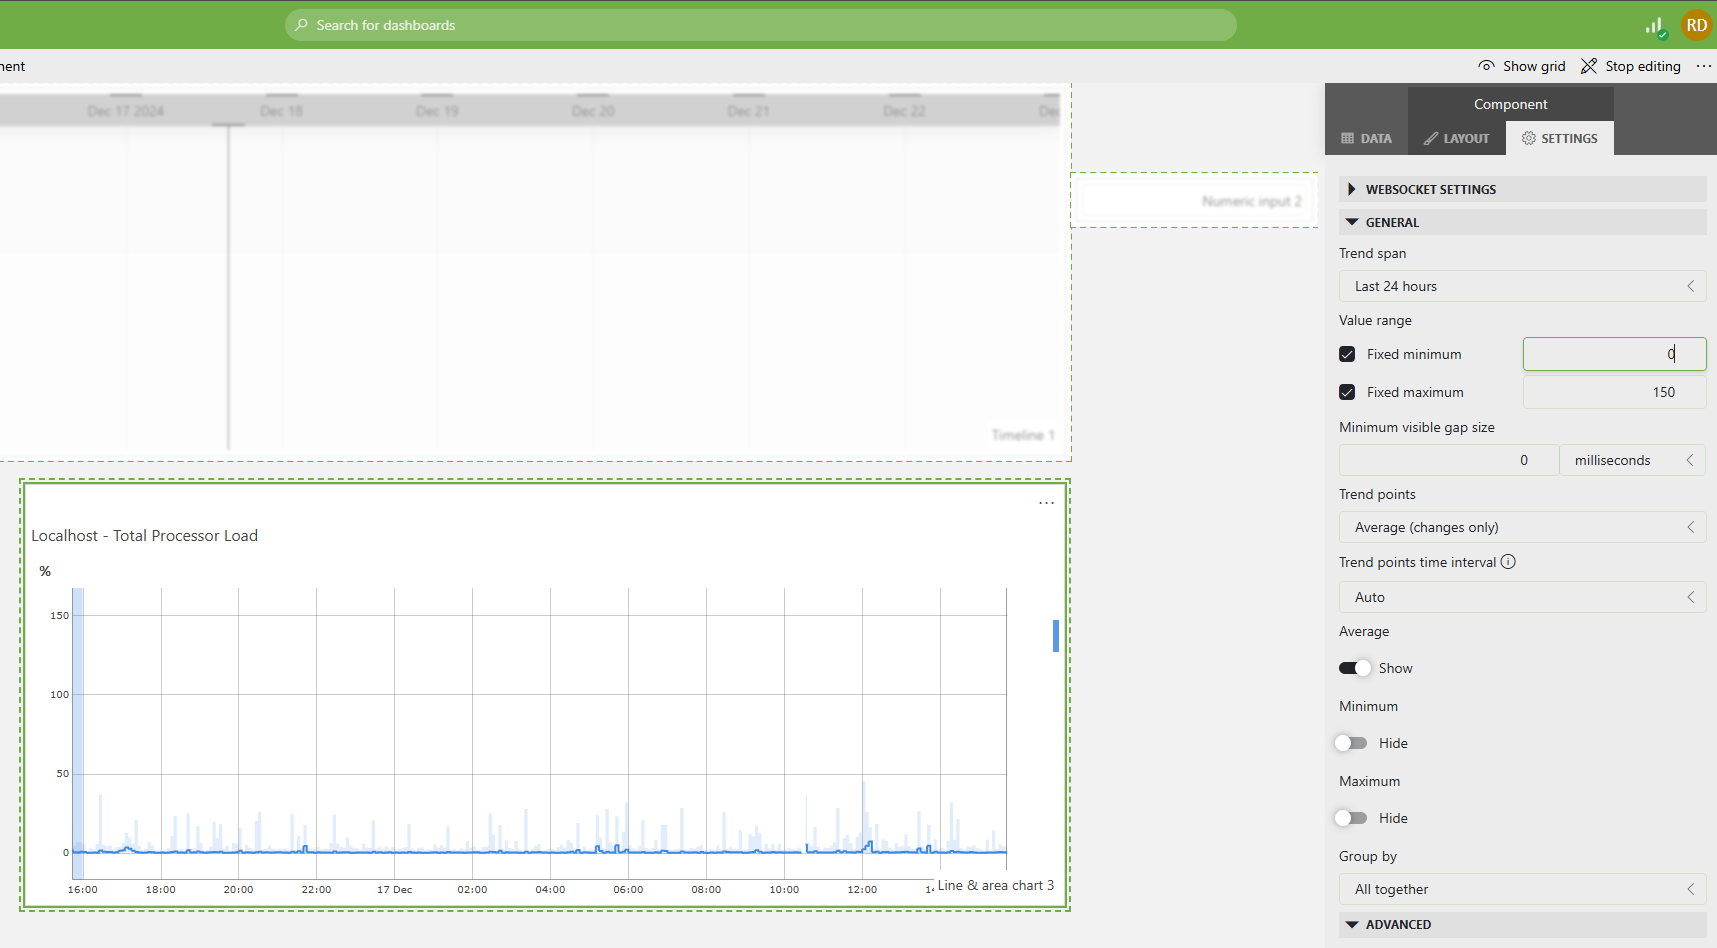
Notice that i set the fixed minimum and fixed maximum settings here.
If you don’t see it applied, for me it worked when changing the minimum value again.
I’ve created a task to fix this so these settings are always applied.

With kind regards,
Robin

Robin Debel [SLC] [DevOps Enabler] Edited answer 17th December 2024
Please login to be able to comment or post an answer.

My DevOps rank

DevOps Members get more insights on their profile page.

My user earnings

0 Dojo credits

Spend your credits in our swag shop.

0 Reputation points

Boost your reputation, climb the leaderboard.

Promo banner DataMiner DevOps Professiona Program
DataMiner Integration Studio (DIS)
Empower Katas
Privacy Policy • Terms & Conditions • Contact

© 2025 Skyline Communications. All rights reserved.

DOJO Q&A widget

Can't find what you need?

? Explore the Q&A DataMiner Docs