Hey Dojo,
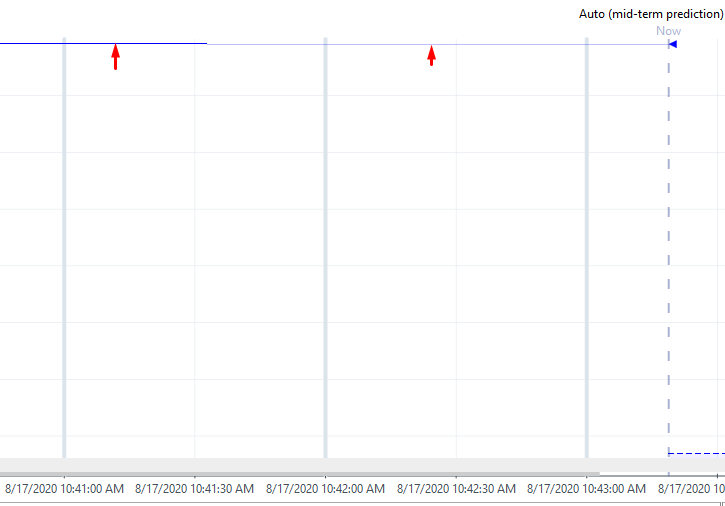
When opening my trend graph, I noticed that the last two minutes of my trend line are light-blue while all other lines are dark blue.
Does someone know what this lighter blue line means? What's the difference with the dark blue?
With kind regards,
Maxim
The dark blue line represents data that is already written to the database, and queried from the database at regular time intervals.
The light blue line represents real-time parameter updates. In other words, parameter values which have been retrieved from the data source (eg through SNMP polling), but which have not yet entered the database.
You'll notice that if you keep the trend graph open, over time the light blue lines will turn dark blue, as the data points are gradually retrieved from the database.
Note that the light blue lines can be turned off through a user setting 'Extend trend data from the database with real-time parameter changes'