Is it possible to have a 'combined measurement view' in the Dashboard/LCA Spectrum display as it is in the Spectrum app?
We want to allow the users to compare multiple selected Measurement Points from the LCA/Dashboard interface same as if they were using Cube.
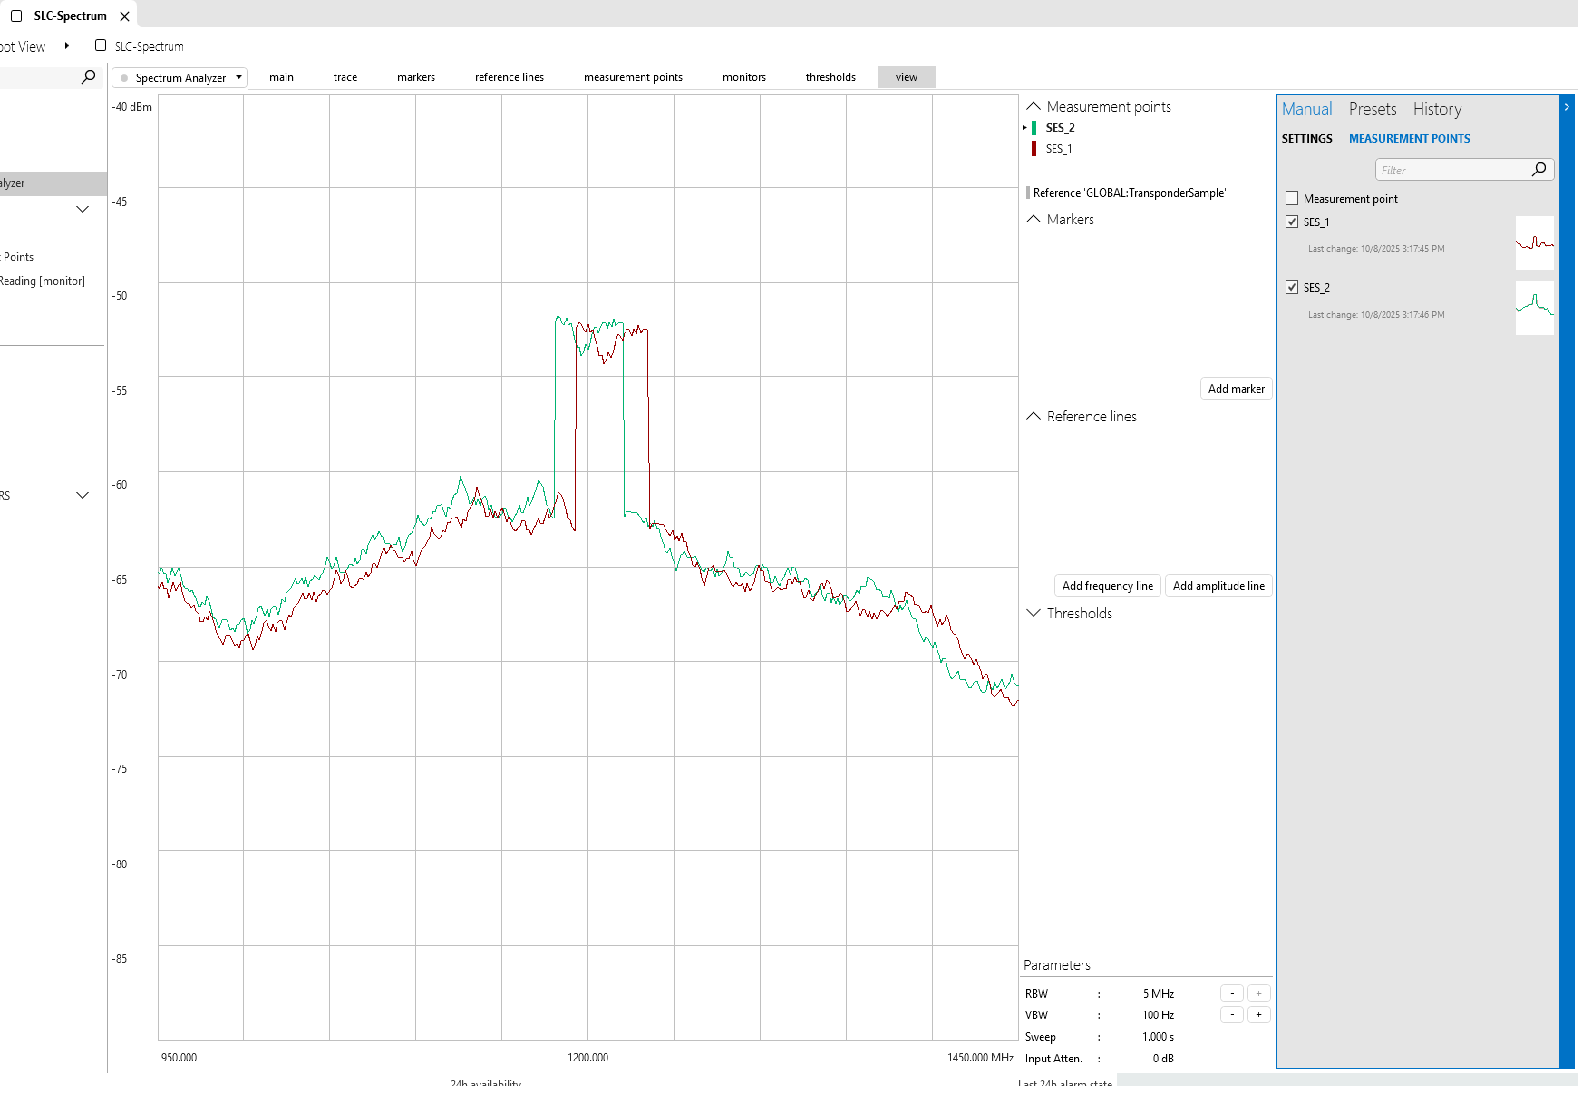
Currently, we are able to display the Spectrum trace and Measurement Point selection. The user is able to hold the ctrl key and make multiple selections. However, the Spectrum display just cycles through the selections as a single trace display rather than combined trace as shown below.
Steve Purcell [SLC] [DevOps Advocate] Selected answer as best
I added a different Spectrum test element and the HTML5 display worked as desired. Issue seems to be tied to the older test spectrum element.
Steve Purcell [SLC] [DevOps Advocate] Edited comment
Further investigation identified that the HTML5 Spectrum display relies on the user logging into Cube and selecting the 'Combined Measurement point View' under 'Measurement Points' menu and 'External Labels' from 'View' menu. By default, these settings are not selected, so the HTML5 spectrum display (LCA / Dashboard) only shows one trace at a time rather than combined.