Hello,
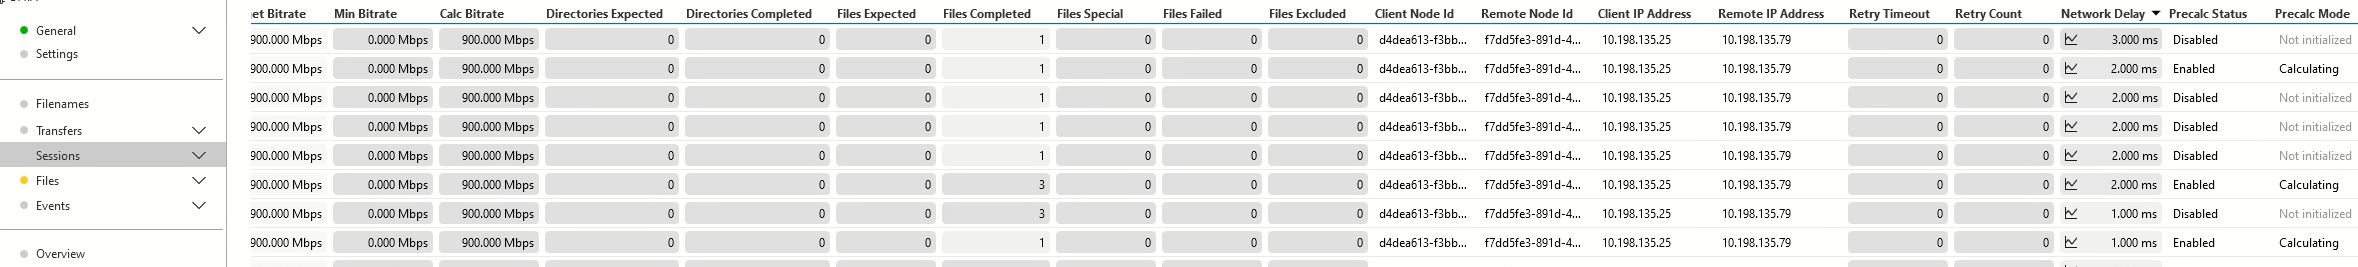
I am wanting to add a trending graph to a visio drawing. The only issue is when I set up trending on the parameter in a table, it sets up individual trending graphs for every single item. Is it possible to make dataminer do an overall trending for the parameter Network Delay shown in the screenshot?
Hey Ben, that is correct. Instead of an individual trending graph for every single file transfer, I want to see an overall trending total if possible.
Just one more follow-up question: would you want to alarm also on that aggregate value or just be able to see the graph over time of the aggregate value?
Alarming would be a great option as operations may want it but not an absolute requirement.
Peter,
Here is the screenshot for my comment. It would not let me add it to a comment.
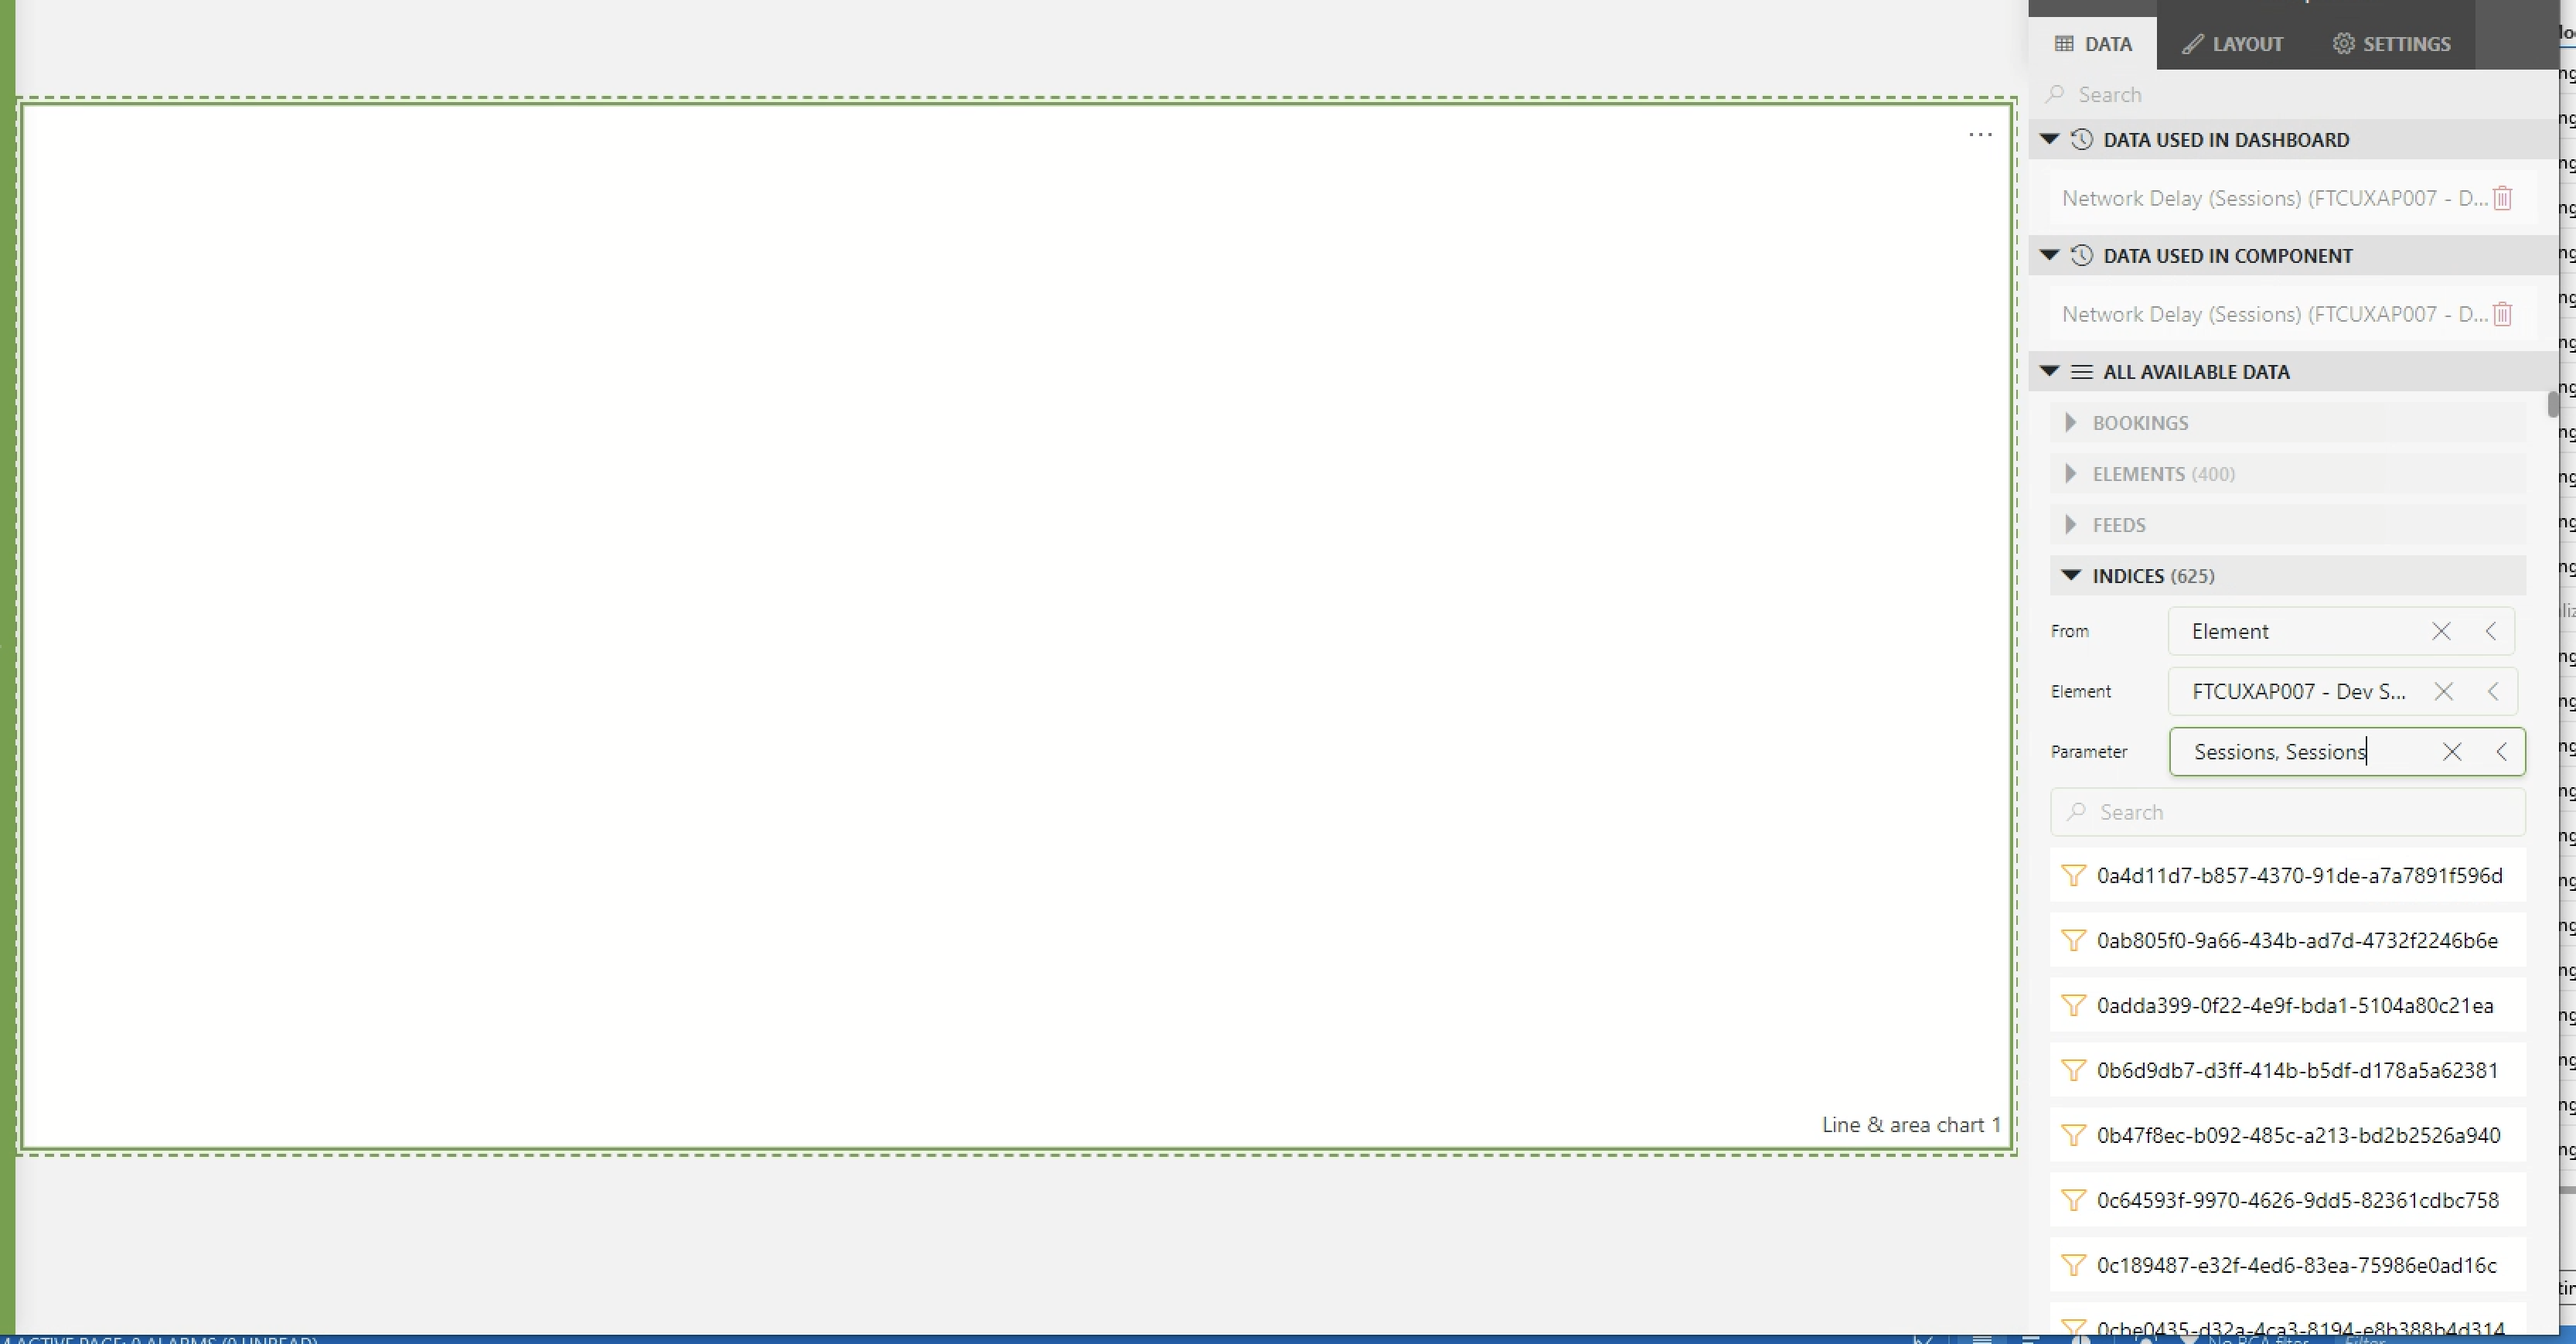
Hi David, do you mean that you would like to see the trending of the aggregate value of all the individual metrics?