Skip to content
DataMiner DoJo

More results...

Generic selectors
Exact matches only
Search in title
Search in content
Post Type Selectors
Search in posts
Search in pages
Search in posts
Search in pages
Log in
Menu
  • Blog
  • Questions
  • Learning
    • E-learning Courses
    • Open Classroom Training
    • Certification
      • DataMiner Fundamentals
      • DataMiner Configurator
      • DataMiner Automation
      • Scripts & Connectors Developer: HTTP Basics
      • Scripts & Connectors Developer: SNMP Basics
      • Visual Overview – Level 1
      • Verify a certificate
    • Tutorials
    • Video Library
    • Books We Like
    • >> Go to DataMiner Docs
  • Expert Center
    • Solutions & Use Cases
      • Solutions
      • Use Case Library
    • Markets & Industries
      • Media production
      • Government & defense
      • Content distribution
      • Service providers
      • Partners
      • OSS/BSS
    • DataMiner Insights
      • Security
      • Integration Studio
      • System Architecture
      • DataMiner Releases & Updates
      • DataMiner Apps
    • Agile
      • Agile Webspace
      • Everything Agile
        • The Agile Manifesto
        • Best Practices
        • Retro Recipes
      • Methodologies
        • The Scrum Framework
        • Kanban
        • Extreme Programming
      • Roles
        • The Product Owner
        • The Agile Coach
        • The Quality & UX Coach (QX)
    • DataMiner DevOps Professional Program
  • Downloads
  • More
    • Feature Suggestions
    • Climb the leaderboard!
    • Swag Shop
    • Contact
      • General Inquiries
      • DataMiner DevOps Support
      • Commercial Requests
    • Global Feedback Survey
  • PARTNERS
    • All Partners
    • Technology Partners
    • Strategic Partner Program
    • Deal Registration
  • >> Go to dataminer.services

IBM Aspera Trending Graph

Solved1.64K views6th June 2022Aspera trending Visio
1
David Rowell [DevOps Member]221 1st June 2022 4 Comments

Hello,

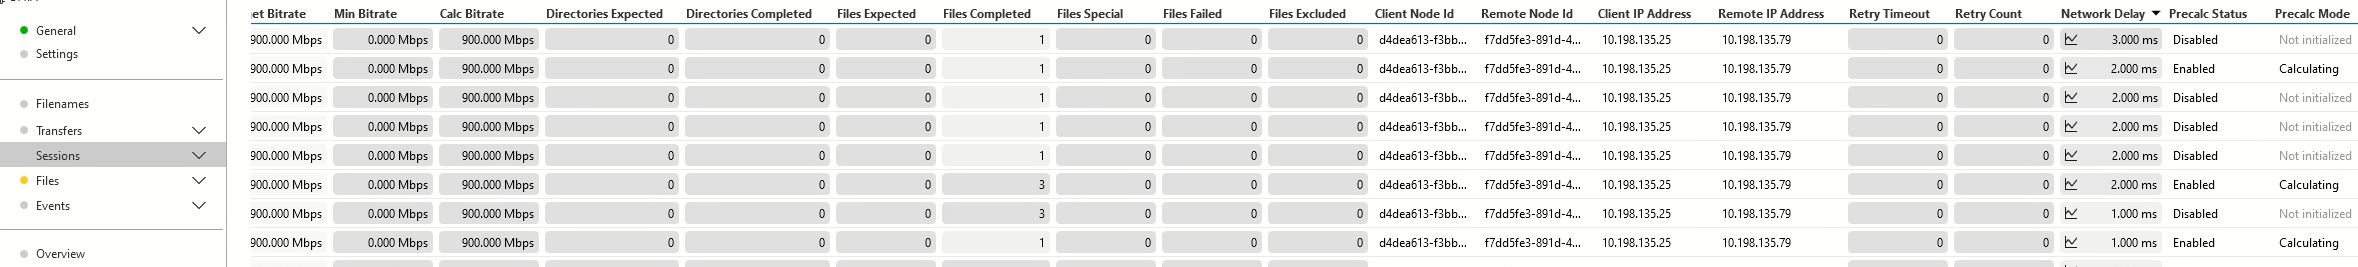
I am wanting to add a trending graph to a visio drawing. The only issue is when I set up trending on the parameter in a table, it sets up individual trending graphs for every single item. Is it possible to make dataminer do an overall trending for the parameter Network Delay shown in the screenshot?

David Rowell [DevOps Member] Selected answer as best 6th June 2022
Ben Vandenberghe [SLC] [DevOps Enabler] commented 1st June 2022

Hi David, do you mean that you would like to see the trending of the aggregate value of all the individual metrics?

David Rowell [DevOps Member] commented 1st June 2022

Hey Ben, that is correct. Instead of an individual trending graph for every single file transfer, I want to see an overall trending total if possible.

Ben Vandenberghe [SLC] [DevOps Enabler] commented 1st June 2022

Just one more follow-up question: would you want to alarm also on that aggregate value or just be able to see the graph over time of the aggregate value?

David Rowell [DevOps Member] commented 1st June 2022

Alarming would be a great option as operations may want it but not an absolute requirement.

3 Answers

  • Active
  • Voted
  • Newest
  • Oldest
3
Pieter Van Compernolle [SLC] [DevOps Enabler]3.20K Posted 2nd June 2022 5 Comments

In addition to item 2 from Ben, you can also have stacked line charts in dashboards. Here is a quick gif on how you can do that for example on the task manager table of a Windows server:

see also: Line & area chart | DataMiner Docs

Dashboards can also be embedded in Visio: see Embedding dashboards - DataMiner Dojo

Pieter Van Compernolle [SLC] [DevOps Enabler] Posted new comment 7th June 2022
David Rowell [DevOps Member] commented 2nd June 2022

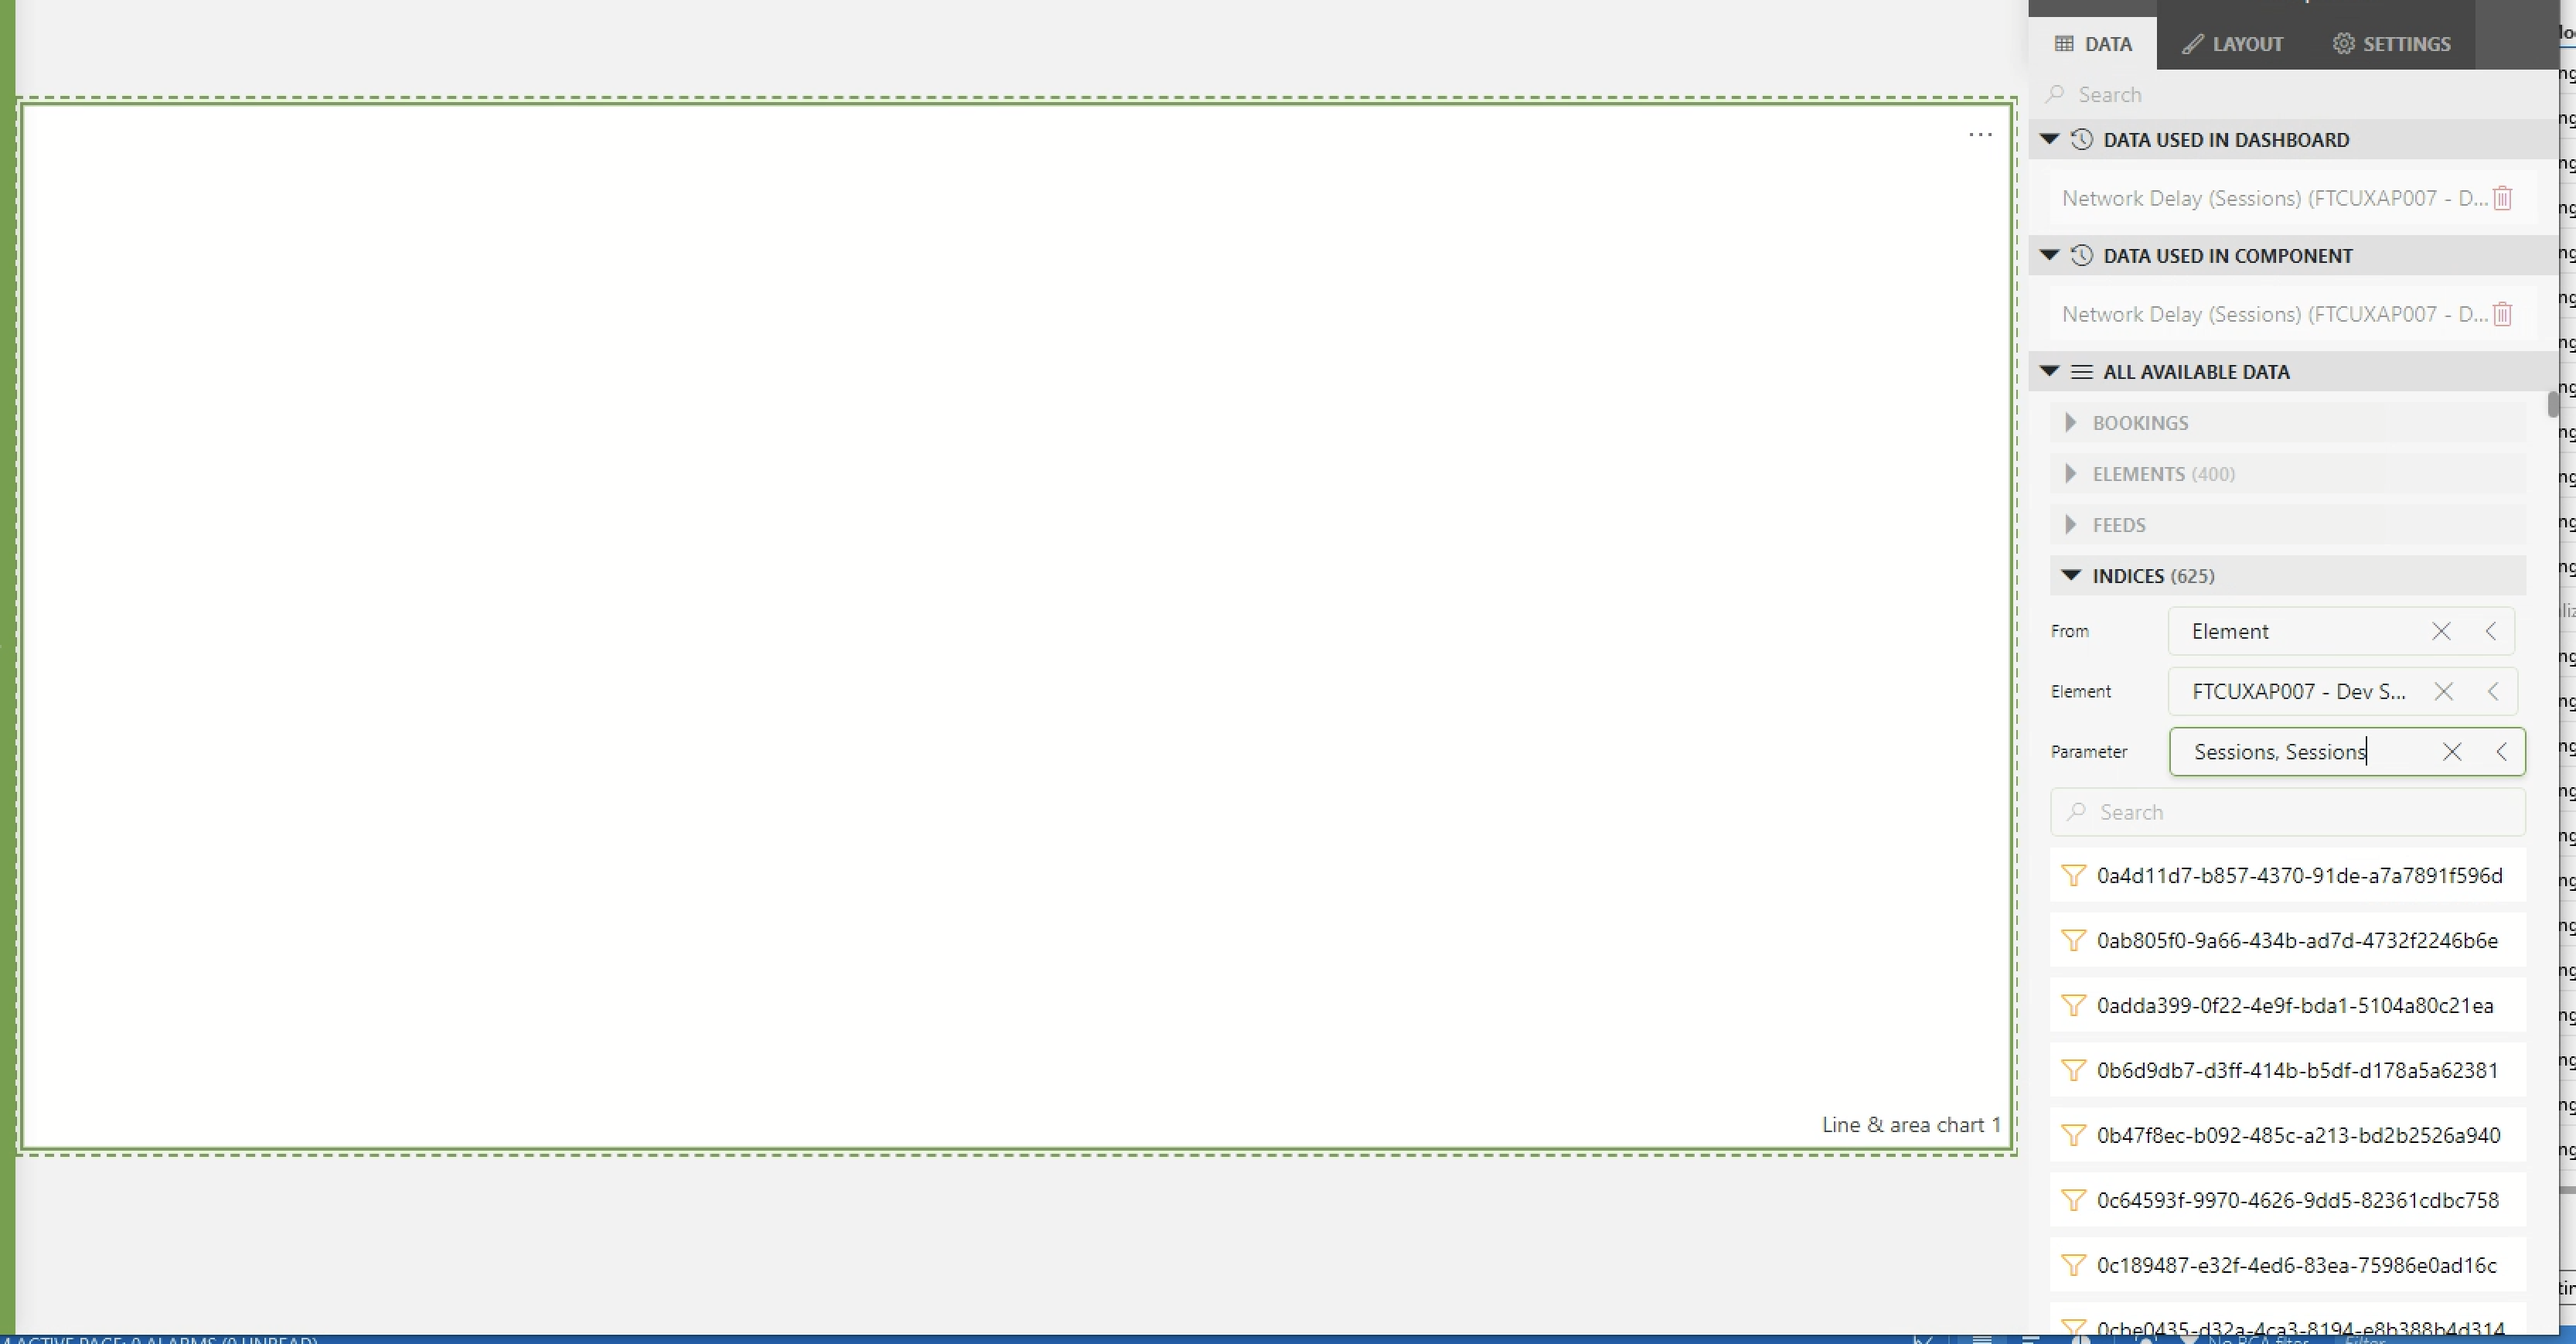
Hey Peter, this is wonderful information and great to know. So, I am running into one issue. The parameter I want to monitor and see trending data is for Network Delay under sessions on the IBM Aspera driver. These sessions are constantly changing and being added/removed. When I go to indicies, they are all greyed out. Is it possible to have the dashboard just look at Network Delay as a whole?

David Rowell [DevOps Member] commented 2nd June 2022

Ok, so I do see the indicies now. But like I said, they are always changing so I just need it to monitor any that appears under Sessions for Network Delay.

Pieter Van Compernolle [SLC] [DevOps Enabler] commented 3rd June 2022

Linking to all rows from a table is not possible right away at this moment, but there is a workaround you can apply via a ‘parameter feed’ component in your dashboard.

So here’s is what you can do:
1. Add a parameter feed component to your dashboard. Link it to your element and column parameter.
2. Select the component and in the Component Settings at the right hand side enable [x] Auto Select all and ensure the default grouping is ‘All together’.
3. Add a trend line component and link it to the ‘Parameters’ feed from your Parameter feed (so in ‘Data’ in the right panel again, expand ‘feeds’ and expand ‘Parameter selector’ and drag ‘Parameters’ to your trend chart.
4. Refresh your dashboard and you should have all rows loaded initially. You can enable or disable lines by using the selection boxes from the parameter feed component.

If you don’t find your way, just let me know, then I can make a new gif that illustrates this visually.

Good luck!

David Rowell [DevOps Member] commented 6th June 2022

Hey Peter, this worked. Thank you so much! This was very helpful and a good learning experience!

Pieter Van Compernolle [SLC] [DevOps Enabler] commented 7th June 2022

Great! Thx for reporting back that it was helpful.

3
Ben Vandenberghe [SLC] [DevOps Enabler]9.06K Posted 1st June 2022 1 Comment

Hi David

I'm not too experienced hands on, but let me see if we can point you already into the direction of some options, on the top of my head:

Unfortunately it is not that obvious at this stage.

  1. If alarming would be required, the best option would be to alter the driver to include a metric that holds the aggregate of all those values.  But this is probably not something you would easily do yourself.
  2. If you want to view it, the standard trend graphs don't support that yet, but there is an option if you add a chart in the Visual Overview graphics of your element.  You would edit your Visual Overview of that element, draw a rectangle in Visio that needs to hold the graphical chart, and you would use the following Parameter Chart capability Creating a parameter chart | DataMiner Docs (it includes an example for the CPU load of all processes in a table, which is similar to your case).  And you would go for the STACKEDAREACHART.

I believe that these are currently the only ways to get something right now, with nbr 2 being the quickest option for you.  This is not an uncommon case, and if I'm not mistaken this is high on the list of the team working on the dashboards.  So a more convenient option may come up soon (unless I missed something myself and other people will further consult).

David Rowell [DevOps Member] Unselected an answer 2nd June 2022
David Rowell [DevOps Member] commented 1st June 2022

Ben,

Thank you for this information, it is very helpful. I figured it would require a change to the driver and after speaking with my manager that will be the best option as alarming is required. I will speak with our rep on getting some assistance with this. Thank you so much!

0
David Rowell [DevOps Member]221 Posted 2nd June 2022 0 Comments

Peter,

Here is the screenshot for my comment. It would not let me add it to a comment.

David Rowell [DevOps Member] Edited answer 2nd June 2022
Please login to be able to comment or post an answer.

My DevOps rank

DevOps Members get more insights on their profile page.

My user earnings

0 Dojo credits

Spend your credits in our swag shop.

0 Reputation points

Boost your reputation, climb the leaderboard.

Promo banner DataMiner DevOps Professiona Program
DataMiner Integration Studio (DIS)
Empower Katas

Recent questions

Web Applications exception in Cube due to invalid certificate 0 Answers | 0 Votes
Redundancy Groups and Alarming – Duplicate Alarms 0 Answers | 0 Votes
Correlation Engine: “Test rule” doesn’t result in a hit, despite functional rule 1 Answer | 3 Votes

Question Tags

adl2099 (115) alarm (62) Alarm Console (82) alarms (100) alarm template (83) Automation (223) automation scipt (111) Automation script (167) backup (71) Cassandra (180) Connector (109) Correlation (69) Correlation rule (52) Cube (151) Dashboard (194) Dashboards (188) database (83) DataMiner Cube (57) DIS (81) DMS (71) DOM (140) driver (65) DVE (56) Elastic (83) Elasticsearch (115) elements (80) Failover (104) GQI (159) HTTP (76) IDP (74) LCA (152) low code app (166) low code apps (93) lowcodeapps (75) MySQL (53) protocol (203) QAction (83) security (88) SNMP (86) SRM (337) table (54) trending (87) upgrade (62) Visio (539) Visual Overview (345)
Privacy Policy • Terms & Conditions • Contact

© 2025 Skyline Communications. All rights reserved.

DOJO Q&A widget

Can't find what you need?

? Explore the Q&A DataMiner Docs

[ Placeholder content for popup link ] WordPress Download Manager - Best Download Management Plugin