Prior to integrating an enhanced service connector into an existing service, we could conveniently represent the current service severity status through a Visio shape, indicating states such as Normal, Warning, or Critical. This information was directly visible on the service and could be easily displayed in Visio using [this service].
However, after assign the implementation of the enhanced service connector, this previous method ceased to function effectively. The outcome was a gray color in Visio, indicating an “Undefined” alarm status.
Upon inspecting the code of the enhanced service connector and referring to the documentation (Enhanced service | DataMiner Docs), it became apparent that parameter ID 2 holds the information about the service severity.
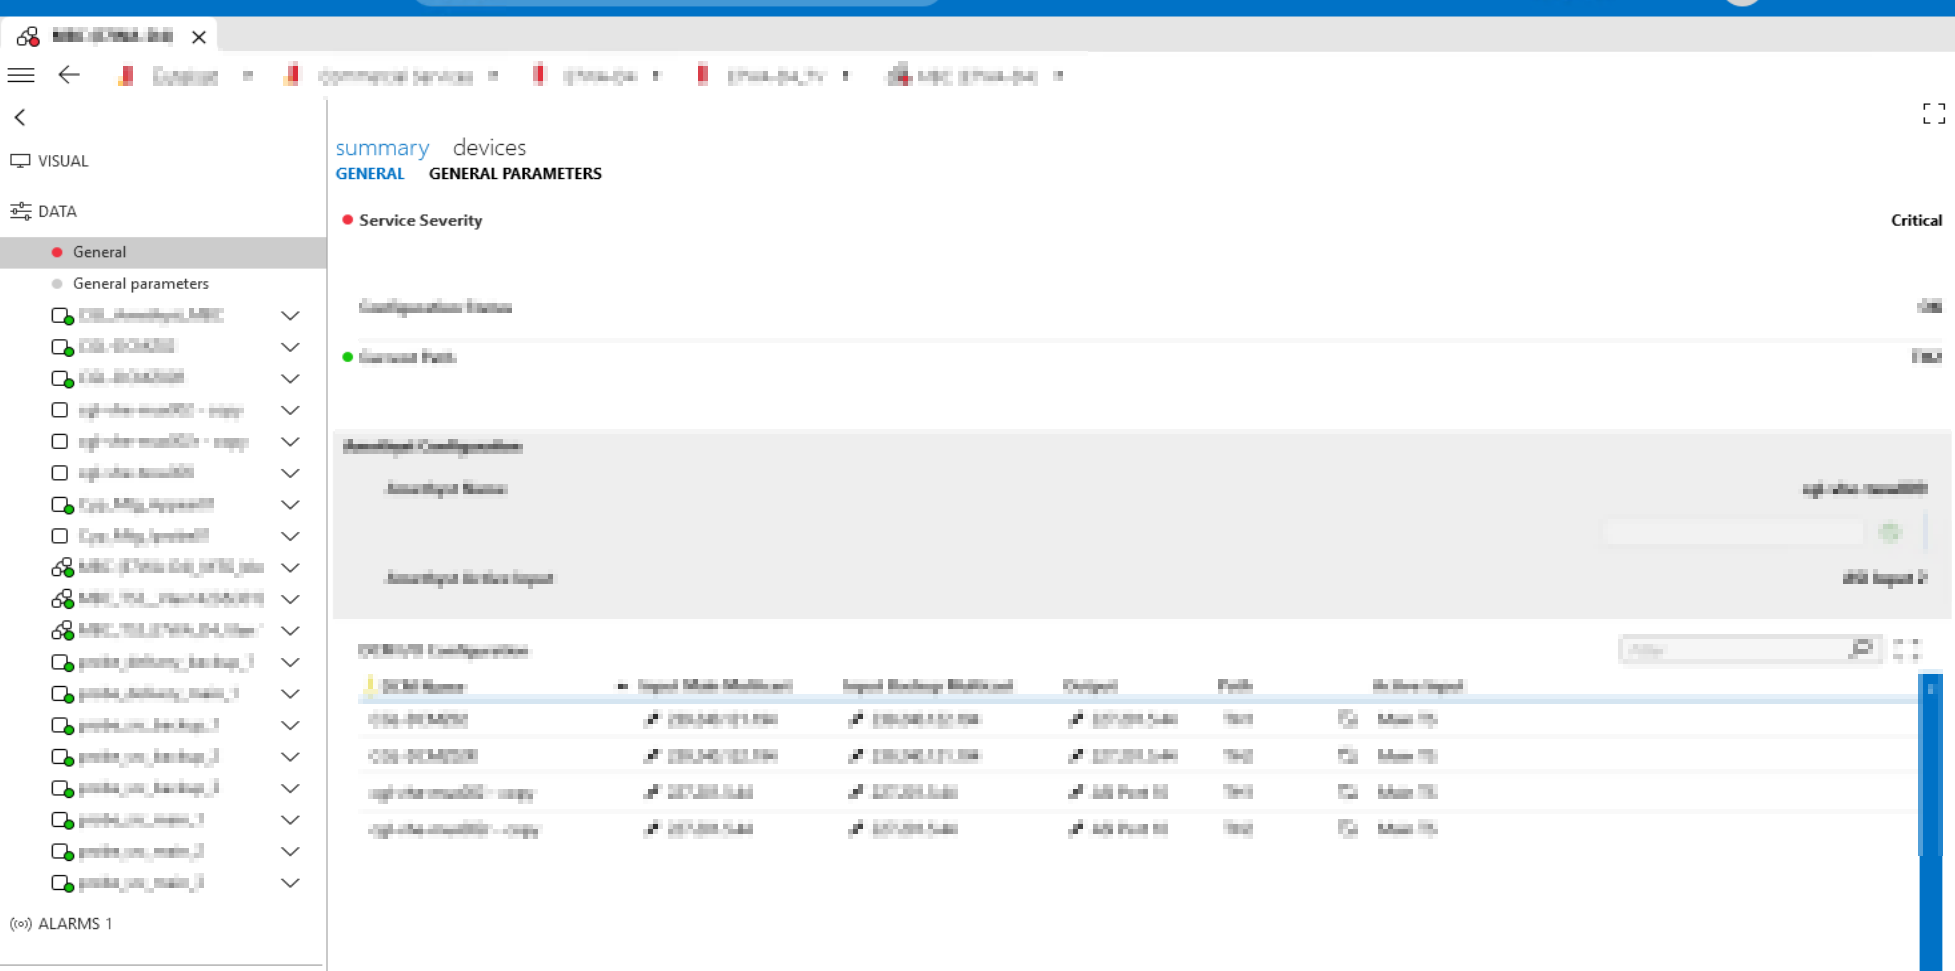
However, the reported value did not align with the actual status, as illustrated in the attached image (where the service “content” appears green, but the enhanced service is marked as red).

Sometimes, it appears there might be a software problem.
We notice rapid changes in the “Service Severity” parameter within a few milliseconds, causing the UI color to flicker too quickly. This results in a high number of SLNet messages, as indicated in the logs:
2023-11-02 14:45:47.800|40|Facade.HandleMessage|Incoming (Local SLNet): Parameter State: 1807/2964/2 -> Normal
2023-11-02 14:45:47.815|39|Facade.HandleMessage|Incoming (Local SLNet): Alarm: 107078016 (Critical) – 1807/(“serviceName”)/Service Severity at 11/02/2023 13:22:29 (services 1807/1763)
2023-11-02 14:45:47.815|39|Facade.HandleMessage|Incoming (Local SLNet): Parameter State: 1807/2964/2 -> Critical
2023-11-02 14:45:47.815|40|Facade.HandleMessage|Incoming (Local SLNet): Alarm: 107078017 (Normal) – 1807/(“serviceName”)/Service Severity at 11/02/2023 13:22:29 (services 1807/1763) [cleared]
(…)
This rapid toggling has a notable impact, making the cube almost unresponsive and flooding the SLNet log file with numerous alarm changes.
The question is then: How can I retrieve the severity of an enhanced service element, and why am I unable to use parameter ID 2 and set an alarm on it?
The parameter with ID 2 should not be monitored or set as this is managed by DataMiner. If you try to manipulate this value it could cascade into a infinite toggling of severities. By changing this value it could trigger a new alarm affecting the severity of the service and then also affecting the value you just set.
The reason behind this is because the parameter is part of an element that is always fully included in the service it is enhancing.
José sending a GetParameterMessage to retrieve the value should be OK. Since that is not setting or monitoring.
Hi Davy, thank you for getting back to me.
Following the removal of the alarm template associated with that parameter, the service transitioned from a “Critical” to a “Normal” state. Interestingly, even with this change, we maintained the ability to retrieve the alarm status in Visio using [this service].
Our initial attempt involved removing the parameter from the UI while keeping RTDisplay and onAppLevel set to true, but this resulted in the Visio color being grayed out. Subsequently, we added the parameter and the alarm template, but the desired functionality wasn’t achieved. Surprisingly, the issue was resolved by solely adding the parameter in the UI.
Hi Davy,
Thank you for your prompt response. In my particular use case, my goal is to retrieve the “Service Severity” of the enhanced service. Initially, I considered adding this parameter to an alarm template.
If this approach isn’t feasible, could you please suggest a more effective method for obtaining this information?
Thanks in advance