In an EPM environment, we typically have multiple back-end elements, aggregating KPI's at the lower levels of the topology, and a single front-end element, aggregating the top level KPI's.
As a result, when we monitor these KPI's, the resulting alarms can either originate from a back-end or front-end element.
We'd like to link any EPM alarm to the matching object in the topology diagram of the front-end element, through the alarm right-click menu, so that a user can see the full chain top to bottom, and not just the part exposed by the back-end element.
This is of course working fine for alarms generated by the the front-end element, but alarms generated by the back-end element are linked to the topology diagram of the backend-manager.
Is there any way to point these kind of alarms in the front-end topology, using the right-click menu?
Would it provide an alternative solution to work with the new EPM philosophy and work with system object cards instead of working through the front-end manager element?
It would then look like below:
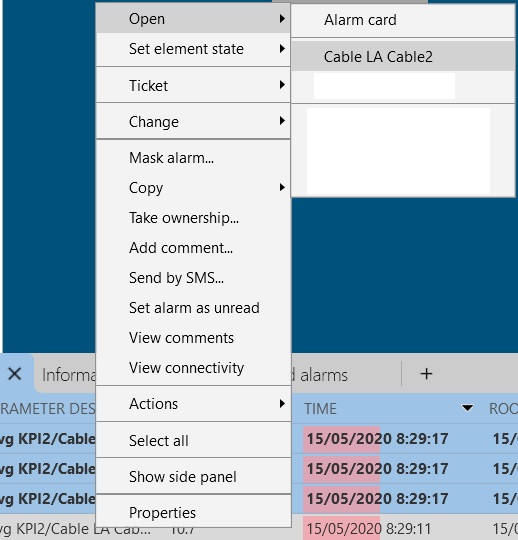
-First right-click on the alarm, then go to Open and select the system object name instead of the back-end element name

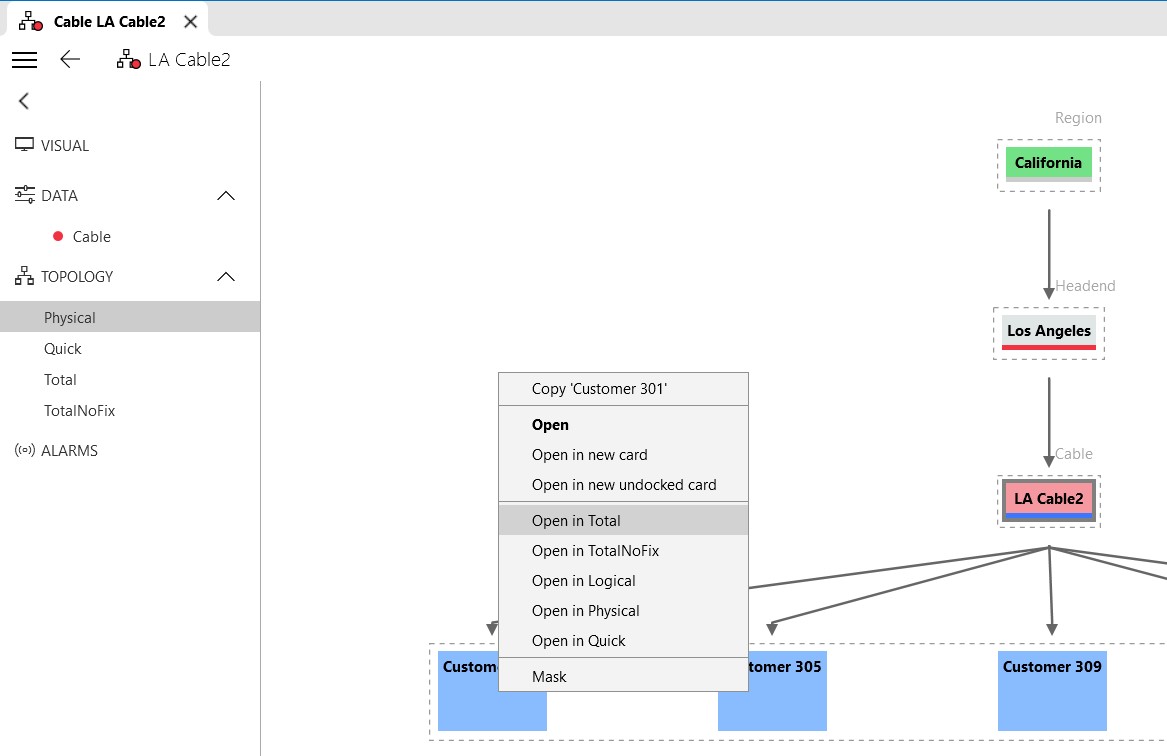
-This will open the card of the EPM System object, which shows the KPIs an single parameters in pages (similar like a normal element card), KPIs of child objects can be shown on a page in a table. The Topology is also available that shows the topology diagram. In that diagram it's possible to open other linked EPM objects or choose a specific chain via the context menu:

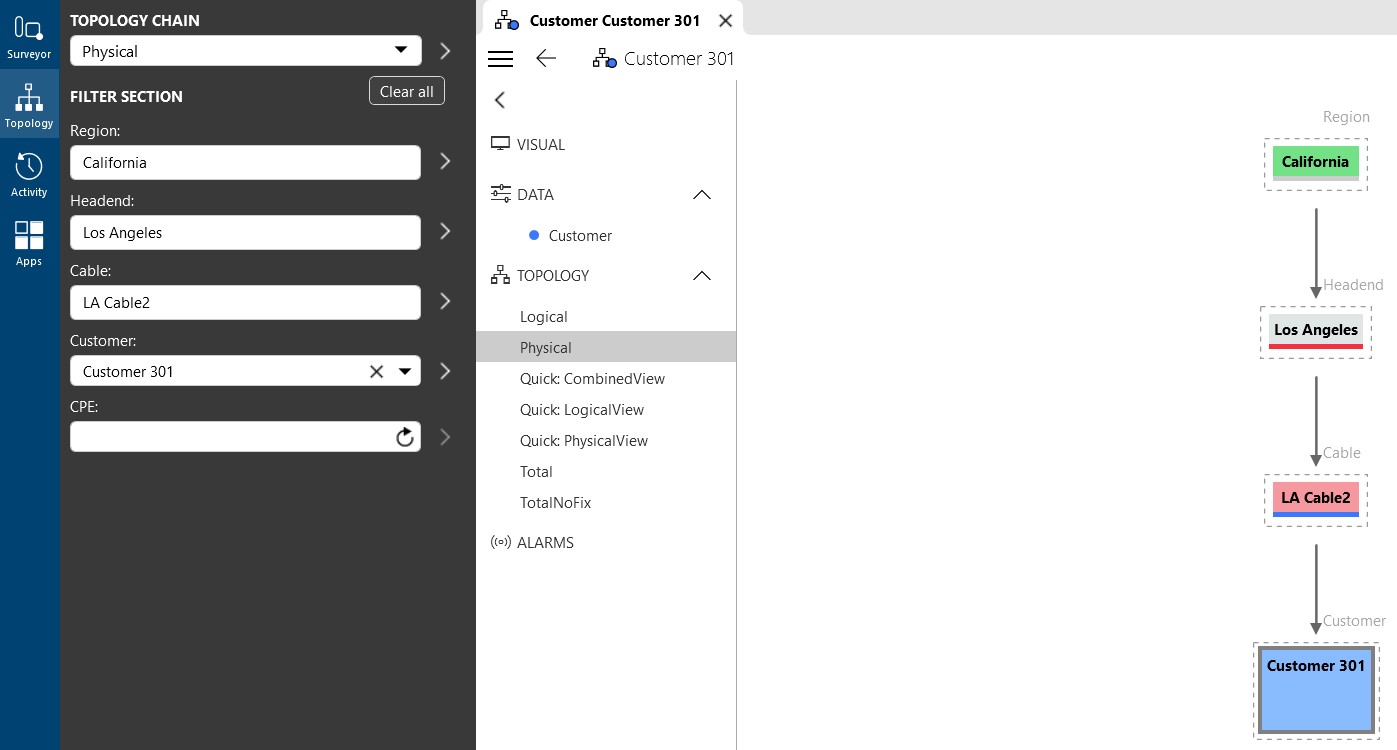
-Those opened cards are automatically linked with the topology filter that can be accessed next to the Surveyor button. From there the filter can be adapted to display other EPM System Object cards 
I had exactly the same reaction, you don’t have such situation when you use the new EPM philosophy.