Skip to content
DataMiner DoJo

More results...

Generic selectors
Exact matches only
Search in title
Search in content
Post Type Selectors
Search in posts
Search in pages
Search in posts
Search in pages
Log in
Menu
  • Updates & Insights
  • Questions
  • Learning
    • E-learning Courses
    • Empower Replay: Limited Edition
    • Tutorials
    • Open Classroom Training
    • Kanban workshop
    • Certification
      • DataMiner Fundamentals
      • DataMiner Configurator
      • DataMiner Automation
      • Scripts & Connectors Developer: HTTP Basics
      • Scripts & Connectors Developer: SNMP Basics
      • Visual Overview – Level 1
      • Verify a certificate
    • Video Library
    • Books We Like
    • >> Go to DataMiner Docs
  • Expert Center
    • Solutions & Use Cases
      • Solutions
      • Use Case Library
    • Markets & Industries
      • Media production
      • Government & defense
      • Content distribution
      • Service providers
      • Partners
      • OSS/BSS
    • Agile
      • Agile Webspace
      • Everything Agile
        • The Agile Manifesto
        • Best Practices
        • Retro Recipes
      • Methodologies
        • The Scrum Framework
        • Kanban
        • Extreme Programming
      • Roles
        • The Product Owner
        • The Agile Coach
        • The Quality & UX Coach (QX)
    • DataMiner DevOps Professional Program
      • About the DevOps Program
      • DataMiner DevOps Support
  • Downloads
  • More
    • DataMiner Releases & Updates
    • Feature Suggestions
    • Climb the leaderboard!
    • Swag Shop
    • Contact
    • Global Feedback Survey
  • Support
  • PARTNERS
    • All Partners
    • Technology Partners
    • Strategic Partner Program
    • Deal Registration
  • >> Go to dataminer.services

Element Data to Visual

49 views2nd June 2025elements shape data Visual Overview
0
Ryan Hepworth [DevOps Advocate]990 30th May 2025 0 Comments

Hi All

I am trying to show information from an element table onto an element based visual, in this instance the suppressed value(PID 4056).

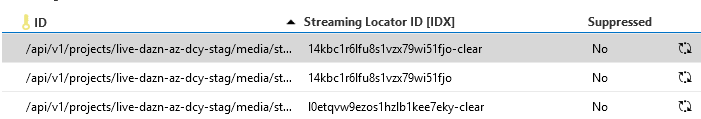
usually i would use Parameter shape data with 4056,[tableindex] however this doesn't work in this case. I have multiple panels on one visual so each panel will need to get its own information using Streaming Locator ID to define which row to use.

Does anyone know the best way to do this?

Thanks

Koen Bouckhout [SLC] [DevOps Advocate] Answered question 2nd June 2025

1 Answer

  • Active
  • Voted
  • Newest
  • Oldest
0
Koen Bouckhout [SLC] [DevOps Advocate]1.30K Posted 2nd June 2025 0 Comments

Hi Ryan,

The basic way of showing a parameter value on Visio is indeed by using a "Parameter" shape data with the value set to "ParameterID:TableRowKey" in case of a table parameter.

Linking a shape to an element parameter | DataMiner Docs

Note there are some variants that should use a "," in between the parameter ID and the Table Row key for example when using a wildcard or placeholder [property] / [param] to refer to the row key.

In your case, are you generating your shapes dynamically as child shapes from the table rows? And that is where you use the [tableindex] placeholder?

It might be good to paste a screenshot of your shape data to better assess where it is going wrong.

Koen Bouckhout [SLC] [DevOps Advocate] Answered question 2nd June 2025
Please login to be able to comment or post an answer.

My DevOps rank

DevOps Members get more insights on their profile page.

My user earnings

0 Dojo credits

Spend your credits in our swag shop.

0 Reputation points

Boost your reputation, climb the leaderboard.

Promo banner DataMiner DevOps Professiona Program
DataMiner Integration Studio (DIS)
Empower Katas
Privacy Policy • Terms & Conditions • Contact

© 2025 Skyline Communications. All rights reserved.

DOJO Q&A widget

Can't find what you need?

? Explore the Q&A DataMiner Docs

[ Placeholder content for popup link ] WordPress Download Manager - Best Download Management Plugin