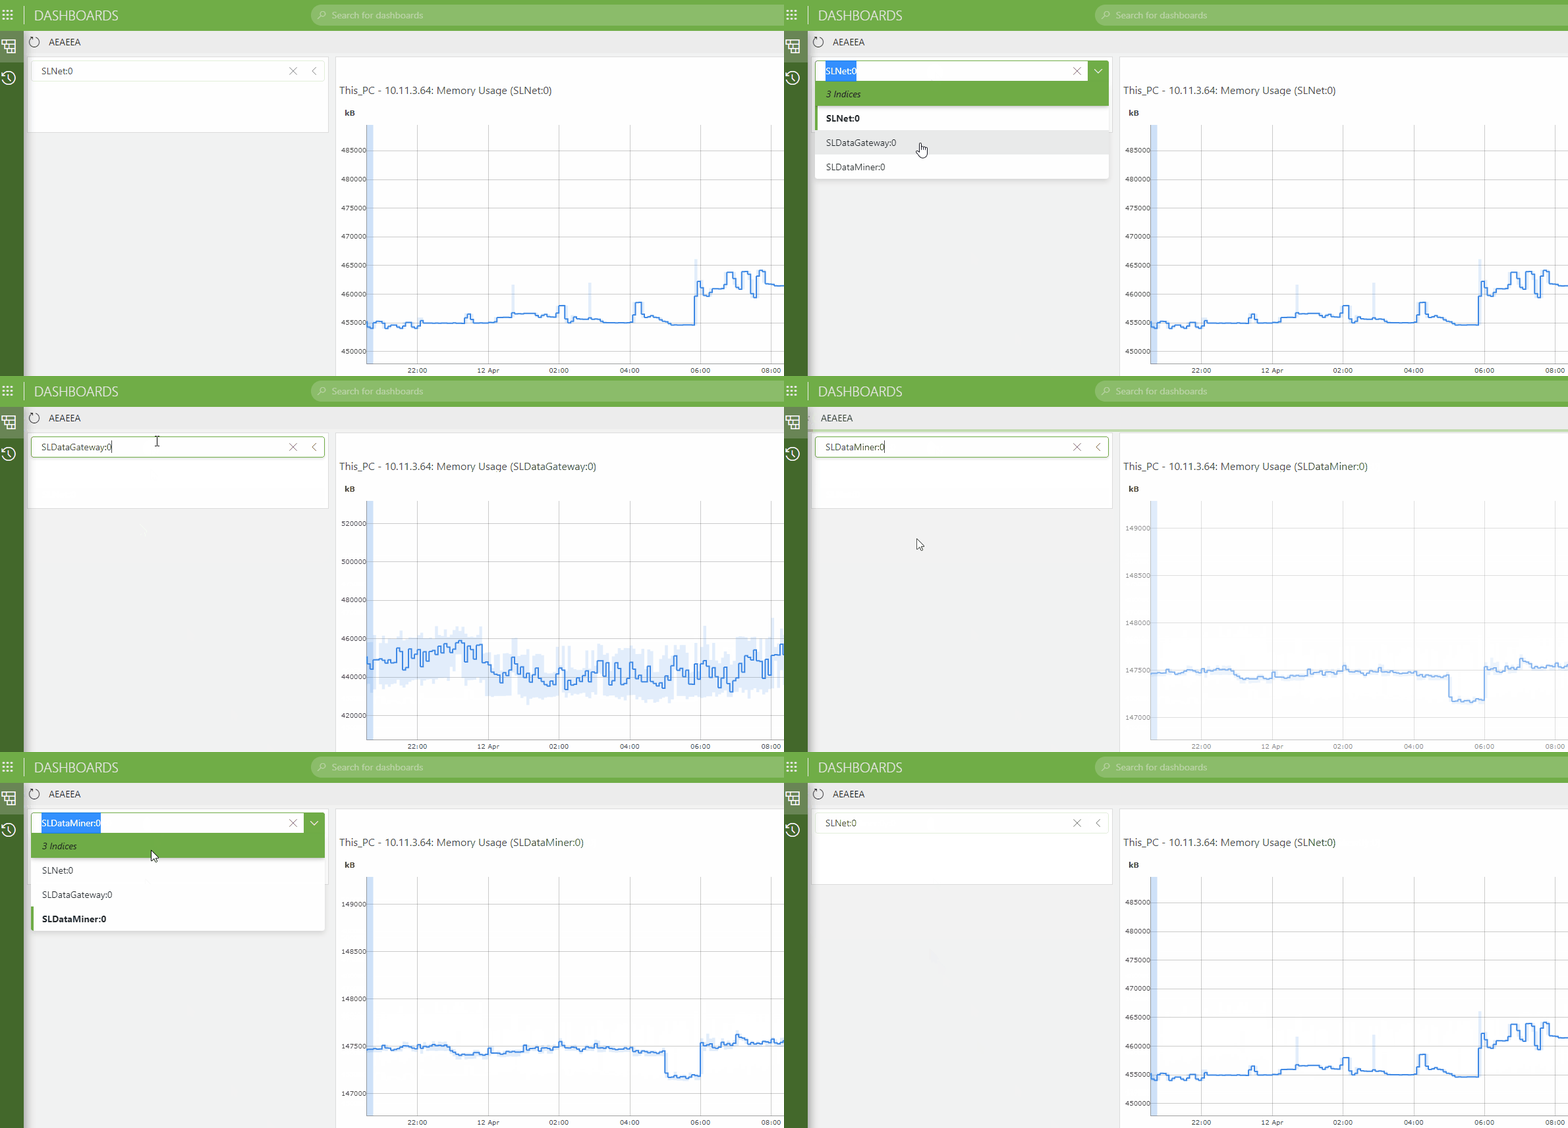
I have a parameter with 3 indices, showing 3 different values. In the dashboards web app, how can I select an index to display a trend graph?
Bethany Sheppard Selected answer as best
Hi Bethany,
You can easily achieve this in 3 steps:
- Add a drop down feed and give it some indices as data. You should see the display value of the indices in the drop down.
- Add a line chart and give it a trended parameter as data (the indices are of course part of the same table as this parameter). This will not show any data just yet since it doesn’t know for which index it needs to show data.
- Feed the indices as a filter on the line chart.
The result should be something like this:

Bethany Sheppard Posted new comment
Thank you