Skip to content
DataMiner DoJo

More results...

Generic selectors
Exact matches only
Search in title
Search in content
Post Type Selectors
Search in posts
Search in pages
Search in posts
Search in pages
Log in
Menu
  • Updates & Insights
  • Questions
  • Learning
    • E-learning Courses
    • Empower Replay: Limited Edition
    • Tutorials
    • Open Classroom Training
    • Kanban workshop
    • Certification
      • DataMiner Fundamentals
      • DataMiner Configurator
      • DataMiner Automation
      • Scripts & Connectors Developer: HTTP Basics
      • Scripts & Connectors Developer: SNMP Basics
      • Visual Overview – Level 1
      • Verify a certificate
    • Video Library
    • Books We Like
    • >> Go to DataMiner Docs
  • Expert Center
    • Solutions & Use Cases
      • Solutions
      • Use Case Library
    • Markets & Industries
      • Media production
      • Government & defense
      • Content distribution
      • Service providers
      • Partners
      • OSS/BSS
    • Agile
      • Agile Webspace
      • Everything Agile
        • The Agile Manifesto
        • Best Practices
        • Retro Recipes
      • Methodologies
        • The Scrum Framework
        • Kanban
        • Extreme Programming
      • Roles
        • The Product Owner
        • The Agile Coach
        • The Quality & UX Coach (QX)
    • DataMiner DevOps Professional Program
      • About the DevOps Program
      • DataMiner DevOps Support
  • Downloads
  • More
    • DataMiner Releases & Updates
    • Feature Suggestions
    • Climb the leaderboard!
    • Swag Shop
    • Contact
    • Global Feedback Survey
  • Support
  • PARTNERS
    • All Partners
    • Technology Partners
    • Strategic Partner Program
    • Deal Registration
  • >> Go to dataminer.services

Dashboards – frequently changing parameters are not readable (too many datapoints)

Solved1.05K views4th October 2021Dashboard App Dashboards trending
0
Alexander Gorbunov [SLC] [DevOps Advocate]988 4th October 2021 0 Comments

Hi Dojo,

I have difficulties displaying frequently changing parameters in Dashboards, both new and the legacy version. The problem is that with 5-minute average trending available, there are too many datapoints, and the resulting plot looks like a solid filled area. This gets even worse if I plot several parameters in one graph. See examples:


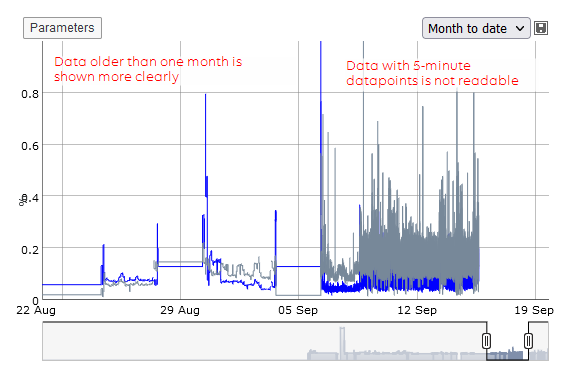
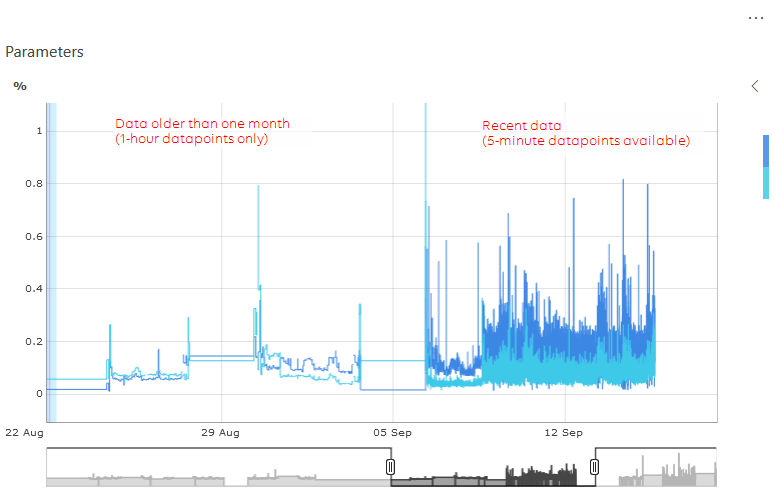
As you can see, when 5-minute datapoints expire and only 1-hour average data is present, the graphs are much clearer.

So the question is, is there a way to force Dashboard (old or new app) to use only 1-hour datapoints? Or are there other ways you could recommend to make these graphs more readable?

Thanks.

Alexander Gorbunov [SLC] [DevOps Advocate] Selected answer as best 4th October 2021

1 Answer

  • Active
  • Voted
  • Newest
  • Oldest
1
Wim Bruynooghe [SLC] [DevOps Advocate]6.59K Posted 4th October 2021 0 Comments

At the moment it’s not possible to configure this in Dashboards. However, it will automatically take 5-minute records or 60-minute records, depending on:

  • the selected timespan, it will use 60-minute records if the timespan is 48 hours or more, otherwise 5-minute records
  • which points there are available in the database (see trending settings in maintenancesettings.xml)

The result you get is not expected so this might be a software issue.

Alexander Gorbunov [SLC] [DevOps Advocate] Selected answer as best 4th October 2021
Please login to be able to comment or post an answer.

My DevOps rank

DevOps Members get more insights on their profile page.

My user earnings

0 Dojo credits

Spend your credits in our swag shop.

0 Reputation points

Boost your reputation, climb the leaderboard.

Promo banner DataMiner DevOps Professiona Program
DataMiner Integration Studio (DIS)
Empower Katas
Privacy Policy • Terms & Conditions • Contact

© 2025 Skyline Communications. All rights reserved.

DOJO Q&A widget

Can't find what you need?

? Explore the Q&A DataMiner Docs