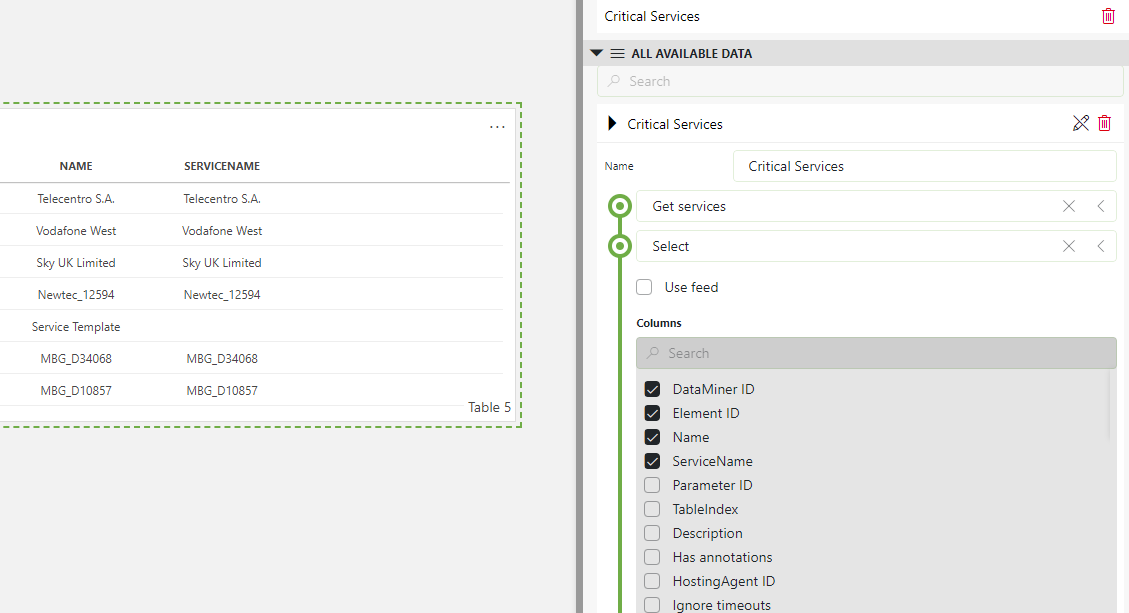
For a specific use case, I need to create a dashboard that could give me a preview of all services in a critical state.
To achieve it, I tried to drag and drop the services and start to play with the associated filters. But none of them allow me to filter by state. I also tried to create a query and returned the services with the critical state.

Again, I can have visibility of all services but I can't access the state of the service.
Any suggestions to be able to implement this visualization via dashboards?
Hi André,
Adding a state/severity column for services, views and elements is on the roadmap and should be added in the near future. This column can then be used for all known GQI operators (filtering, aggregating, etc).