Hi,
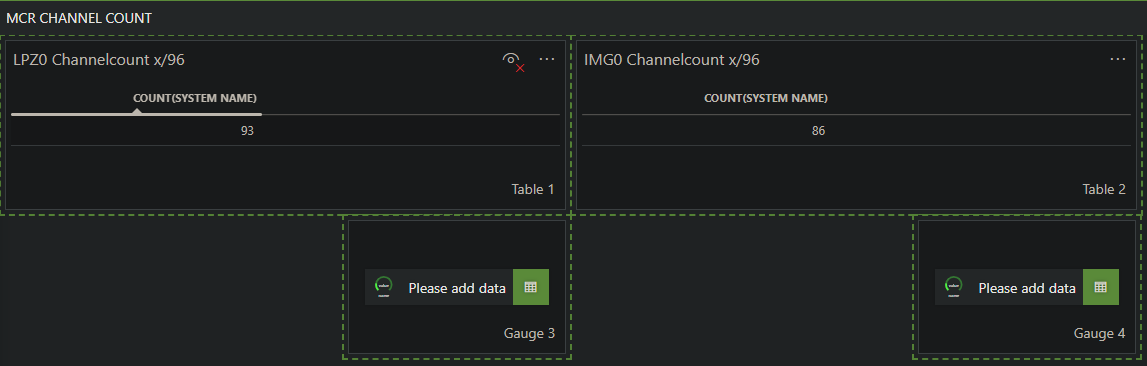
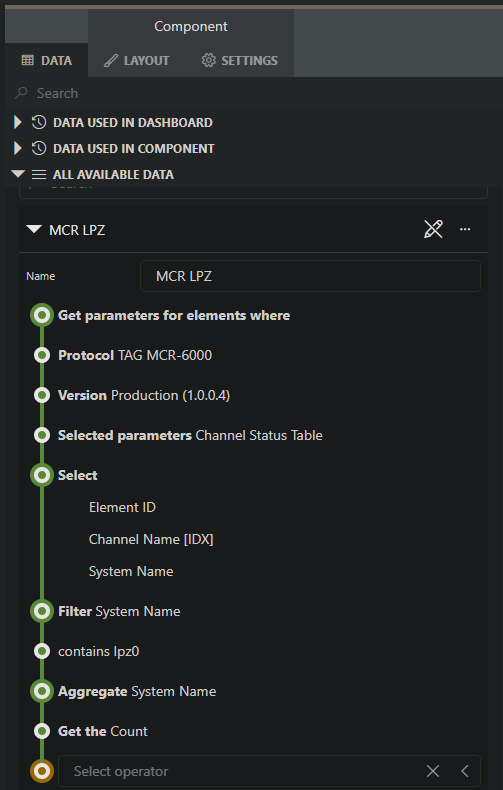
i used a query (see below, query for LPZ0) to count Channels per MCR Device (LPZ0 / IMG0) and visualized it in a table (table 1 for LPZ0).
For a better visualization i want to display a Gauge with the counted Channels and show the maximum Channels (for example LPZ0: Count is 93 and the maximum number of channels is 96).
I didnt see a way to create a Gauge adding the count as data and I didnt see a way to set a maximum to a Gauge.
Is there a way to visualize it with a Gauge?
Marieke Goethals [SLC] [DevOps Catalyst] Selected answer as best
Hi Thomas,
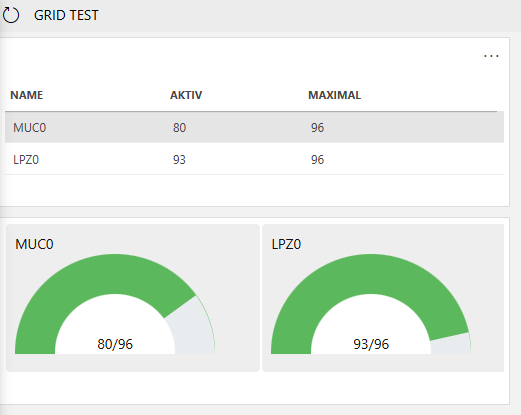
as Wout mentioned, you could customize e.g. the grid component with your own code.
Even it is not optimized, here an example using the grid component:
Cheers,
Felix
Felix Wesemeier [DevOps Catalyst] Answered question