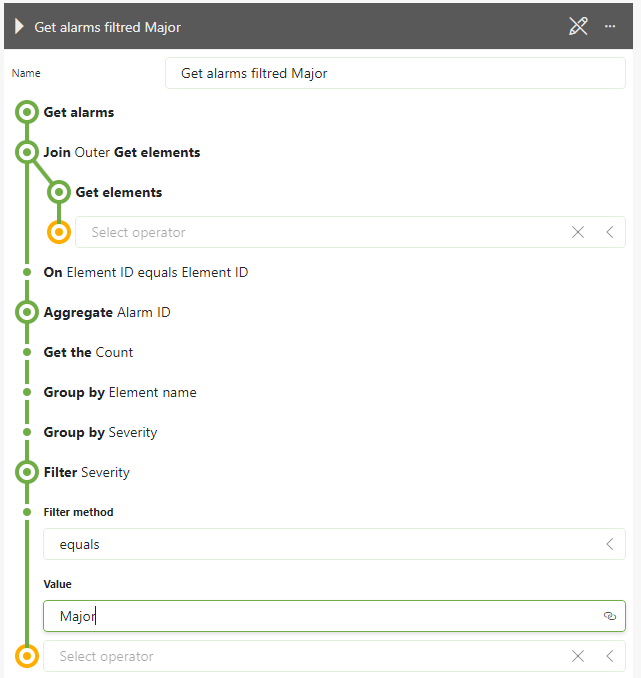
Hi Dojo community!
I am encountering difficulties manipulating a query. I notice that I am unable to sort, group, or even count the elements. It takes a lot of time, and I don’t get any results in the end. I am trying to understand the reason for this issue.
I am currently using version 10.3.0.0. I have also tried to do the same with the latest version, but I usually get a timeout error, as shown in the attached screenshot.
What I am trying to get is the number of alarm filtered by severity for each element name in version 10.3.0.0 to represent it in a graph.
Thank you in advance for your help!


Hi Yahya,
What you are experiencing is the 30s request timeout of the cloud when accessing dashboards using dataminer.services. The specific cause here is your query that requests data, but doesn’t retrieve a result in this time.
Looking at your query, it can be changed a bit to retrieve data much faster. Aggregating on all alarms in your DMS can take quite a lot of time since a lot of data has to be retrieved. Adding a filter on the root time of the alarm will reduce the amount of data that has to be fetched. It might still take more than 30s after the filter is added.
To achieve better performance, you can make use of an Ad Hoc Data source. These sources will only request the exact data that is needed and can therefore be faster. We already have some existing sources/packages that you can take a look at:
- Alarm report queries (also on the catalog)
- Highest severity alarm count per view
I added a time filter as suggested, and now it works within the 30-second timeout period.
Thank you Wout!