Hi Dojo,
currently we are trying to monitor the "Physical Ports" of a Nimbra node with DataMiner (10.5.0), without success. The table is available in the related element page, but not in the alarm template (see screenshots below).
Although I checked everything I could in the element, in the alarm template and in the connector xml, I wasn’t able to figure out the problem.
Maybe I’m missing something. Any suggestions? Can anyone help?
Thanks
Jörg


Hi Jörg
As the Interfaces of the Physical Ports is a view (param 24000), you could modify the "real" parameter 22005 with adding an Alarm - element in the connector.
<Param id="22005" trending="false" duplicateAs="24005">
<Name>ifOperStatus</Name>
<Description>Operational Status (Interface Information)</Description>
...
<Type>read</Type>
<Interprete>
<RawType>numeric text</RawType>
<Type>double</Type>
<LengthType>next param</LengthType>
</Interprete>
<Alarm>
<Monitored>true</Monitored>
</Alarm>
...
Now you can enable the alarming in the alarm-template:
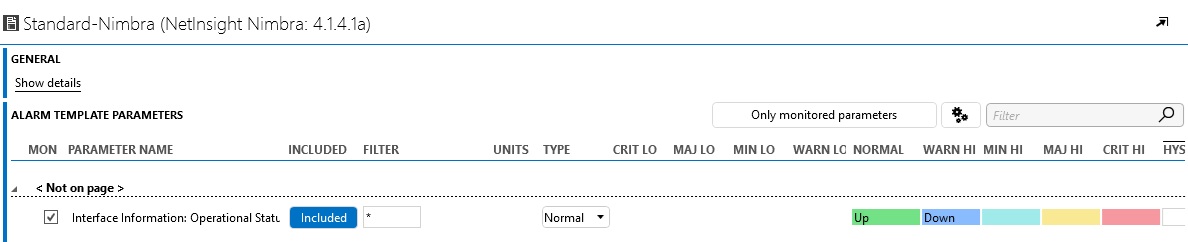
@Skyline: It would be great, if you could add the <Alarm> element in the official connector, please?