Hi Dojo team,
We are planning to process traps from multiple Network Management Systems. Given the potentially high volume of traps generated by these platforms, we are reviewing the DataMiner Metrics. In particular, we came across the following benchmarks related to SNMP traps:
- Number of SNMP traps per second received on a DMA continuously: 100
- Number of SNMP traps per second received on a DMA in burst mode: 400
What is the difference between these two metrics? Specifically, how 'burst mode' is defined and what is the typical duration?
To ensure that the volume of processed traps remains within these limits, we plan to implement these metrics in the connectors (measuring the amount of traps per second that arrives to an element).
However, before to proceed with this update, is there a log file that we can use to determine the amount of traps received per DMA? If there is a log file that provides this information, I believe it will not be required to update the connector.
Thanks.
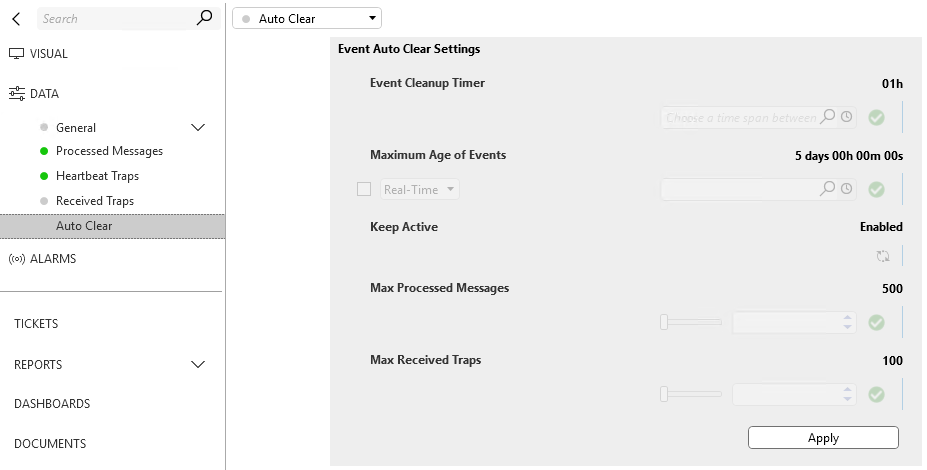
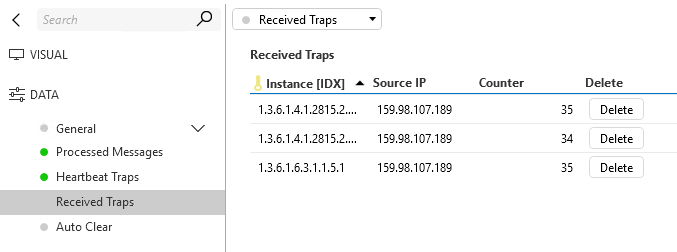
I realize this might not answer your question but can help you with testing and showcase the traps received with the Generic Trap Processor connector. It has counters for each source you define that represents where traps are coming from. Just check the config page and validate the retention is opened up as the defaults might impact your testing and be too restrictive. The connector and solution are both available in our catalog, solution shared below.
Smart Trap Processor | Catalog | dataminer.services