Skip to content
DataMiner DoJo

More results...

Generic selectors
Exact matches only
Search in title
Search in content
Post Type Selectors
Search in posts
Search in pages
Search in posts
Search in pages
Log in
Menu
  • Updates & Insights
  • Questions
  • Learning
    • E-learning Courses
    • Empower Replay: Limited Edition
    • Tutorials
    • Open Classroom Training
    • Agility
      • Kanban workshop
      • Agile Fundamentals
    • Certification
      • DataMiner Fundamentals
      • DataMiner Configurator
      • DataMiner Automation
      • Scripts & Connectors Developer: HTTP Basics
      • Scripts & Connectors Developer: SNMP Basics
      • Visual Overview – Level 1
      • Verify a certificate
    • Video Library
    • Books We Like
    • >> Go to DataMiner Docs
  • Expert Center
    • Solutions & Use Cases
      • Solutions
      • Use Case Library
    • Markets & Industries
      • Media production
      • Government & defense
      • Content distribution
      • Service providers
      • Partners
      • OSS/BSS
    • Agile
      • Agile Webspace
      • Everything Agile
        • The Agile Manifesto
        • Best Practices
        • Retro Recipes
      • Methodologies
        • The Scrum Framework
        • Kanban
        • Extreme Programming
      • Roles
        • The Product Owner
        • The Agile Coach
        • The Quality & UX Coach (QX)
    • DataMiner DevOps Professional Program
      • About the DevOps Program
      • DataMiner DevOps Support
  • Downloads
  • More
    • Feature Suggestions
    • Climb the leaderboard!
    • Swag Shop
    • Contact
    • Global Feedback Survey
  • Support
  • PARTNERS
    • All Partners
    • Technology Partners
    • Strategic Partner Program
    • Deal Registration
  • >> Go to dataminer.services

Chart and 10.2

Solved1.06K views20th April 2022
0
joel Joly489 4th April 2022 0 Comments

Hello DOJO

since we have upgraded from 9.6 to 10.2, graph functionality doesn’t seem to work properly from our views

One example:

we want to display a graph related to a table (daily availability column, parameter 1025)

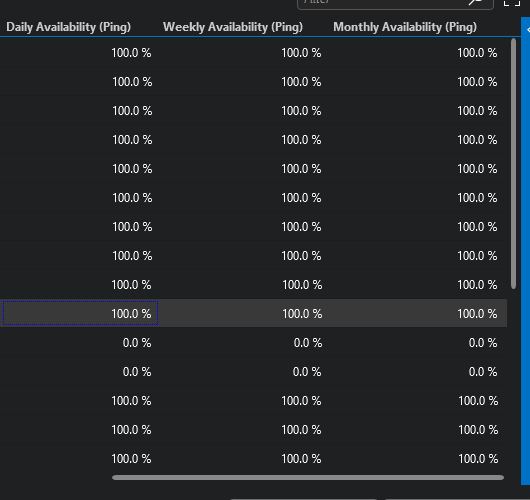
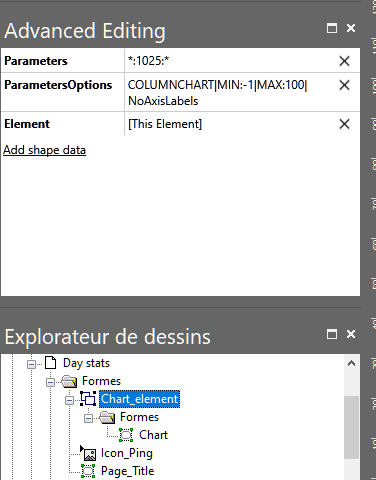
The table have 24 rows, but only 2 bars are displayed inside graph for the 1025 column in day stats page

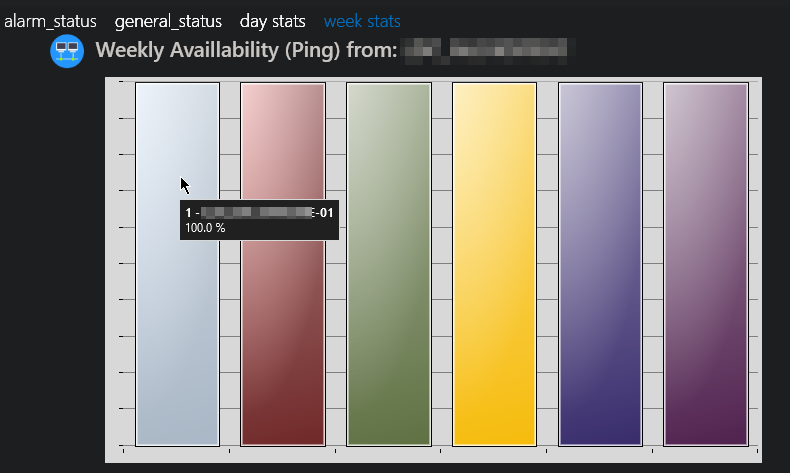
only 6 bars are displayed inside graph for the column 1026 in week stats page

I read again the chapter : Creating a parameter chart documentation, but  I didn’t see anything new.
In fact I can see the number of bar displayed increase if I stay on page and when an update is done on row value inside database. If row is never updated, I will never see it

Does anyone know if an adaptation is needed in the Visio settings.

joel Joly Selected answer as best 20th April 2022

1 Answer

  • Active
  • Voted
  • Newest
  • Oldest
1
Matthias Declerck [SLC] [DevOps Advocate]2.77K Posted 6th April 2022 2 Comments

Hi joel,

It looks that the server behaves differently between 10.1.0 and 10.2.0.0 when it comes to sending  initial table updates to client with column wildcard filtering.
I simply did the following test to experience the results:
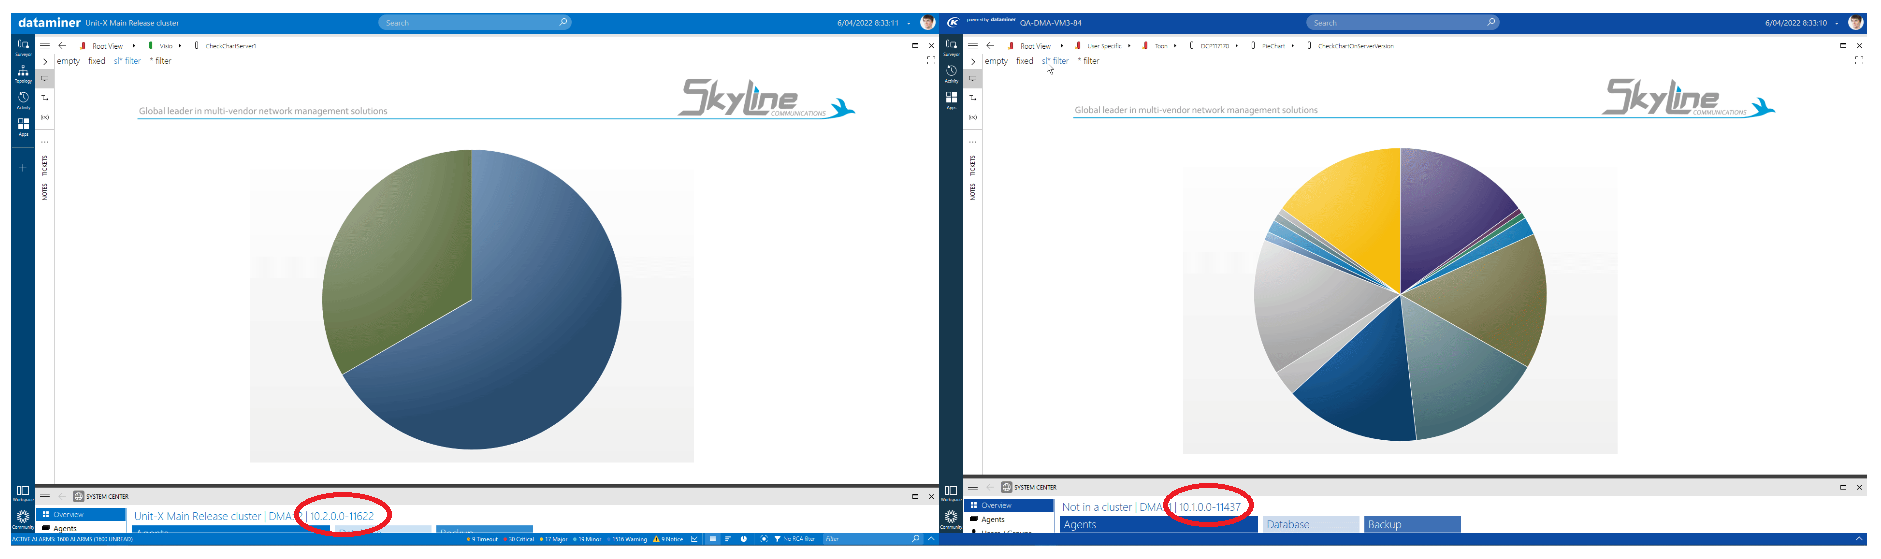
– created 3 pie charts, each subscribing to the Task Manager CPU column.
1. filter on SLD* and SLS* rows
2. filter on SL* rows
3. filter on * rows
– the test is done on latest 10.1 and 10.2 versions

In 10.1, the initial update is sent to the client. (same behavior s 9.6 and 10.0)
In 10.2, only parameter changes are sent to the client.

I could not upload the GIF, but took the chance of creating a screenshot as well:

joel Joly Selected answer as best 20th April 2022
joel Joly commented 6th April 2022

Thank you Matthias

So if I understand correctly, it means that this behavior is normal.
From 10.2, it is not possible to have a graph with the initial values from a table.
It’s just possible to have the values that are refreshed.
The problem is that sometime the refresh rate is long or there is no modification done between each refresh , like a ping successful, or a available space on a disk .
So in this case the graph is not very useful because most of time empty.
Is it a bug or is it the way we will work in the future ?

Matthias Declerck [SLC] [DevOps Advocate] commented 6th April 2022

I have contacted core development and they encountered this as well.
In short, this is a side effect with a new feature called ‘parameter throttling’.
A task is created to fix this problem: https://collaboration.dataminer.services/task/182626
If needed, you can subscribe on the task. Thanks for reporting, joel!

Please login to be able to comment or post an answer.

My DevOps rank

DevOps Members get more insights on their profile page.

My user earnings

0 Dojo credits

Spend your credits in our swag shop.

0 Reputation points

Boost your reputation, climb the leaderboard.

Promo banner DataMiner DevOps Professiona Program
DataMiner Integration Studio (DIS)
Empower Katas
Privacy Policy • Terms & Conditions • Contact

© 2025 Skyline Communications. All rights reserved.

DOJO Q&A widget

Can't find what you need?

? Explore the Q&A DataMiner Docs