Hello
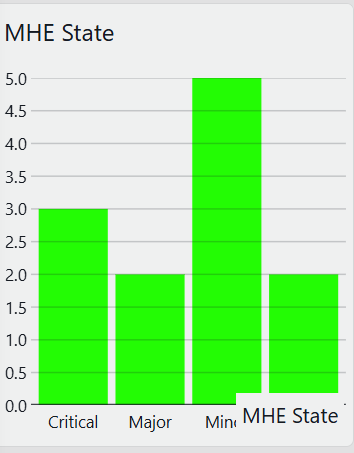
It's posible use conditional color to fill the severities for each bar?
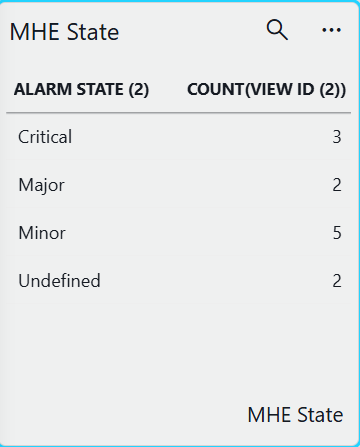
the values comes from a table procesed wirh Querys, the severities are rows and the total is one column.
Thanks
Hi Juan,
This is possible, but this functionality is currently limited. The coloring of the bars is based on the column, not the rows. This means that to give each bar a specific color, you would need to have the alarm state counts in different columns. Then you can use the conditional coloring in the component theme to color the bars based on the column names.
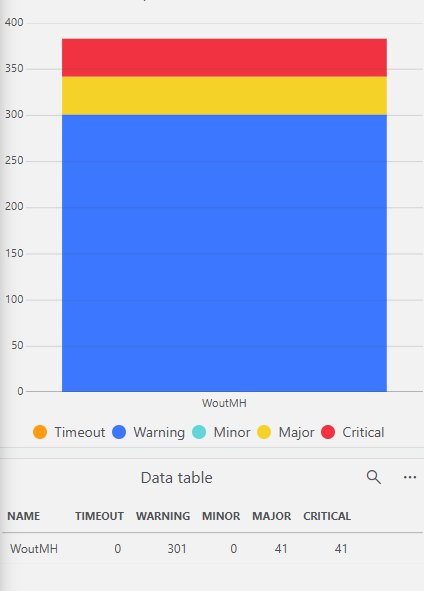
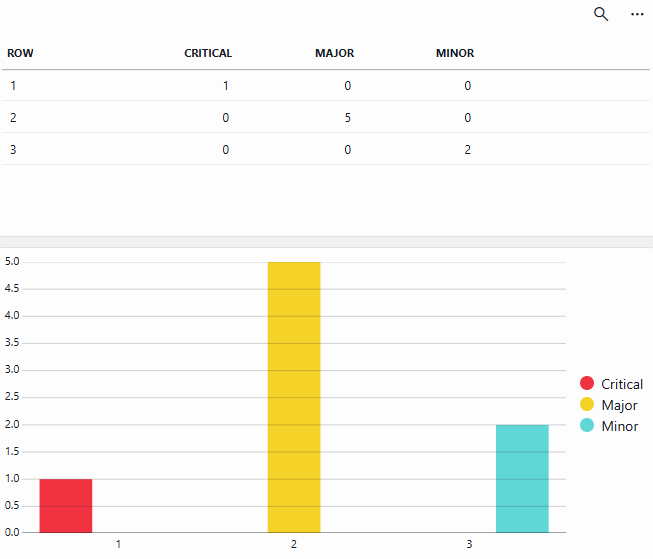
As you can see in the example above, this approach also means that the bars will be stacked since each row normally represents 1 bar and now we only have row. To fix this, you can also create 1 row for each count. The downside there is that you will see 'empty' bars which leave big gaps in the chart.
Feel free to create a feature suggestion to improve this existing behavior.
Hi Juan,
I could not come up with an easy way to do this based on your table. The best way to implement this would be to create an ad hoc data source to fetch & transform the data from scratch.
Hello Wout
witch will be the best practice to transform the table with two columns into a columns severities? i think a can it with join on the same table but i dont know if is the best way.
Thanks