Hi Dojo,
I'm looking for the best way to show the average value of a trended value like in the statistics:
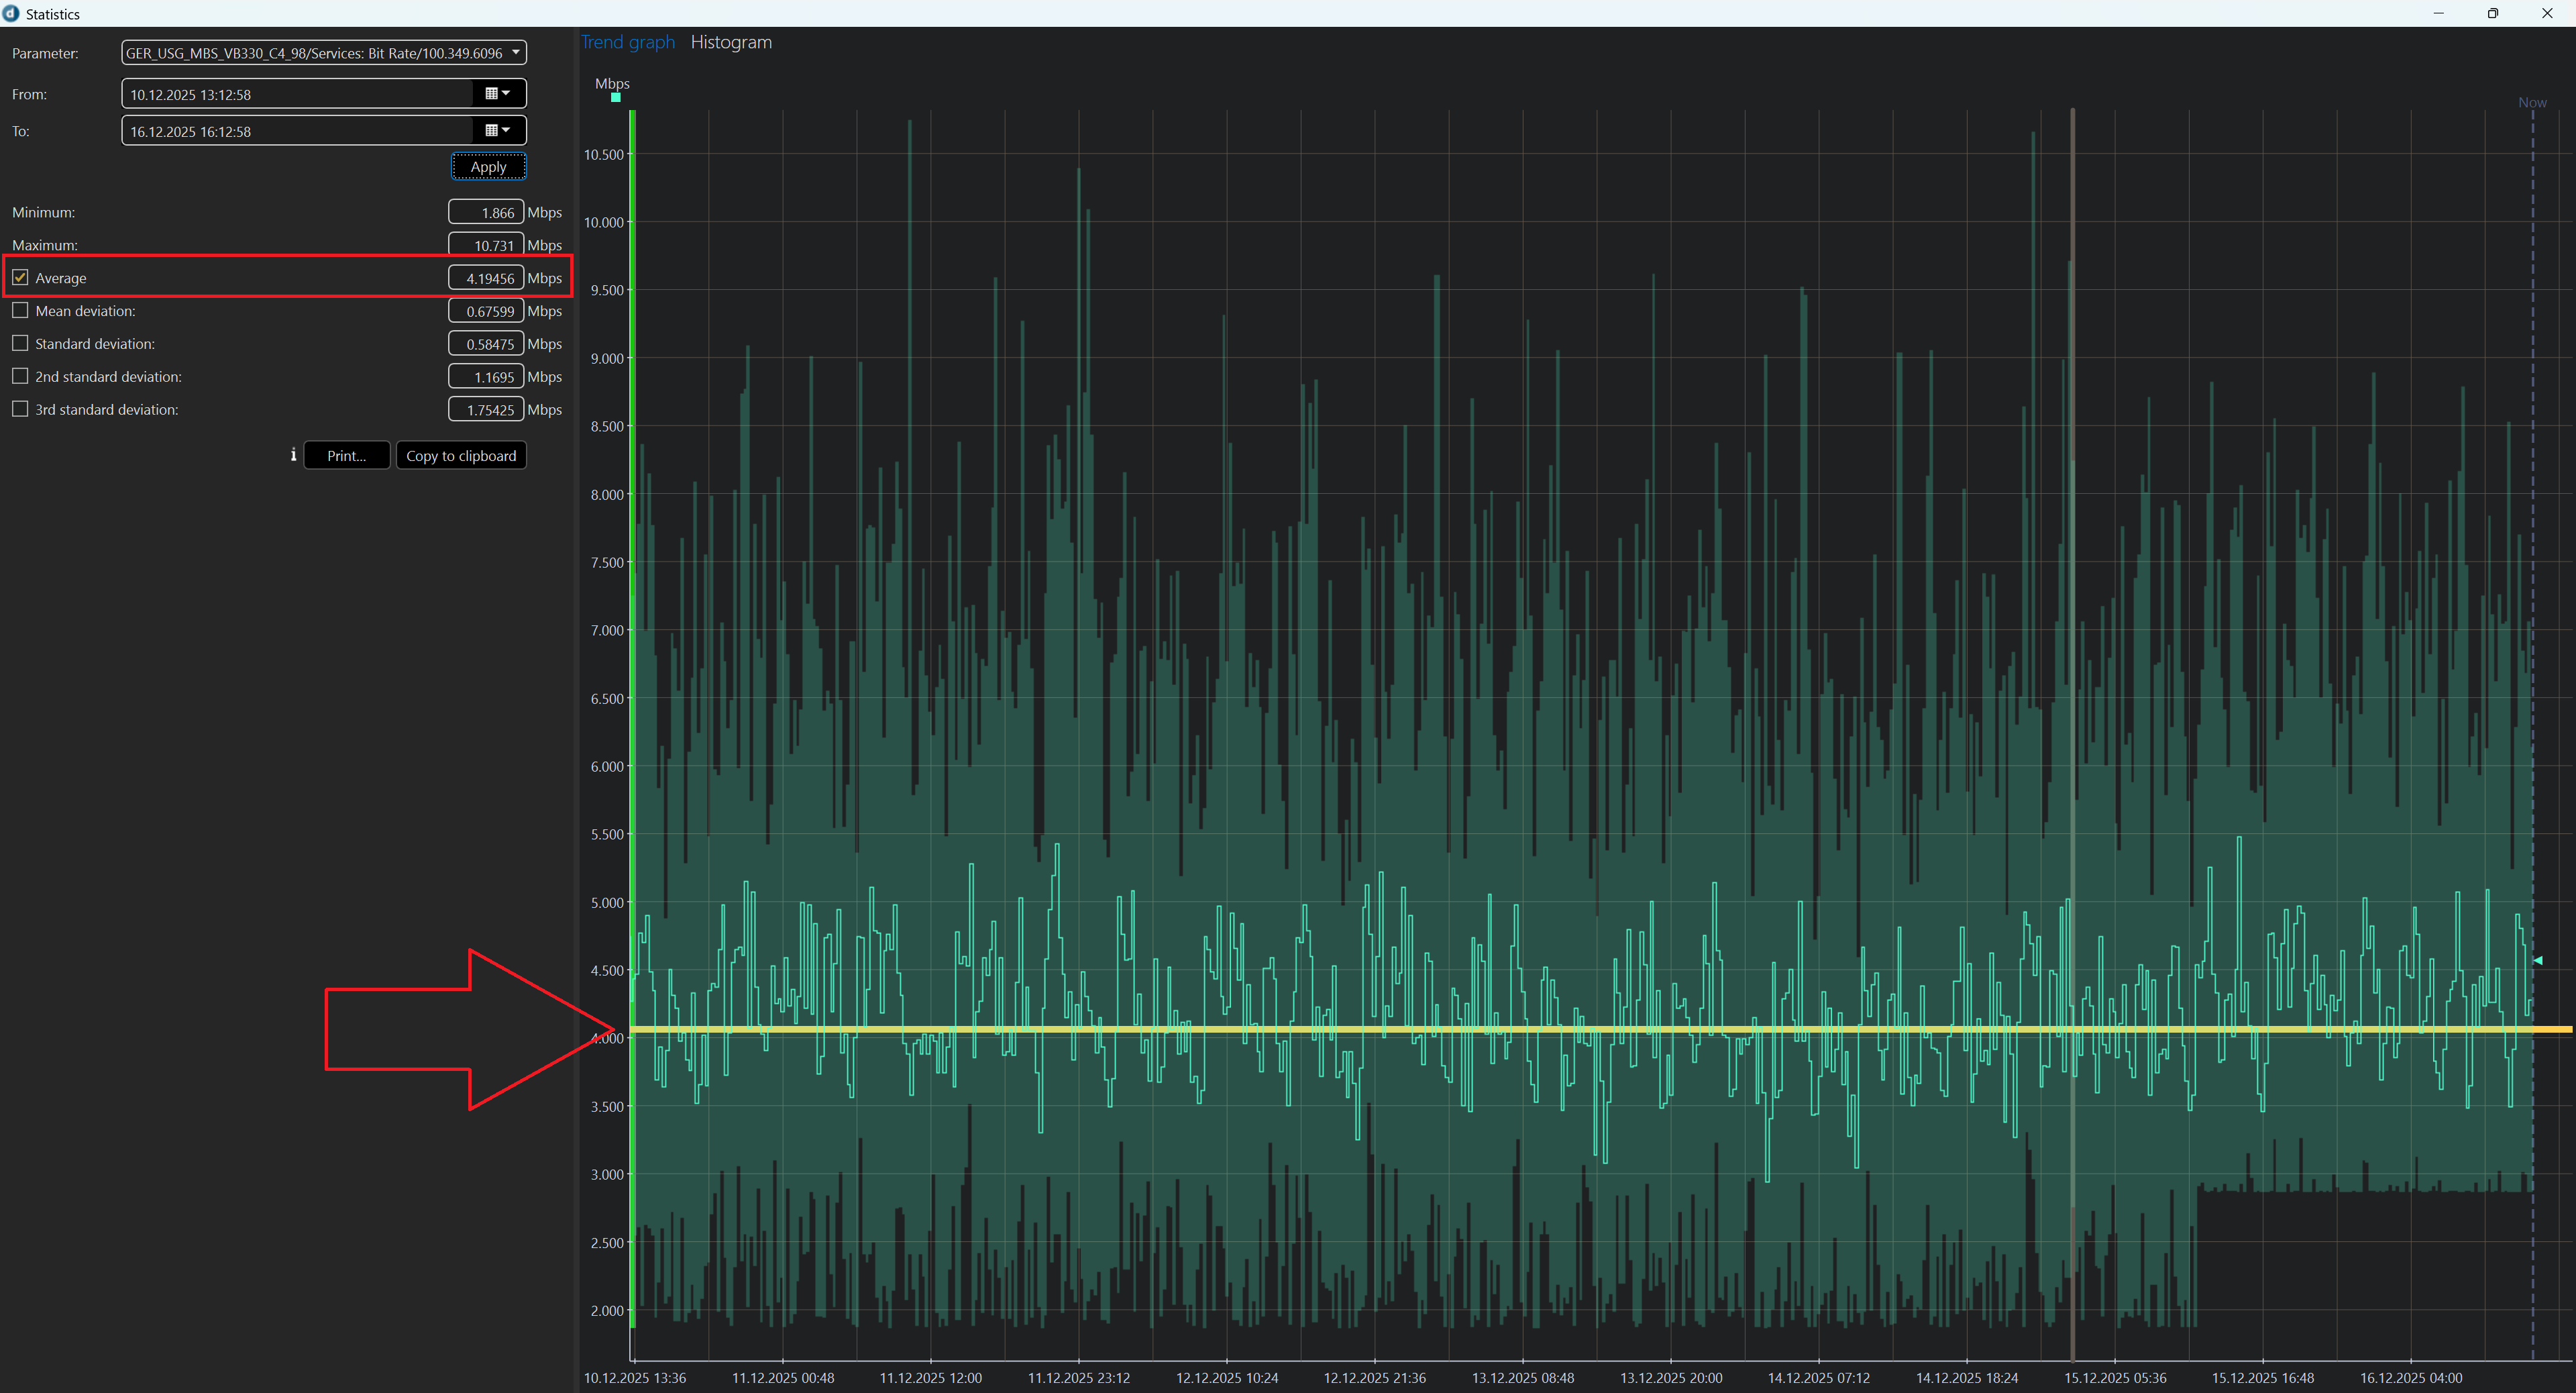
Is this possible in a Visio drawing or in a dashboard? Right now I haven't found a solution.
In Visio I could create a trend component and the user has to go to statistics manually. From the time would be a week, month for example.
Example Visio with automation script:
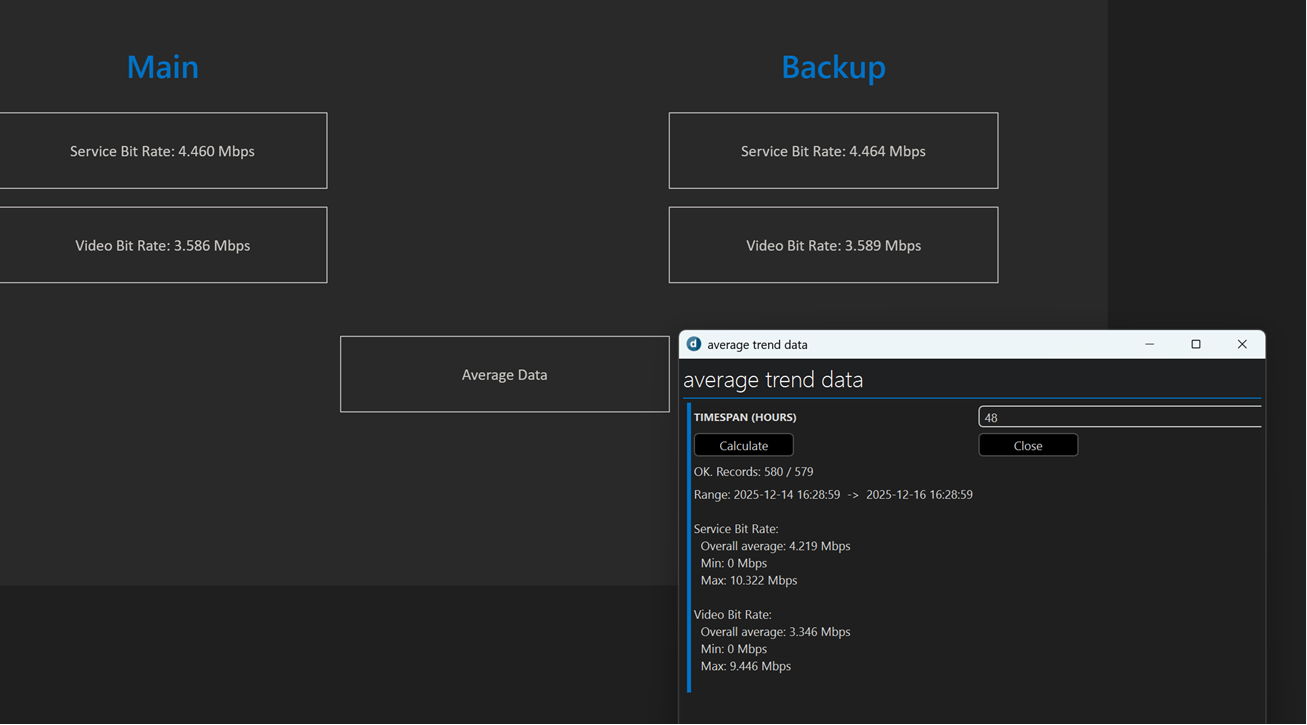
RDashboard like from Ben:
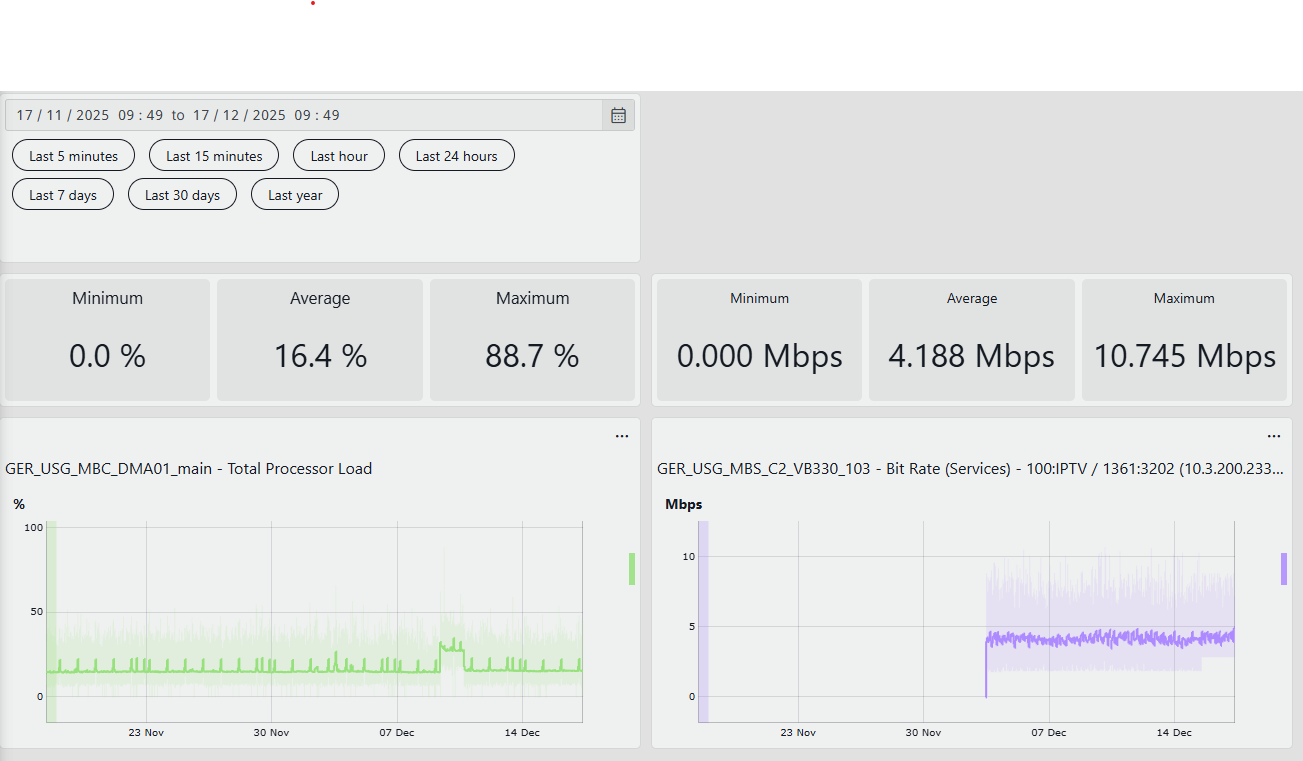
At this solution I have not used QUERIES because somehow it's not recognizing the trend ability. If you use Parameters directly it's working like a charme.
Stefan Schedletzky [DevOps Advocate] Selected answer as best
Screen gif related to a comment on the other thread: 
Ben Vandenberghe [SLC] [DevOps Advocate] Posted new comment
Thanks, great to hear it worked out!
Ben, thank you very much. I have updated my original post and could achieve the same and added my findings.