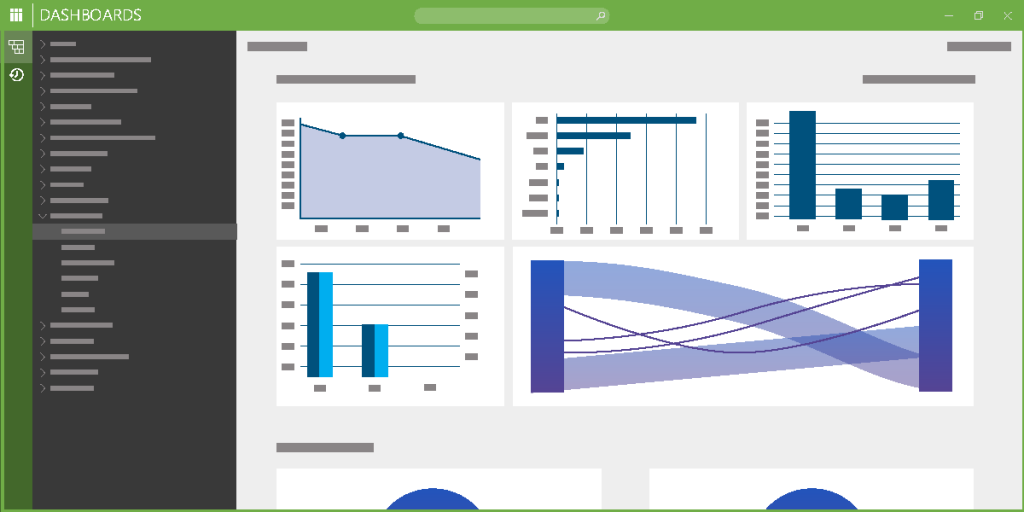
Do you want to learn more about DataMiner Dashboards and its capabilities? Then we have good news for you.
We have just released 17 new videos in the Dashboards course. That gives you 73 minutes of content. Did you know that our learning team is creating digestible videos so you don’t need to watch those 73 minutes of content at a time? The content is also easy to absorb and is divided into specific topics.

The topics that just have been released are:
Dashboard data: in this session you will learn how to discover the app itself, so that you can map this to your own DataMiner version.
- Bookings
- Protocols
Visualizations: this session starts from the available visualizations in DataMiner Dashboards, showing what data each of these can visualize.
- Introduction
- Basic visualization
- State & value
- Tables
- Charts
- Other types of visualizations
Making it dynamic: this session shows how to make a dashboard dynamic with feeds.
- Feed DataSource
- Basic feed visualizations
- Feed & filters
- URL feeds
- TimeRange feed
- Multiple parameter feed
- CPE feed
- Hybrid components
Happy learning!
The Dojo learning team
With Feeds being retired https://community.dataminer.services/say-goodbye-to-feeds-say-hello-to-flows-and-variables/?hilite=dashboard+flows
Will the Making it dynamic section be updated for dashboards?