For a long time, DataMiner Spectrum Analysis has stood as a pivotal feature for monitoring your operating spectrum within the DataMiner System. Recently, we have streamlined the Spectrum Analysis user interface to make navigating your spectrum analyzer traces easier and faster than ever before. You can now make small changes with high precision and execute big changes faster, all with minimal visual impact.
Over the recent DataMiner upgrades, several noteworthy enhancements have transformed the Spectrum Analysis UI. Below, we provide a convenient overview of all these changes, accompanied by illustrative GIFs for a clear visual representation.
Frequency adjustments
In the past, frequency adjustments were confined to the settings pane to the right of the display section. With our latest enhancements to the Spectrum Analysis UI, you can now effortlessly make frequency adjustments using more intuitive alternatives, enhancing the overall user experience.
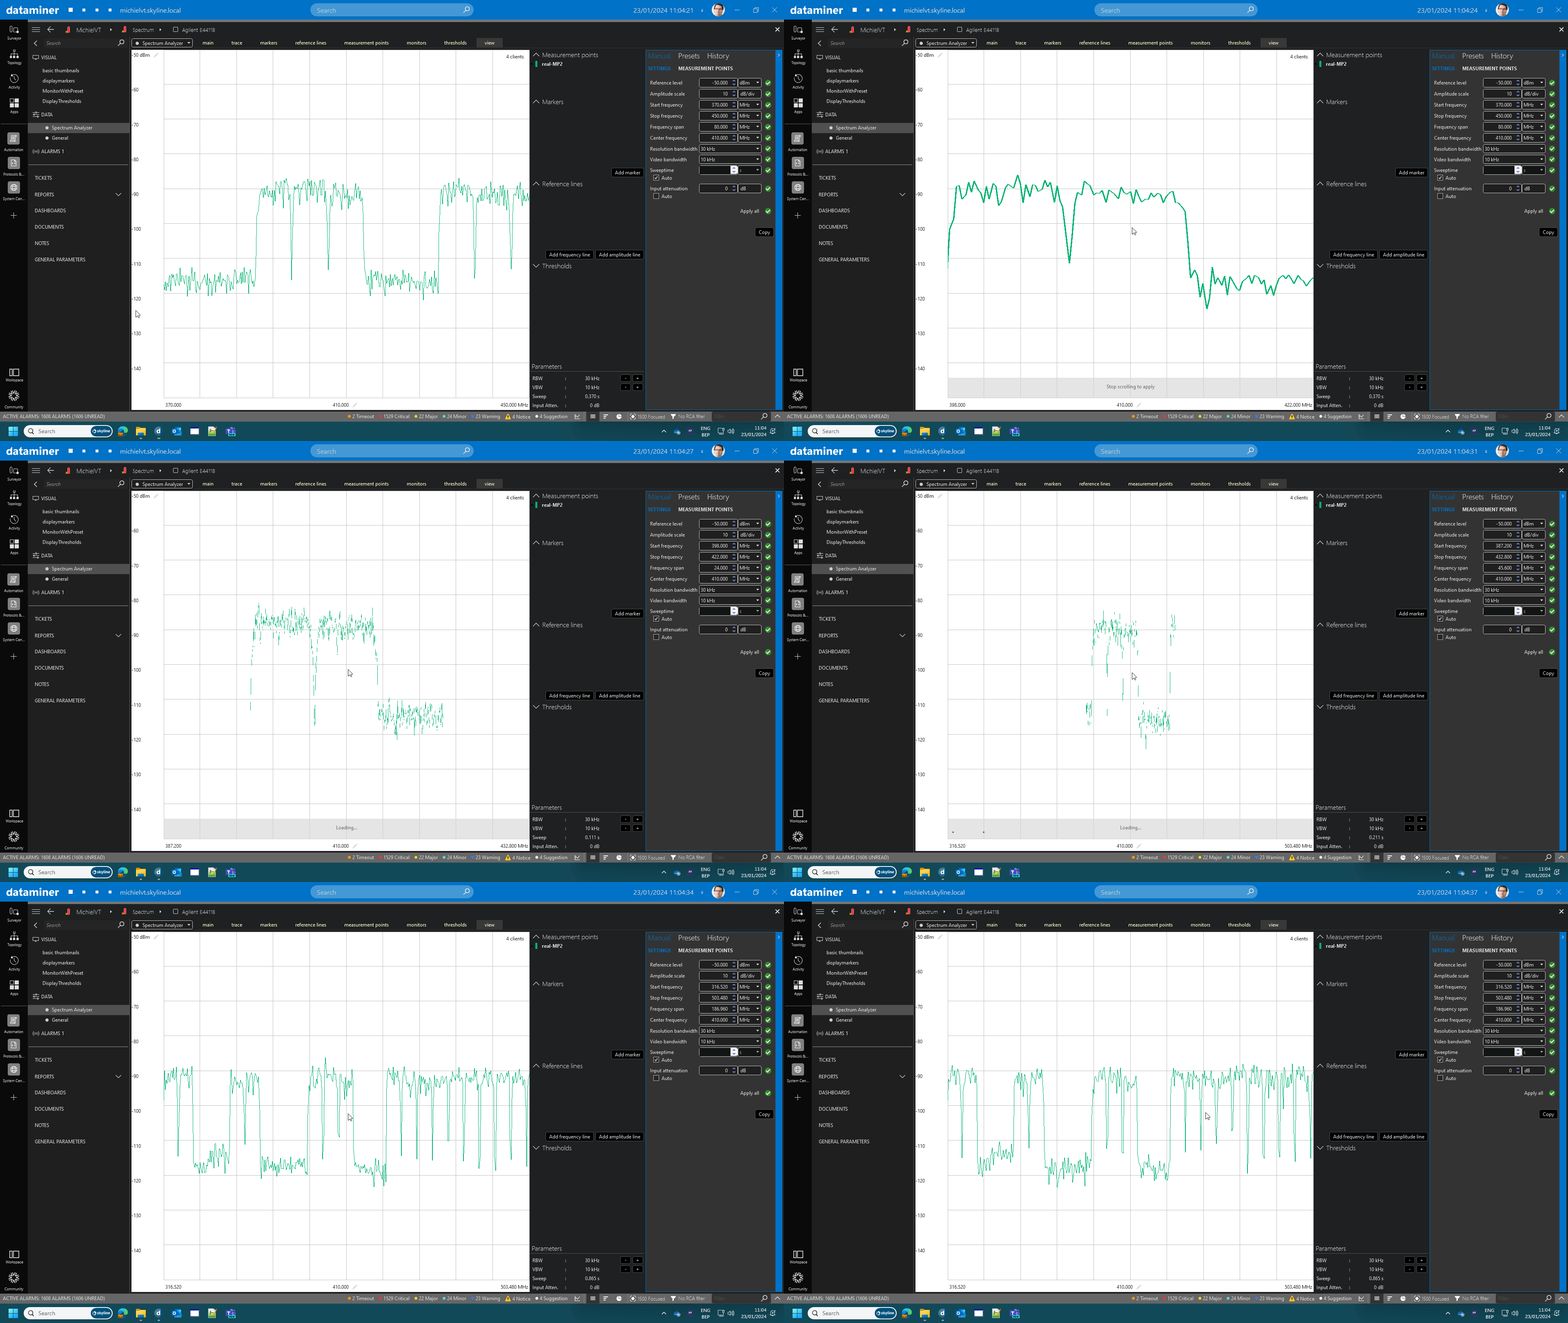
Changing the frequency span
You now no longer need to manually alter the frequency span, but can get the same results using the scroll wheel. You can now scroll up and down to zoom horizontally, offering a dynamic and responsive experience.
Changing the center frequency
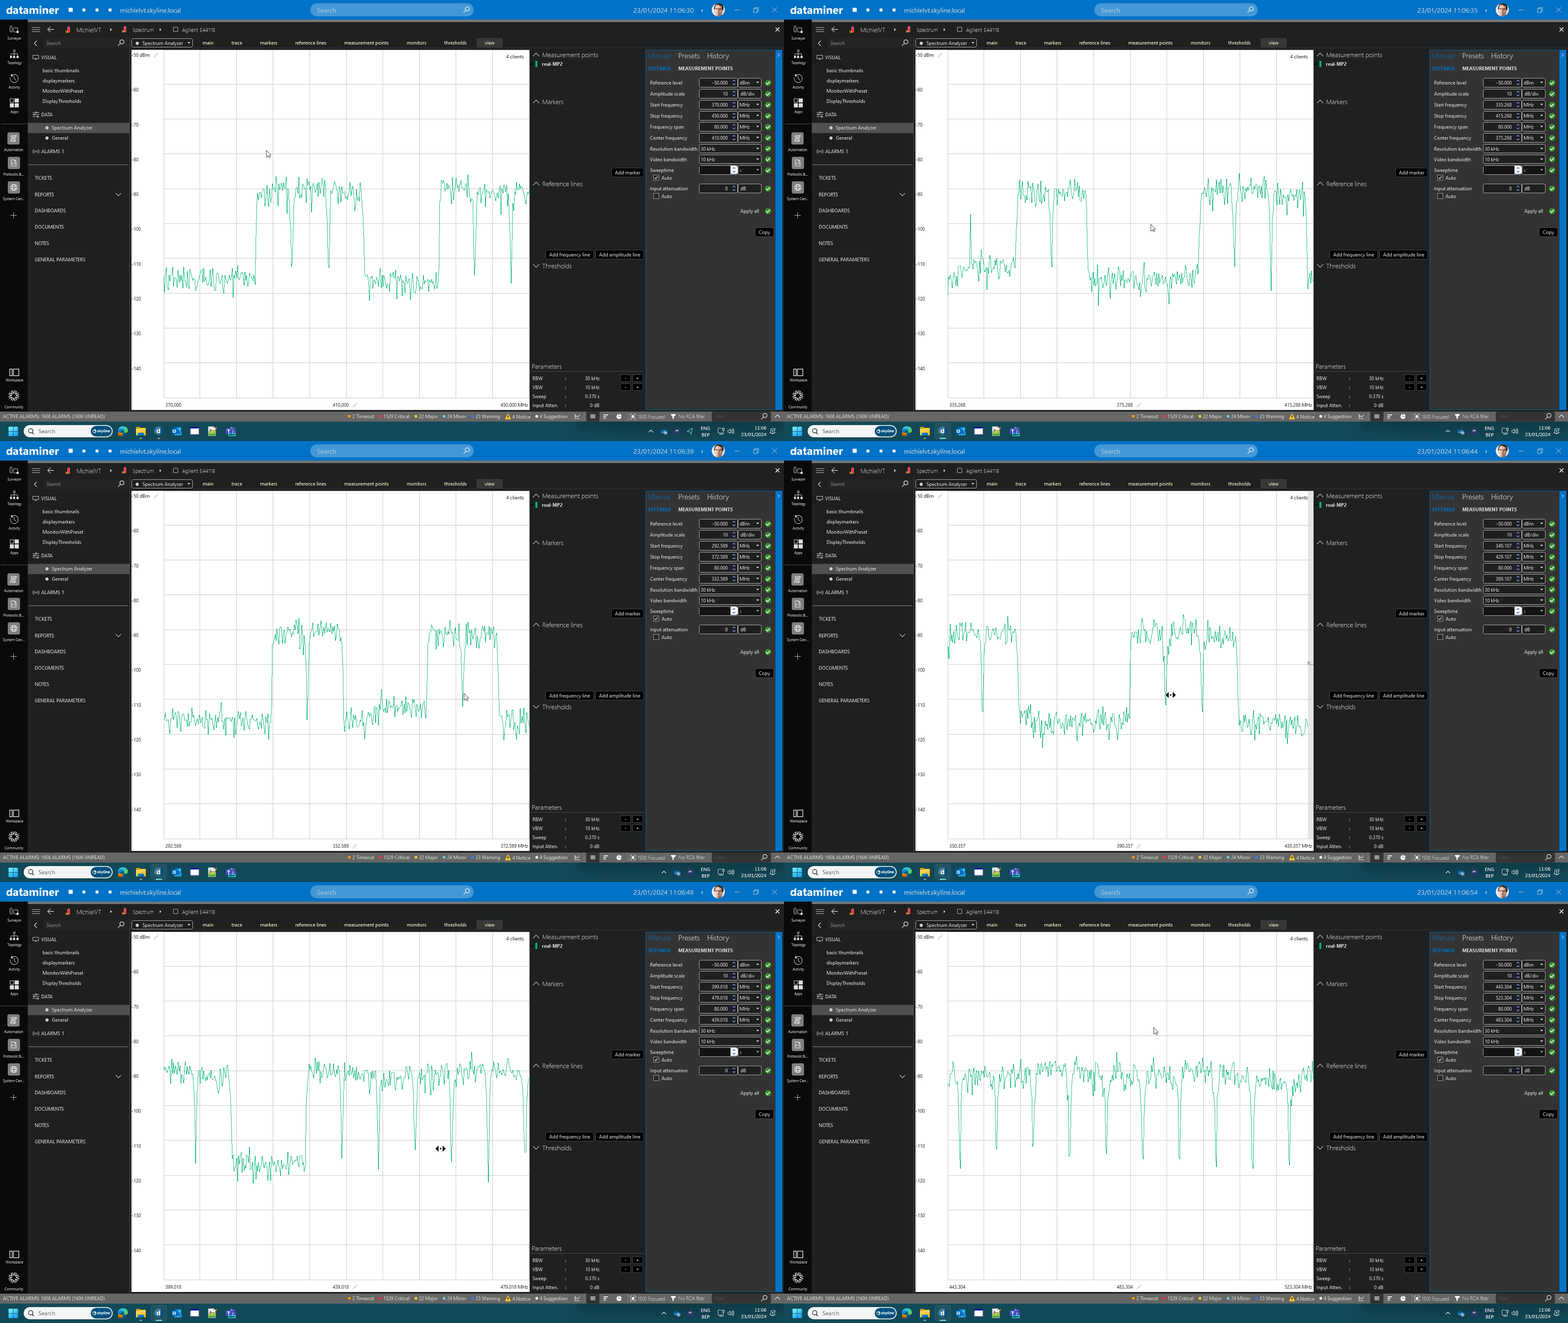
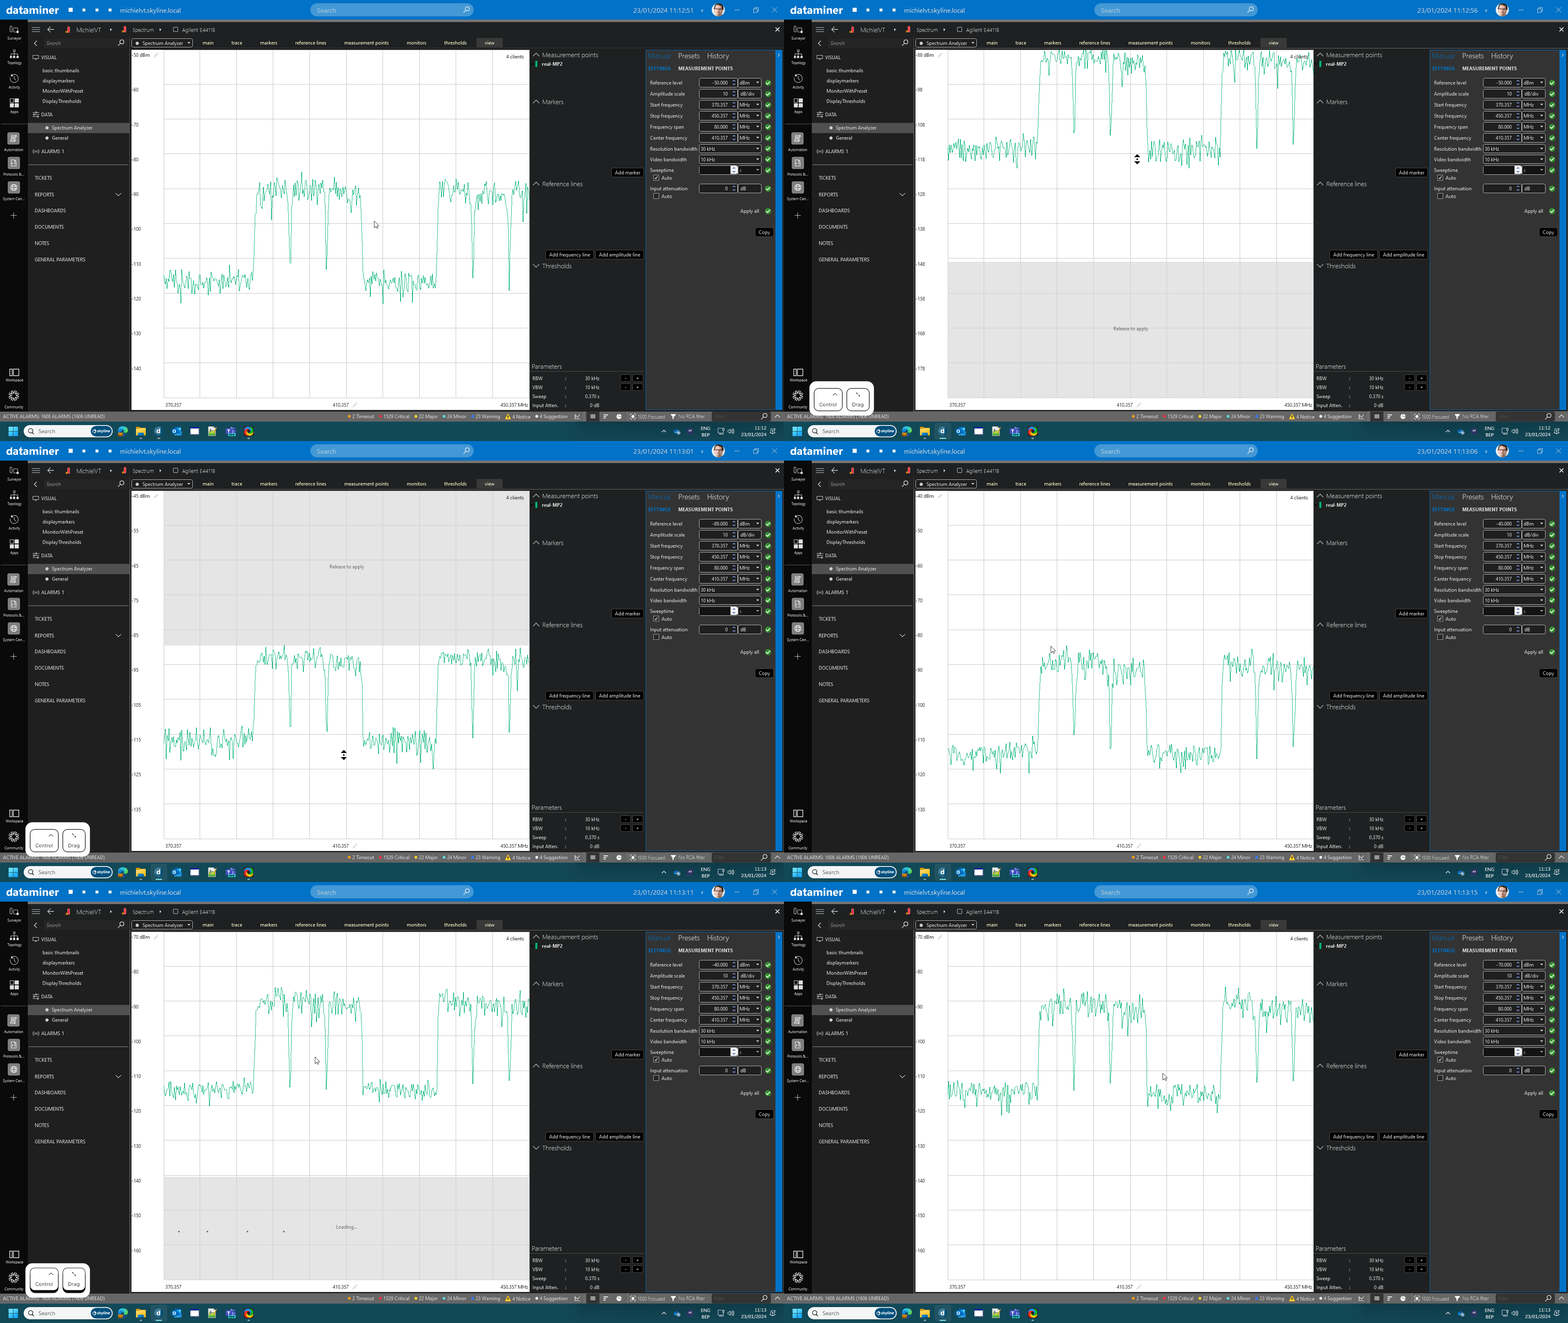
The center frequency can now be easily modified by clicking the trace and dragging your mouse. As you move the trace left or right, the unknown part of the trace is visualized as a gray area until you release the mouse button. When you do, the center frequency is automatically updated in the settings pane, and a new trace, reflecting the updated center frequency, replaces the gray area.
This intuitive method of honing in on specific frequency ranges allows for efficient focus. On touch-enabled devices, this can be achieved with a simple touch-and-drag motion to the left or right.
Amplitude adjustments
Changing the amplitude scale
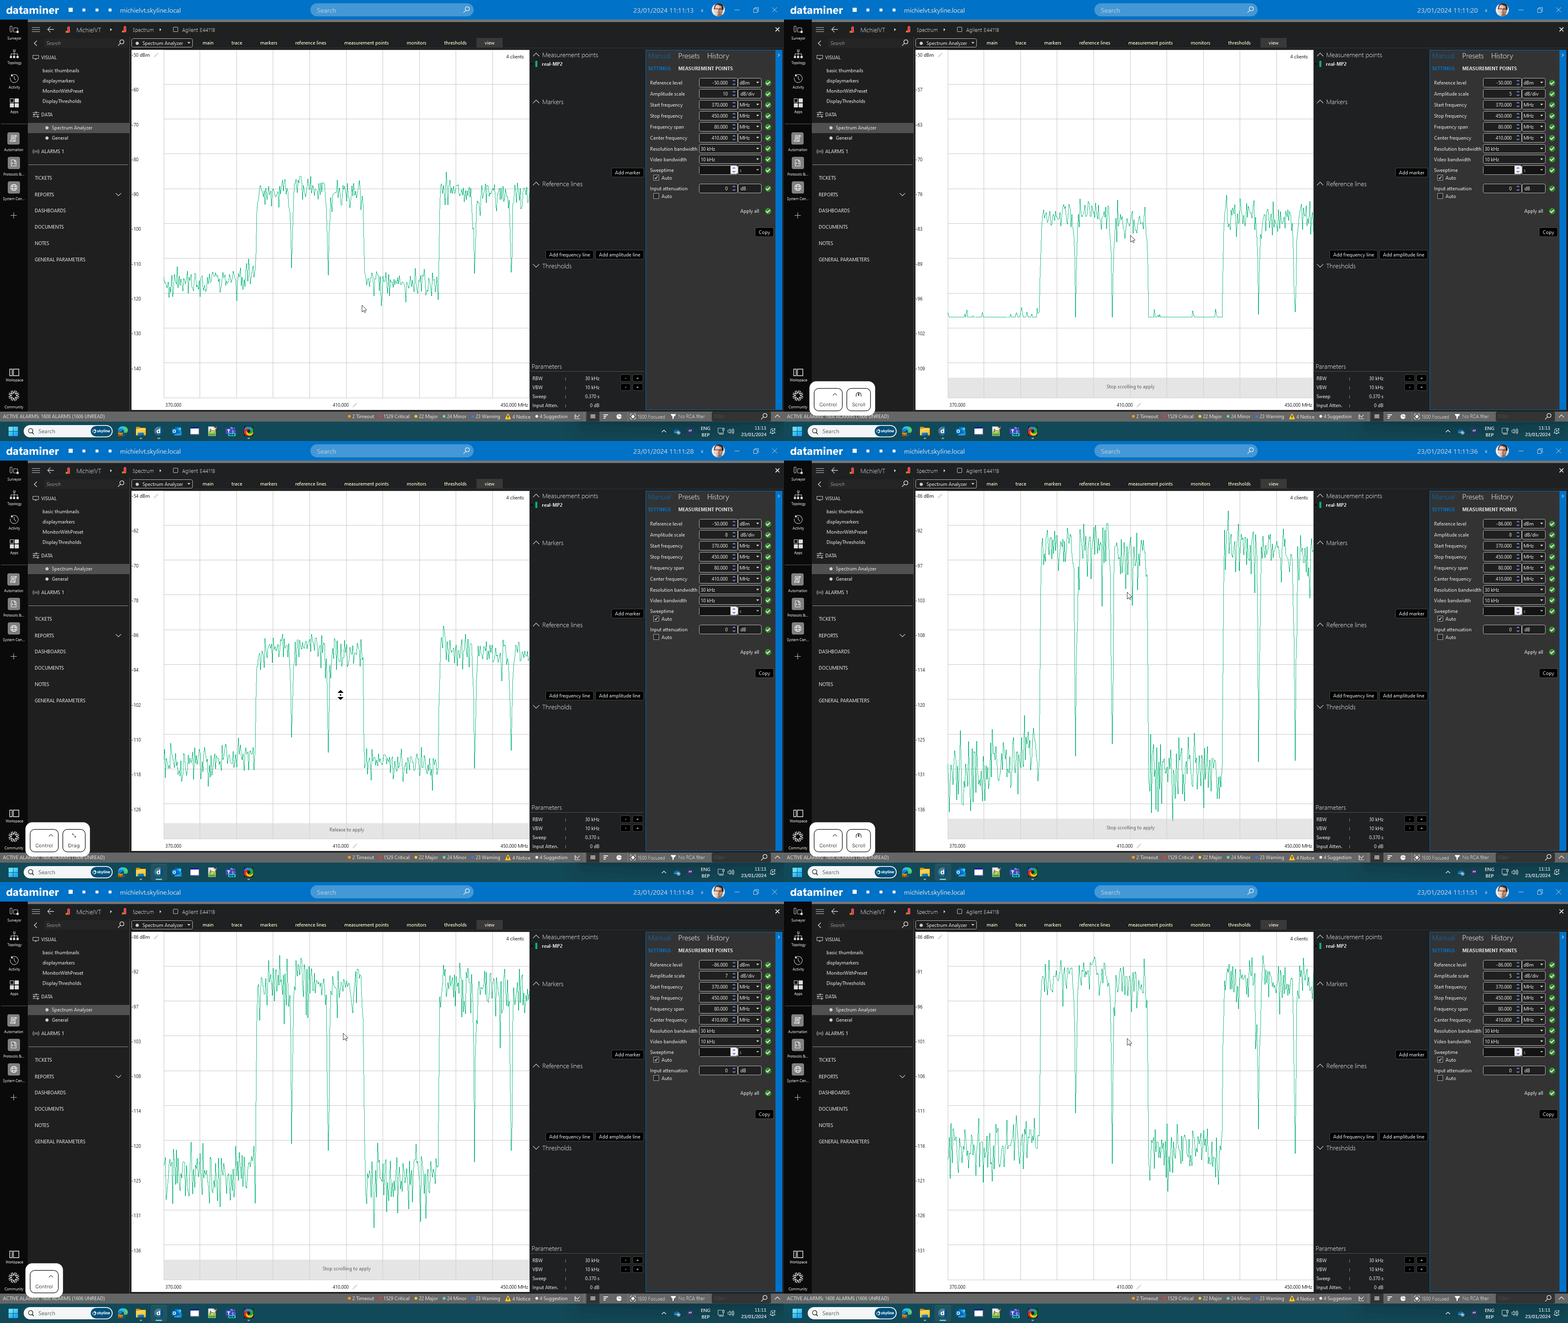
Press and hold the CTRL button while scrolling to perform vertical zooming, allowing you to alter the amplitude scale. This feature results in a clearer and more detailed view of spectrum variations.
Changing the reference level
You can now adjust the reference level by holding down the CTRL button while dragging the mouse up or down. When you release the mouse button, the reference level automatically synchronizes with the new data, and a new trace is displayed based on the updated reference level.
This new functionality grants you precise control over the reference level for more detailed analysis. On touch-enabled devices, the same can be achieved by pressing the CTRL key combined with a touch-and-drag gesture up or down.
Direct editing in the spectrum analyzer card
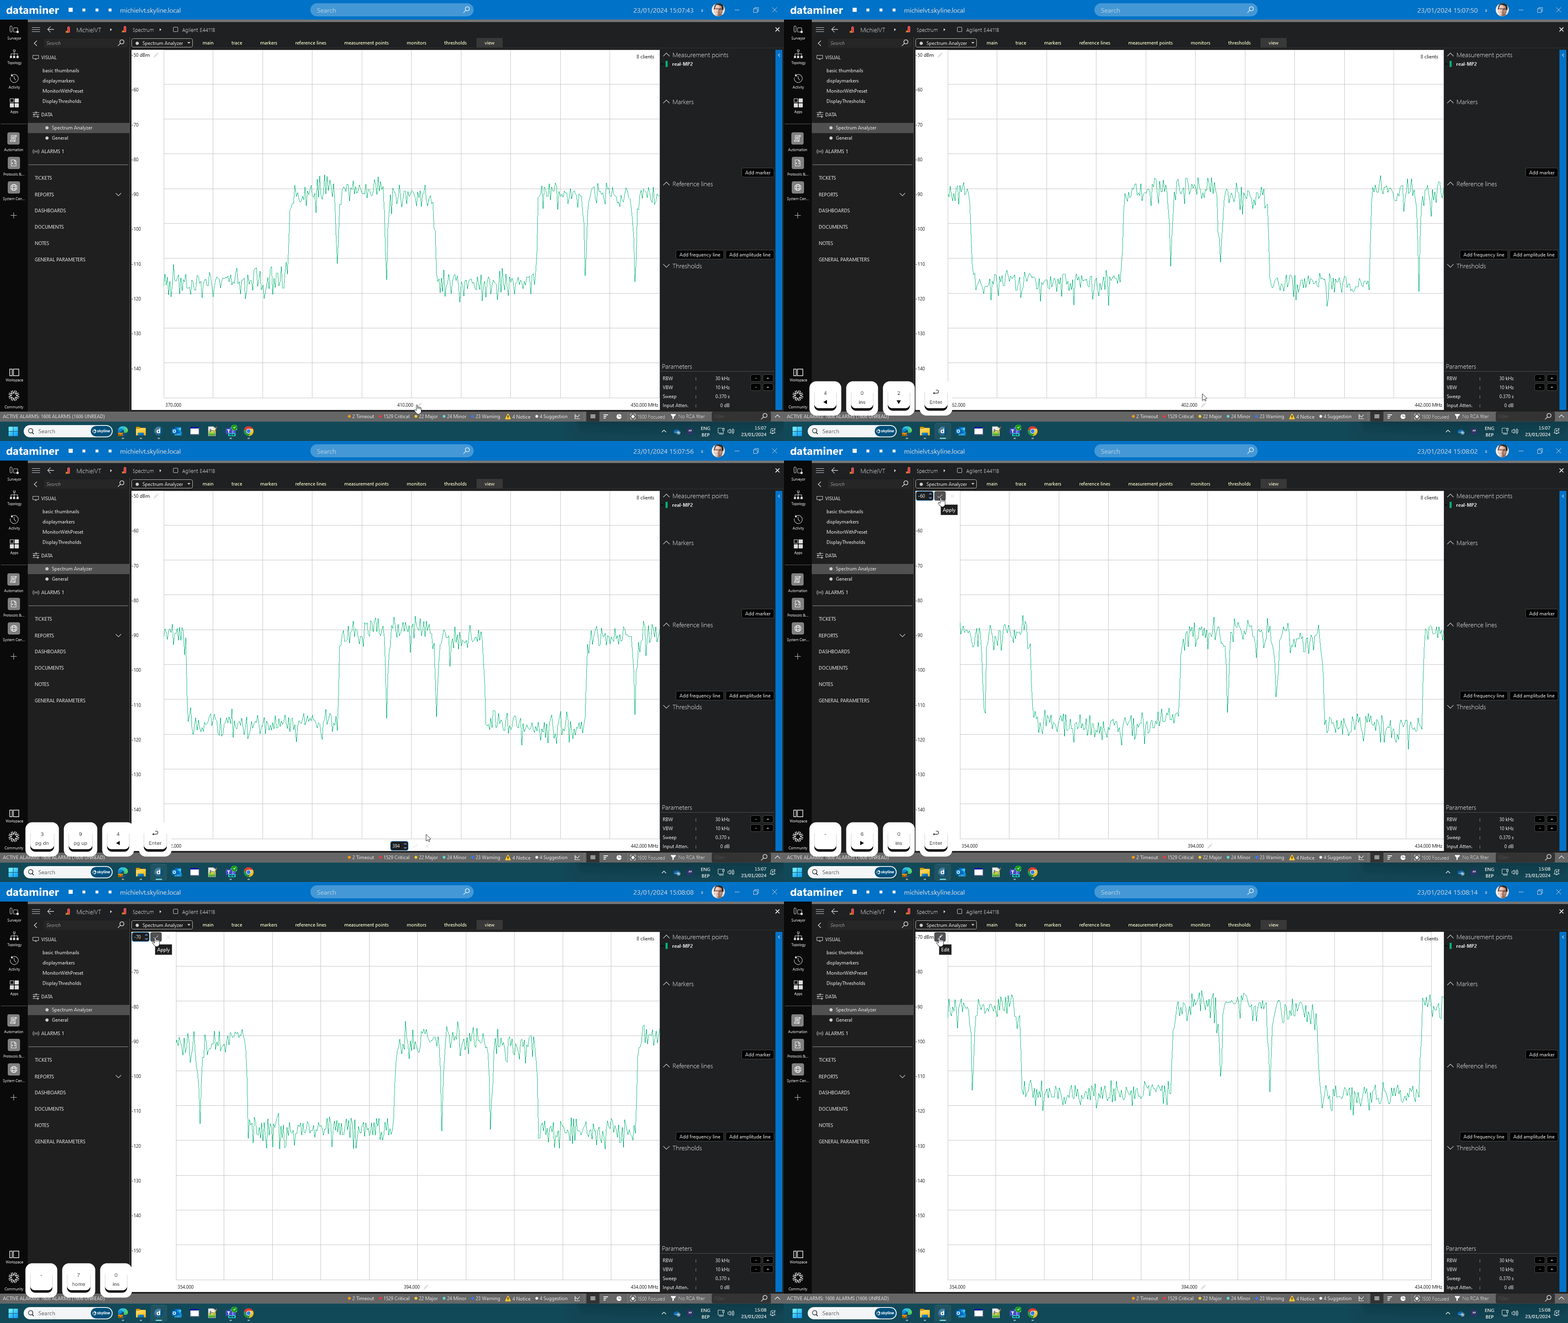
You can now edit the reference level and center frequency directly in the real-time display section of the spectrum alalyzer card by clicking one of the two pencil icons.
Click the pencil icon in the top-left corner to change the reference level, and click the pencil icon at the bottom of the card to change the center frequency.
This enables quick modifications from visual overviews with an embedded spectrum control. And additionally, you can now close the side panel to maximize the trace view in a card, while still being able to make changes.
Bandwidth control at your fingertips
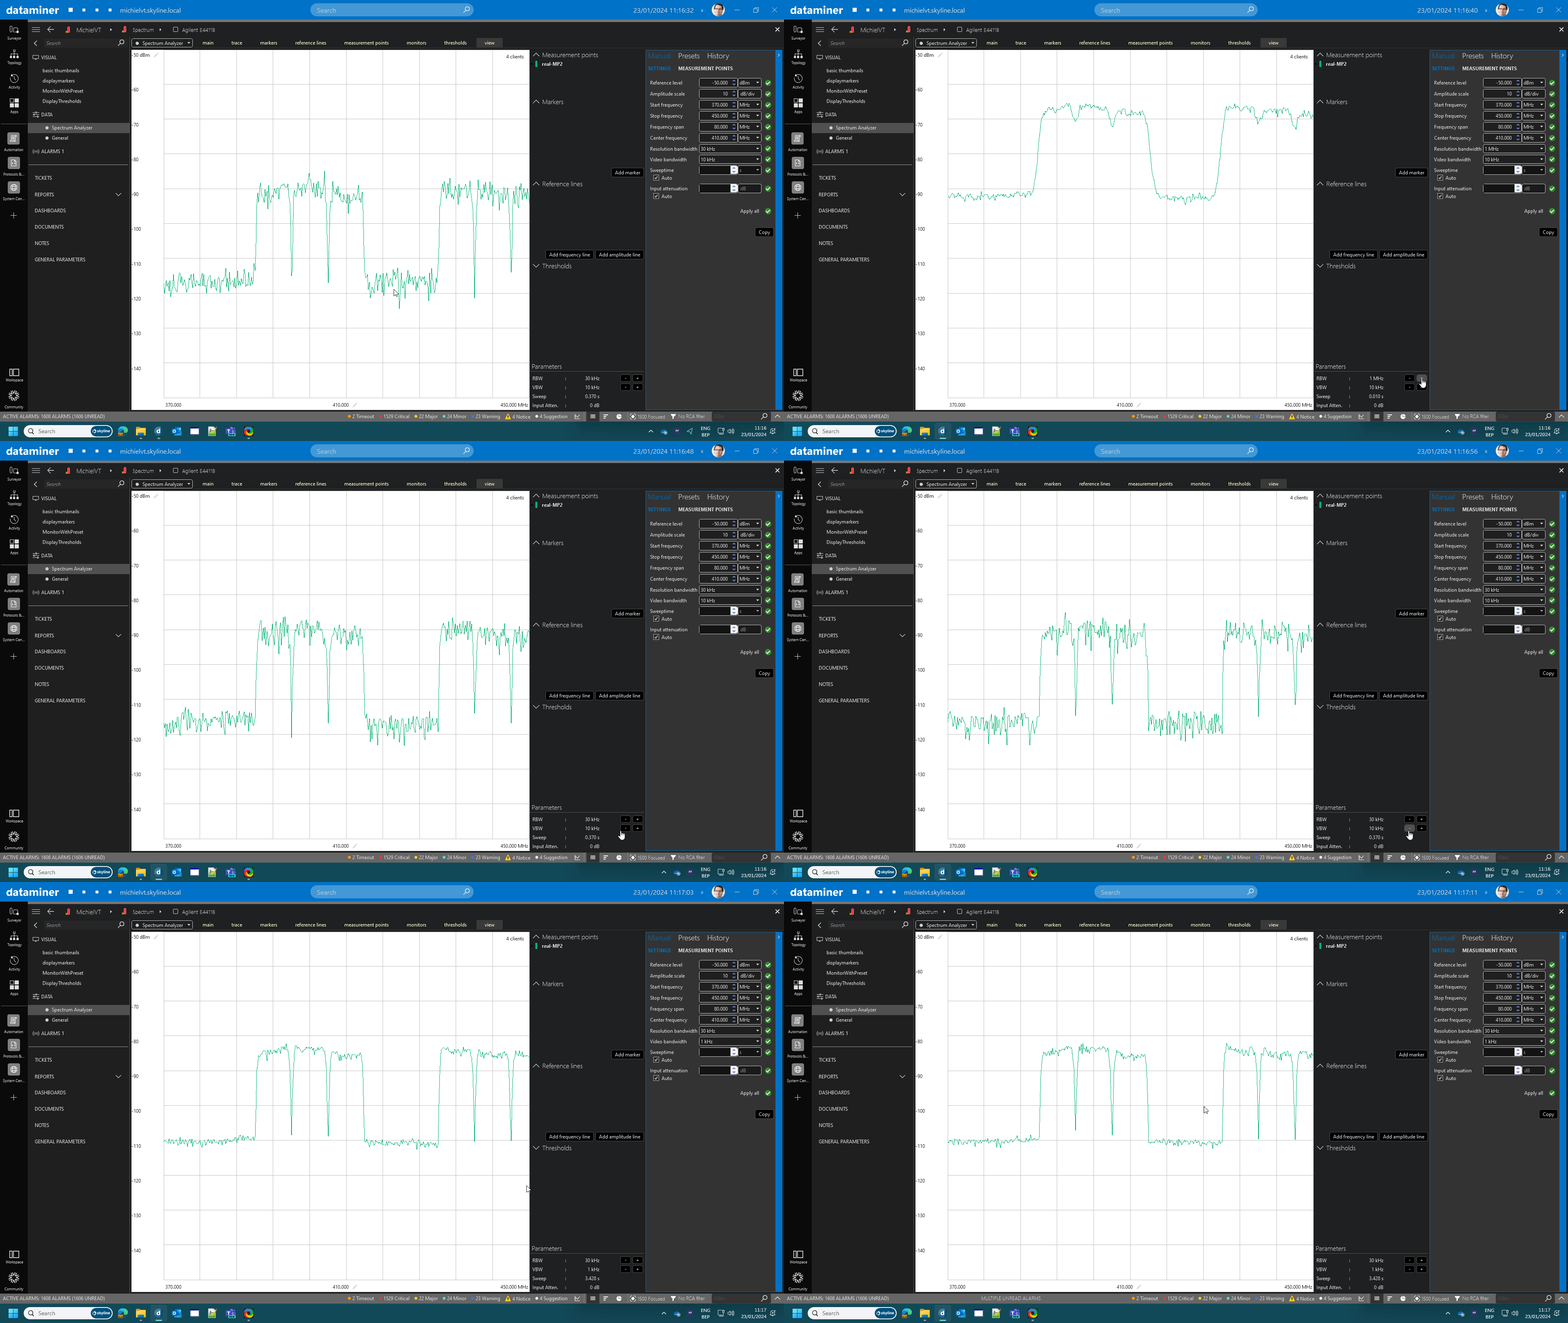
The traditional Resolution bandwidth (RBW) and Video bandwidth (VBW) options in the settings pane are now complemented with convenient plus (“+”) and minus (“-“) buttons in the Parameters section of the info pane, to the right of the real-time display. This simplifies the selection process and further enhances the overall user interface.
Quick marker centering
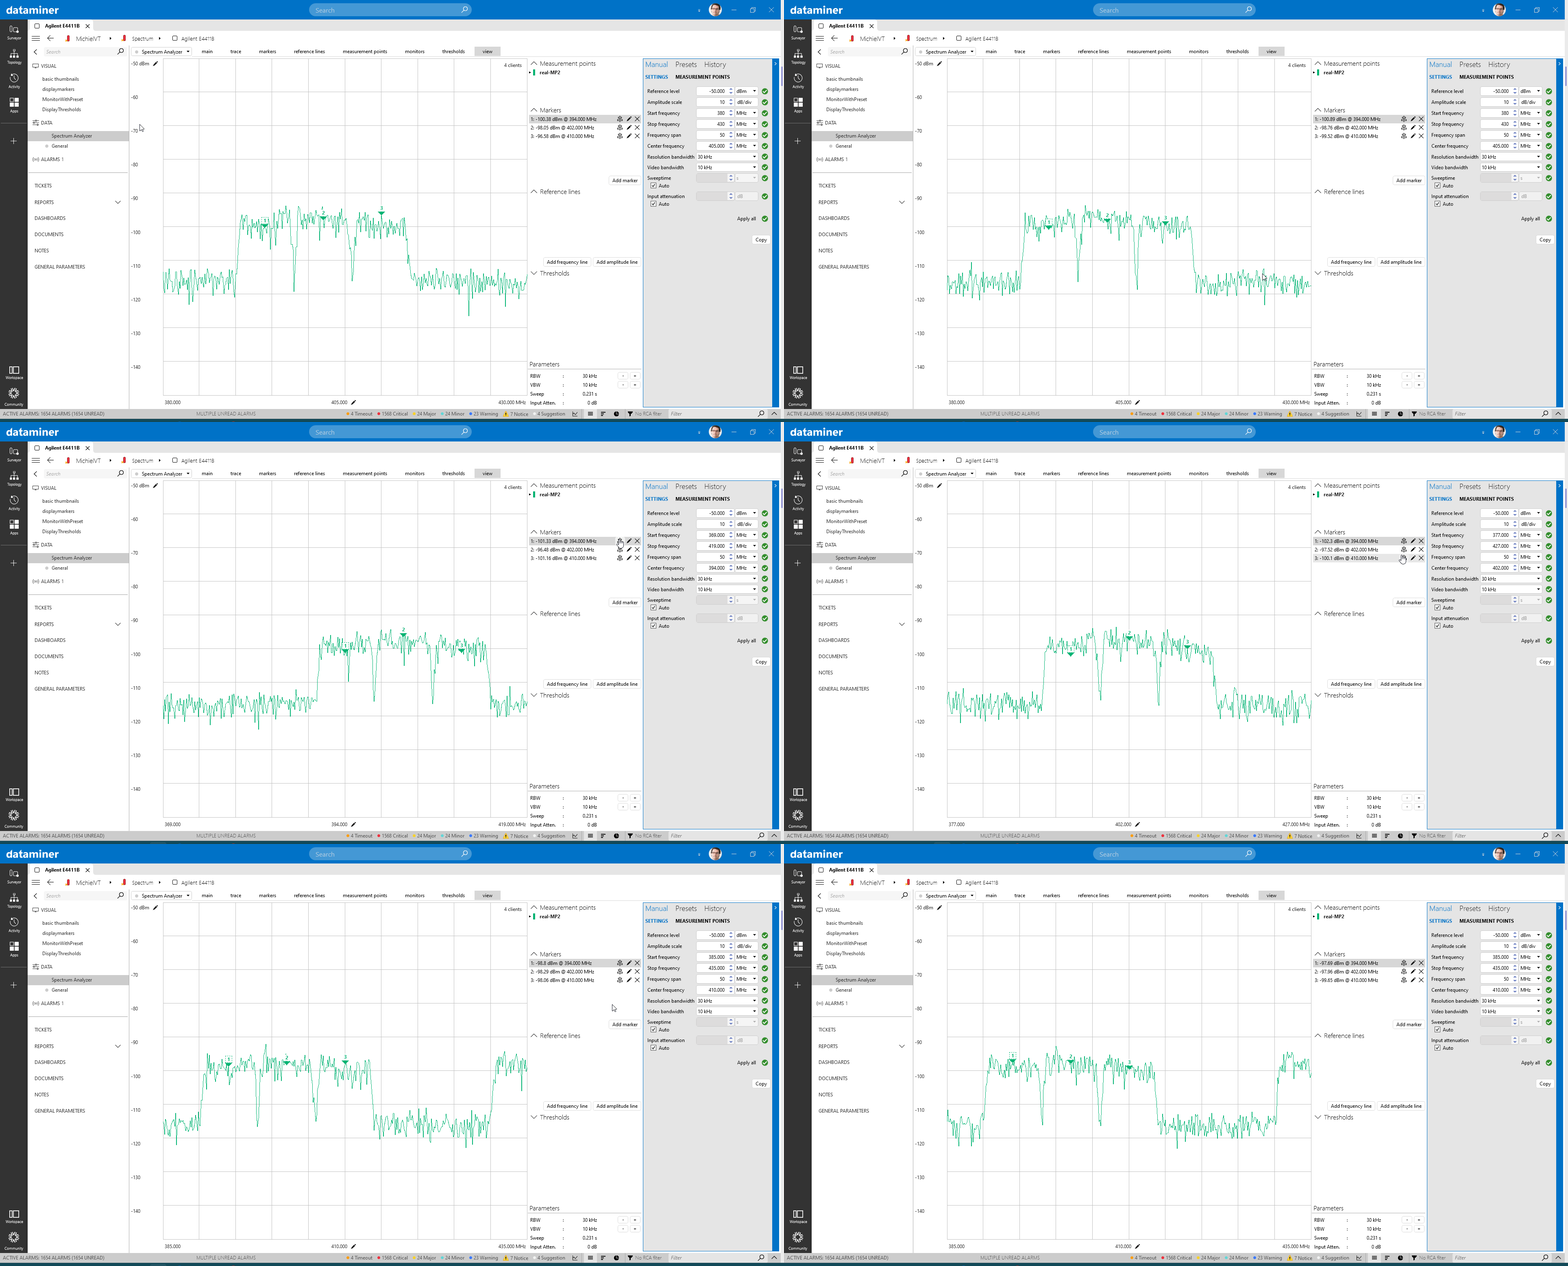
Centering markers is now easier than ever before. Click a single button to quickly and efficiently focus on specific carriers during analysis.
You can use these features today!
All of these features are included in the DataMiner 10.3.12 and 10.4.0 releases. If you have automatic updates for the Cube client enabled, you can start leveraging these features right away!
These recent enhancements represent a significant step forward in the ease of use of the Spectrum Analysis module. You now benefit from a more intuitive and streamlined approach to exploring and interpreting spectrum usage and availability.
DataMiner Cube continues to empower users with tools that make Spectrum Analysis more accessible and efficient than ever before.
It’s a pleasure to see a summary of the development and the outcome we delivered!
Another great improvement for the Spectrum analyzer module…