Skip to content
DataMiner DoJo

More results...

Generic selectors
Exact matches only
Search in title
Search in content
Post Type Selectors
Search in posts
Search in pages
Search in posts
Search in pages
Log in
Menu
  • Updates & Insights
  • Questions
  • Learning
    • E-learning Courses
    • Empower Replay: Limited Edition
    • Tutorials
    • Open Classroom Training
    • Agility
      • Kanban workshop
      • Agile Fundamentals
    • Certification
      • DataMiner Fundamentals
      • DataMiner Configurator
      • DataMiner Automation
      • Scripts & Connectors Developer: HTTP Basics
      • Scripts & Connectors Developer: SNMP Basics
      • Visual Overview – Level 1
      • Verify a certificate
    • Video Library
    • Books We Like
    • >> Go to DataMiner Docs
  • Expert Center
    • Solutions & Use Cases
      • Solutions
      • Use Case Library
    • Markets & Industries
      • Media production
      • Government & defense
      • Content distribution
      • Service providers
      • Partners
      • OSS/BSS
    • Agile
      • Agile Webspace
      • Everything Agile
        • The Agile Manifesto
        • Best Practices
        • Retro Recipes
      • Methodologies
        • The Scrum Framework
        • Kanban
        • Extreme Programming
      • Roles
        • The Product Owner
        • The Agile Coach
        • The Quality & UX Coach (QX)
    • DataMiner DevOps Professional Program
      • About the DevOps Program
      • DataMiner DevOps Support
  • Downloads
  • More
    • Feature Suggestions
    • Climb the leaderboard!
    • Swag Shop
    • Contact
    • Global Feedback Survey
  • Support
  • PARTNERS
    • All Partners
    • Technology Partners
    • Strategic Partner Program
    • Deal Registration
  • >> Go to dataminer.services

Trend Groups – Sum trend of all parameters

Solved769 views12th July 2023Trend Graphs
0
paul farndell [DevOps Advocate]439 11th November 2022 0 Comments

Is it possible to show the Sum of all the parameters for a saved Trend Graph.

For example if there were 5 parameters that made up the utilization on the Cisco NIC card, could the trend graph show all 5 parameter AND the sum of all 5 giving the total?

Marieke Goethals [SLC] [DevOps Catalyst] Selected answer as best 12th July 2023

1 Answer

  • Active
  • Voted
  • Newest
  • Oldest
0
Srikanth Mandava [SLC] [DevOps Advocate]912 Posted 11th November 2022 0 Comments

Paul

Using GQI on HTML5 dashboards, I am able to do this for one parameter but not for 5 different parameters in one query. Others may have a better solution for this.

Please see the video at DataMiner GQI .

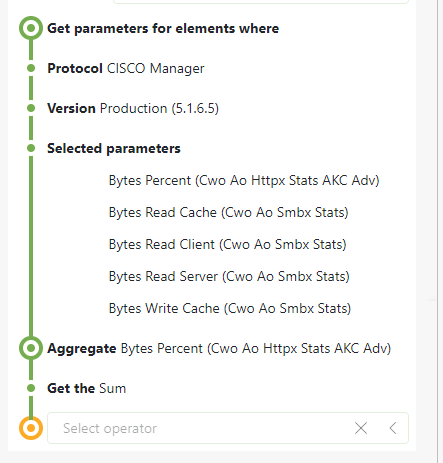
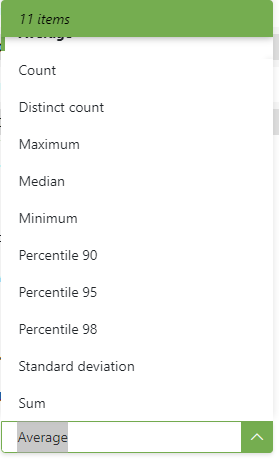
Please see the below screenshots with an example and aggregation methods for what I tried.

Marieke Goethals [SLC] [DevOps Catalyst] Selected answer as best 12th July 2023
Please login to be able to comment or post an answer.

My DevOps rank

DevOps Members get more insights on their profile page.

My user earnings

0 Dojo credits

Spend your credits in our swag shop.

0 Reputation points

Boost your reputation, climb the leaderboard.

Promo banner DataMiner DevOps Professiona Program
DataMiner Integration Studio (DIS)
Empower Katas
Privacy Policy • Terms & Conditions • Contact

© 2025 Skyline Communications. All rights reserved.

DOJO Q&A widget

Can't find what you need?

? Explore the Q&A DataMiner Docs