Skip to content
DataMiner Dojo

More results...

Generic selectors
Exact matches only
Search in title
Search in content
Post Type Selectors
Search in posts
Search in pages
Search in posts
Search in pages
Log in
Menu
  • Updates & Insights
  • Questions
  • Learning
    • E-learning Courses
    • Tutorials
    • Open Classroom Training
    • Certification
      • DataMiner Fundamentals
      • DataMiner Configurator
      • DataMiner Automation
      • Scripts & Connectors Developer: HTTP Basics
      • Scripts & Connectors Developer: SNMP Basics
      • Visual Overview – Level 1
      • Verify a certificate
    • YouTube Videos
    • Solutions & Use Cases
      • Solutions
      • Use Case Library
    • Agility
      • Learn more about Agile
        • Agile Webspace
        • Everything Agile
          • The Agile Manifesto
          • Best Practices
          • Retro Recipes
        • Methodologies
          • The Scrum Framework
          • Kanban
          • Extreme Programming
        • Roles
          • The Product Owner
          • The Agile Coach
          • The Quality & UX Coach (QX)
      • Book your Agile Fundamentals training
      • Book you Kanban workshop
    • >> Go to DataMiner Docs
  • DevOps
    • About the DevOps Program
    • Sign up for the DevOps Program
    • DataMiner DevOps Support
    • Feature Suggestions
  • Downloads
  • Swag Shop
  • PARTNERS
    • Business Partners
    • Technology Partners
  • Contact
    • Sales, Training & Certification
    • DataMiner Support
    • Global Feedback Survey
  • >> Go to dataminer.services

Average trend value

Solved132 views1 day ago
2
Stefan Schedletzky [DevOps Enabler]2.43K 2 days ago 0 Comments

Hi Dojo,

I'm looking for the best way to show the average value of a trended value like in the statistics:

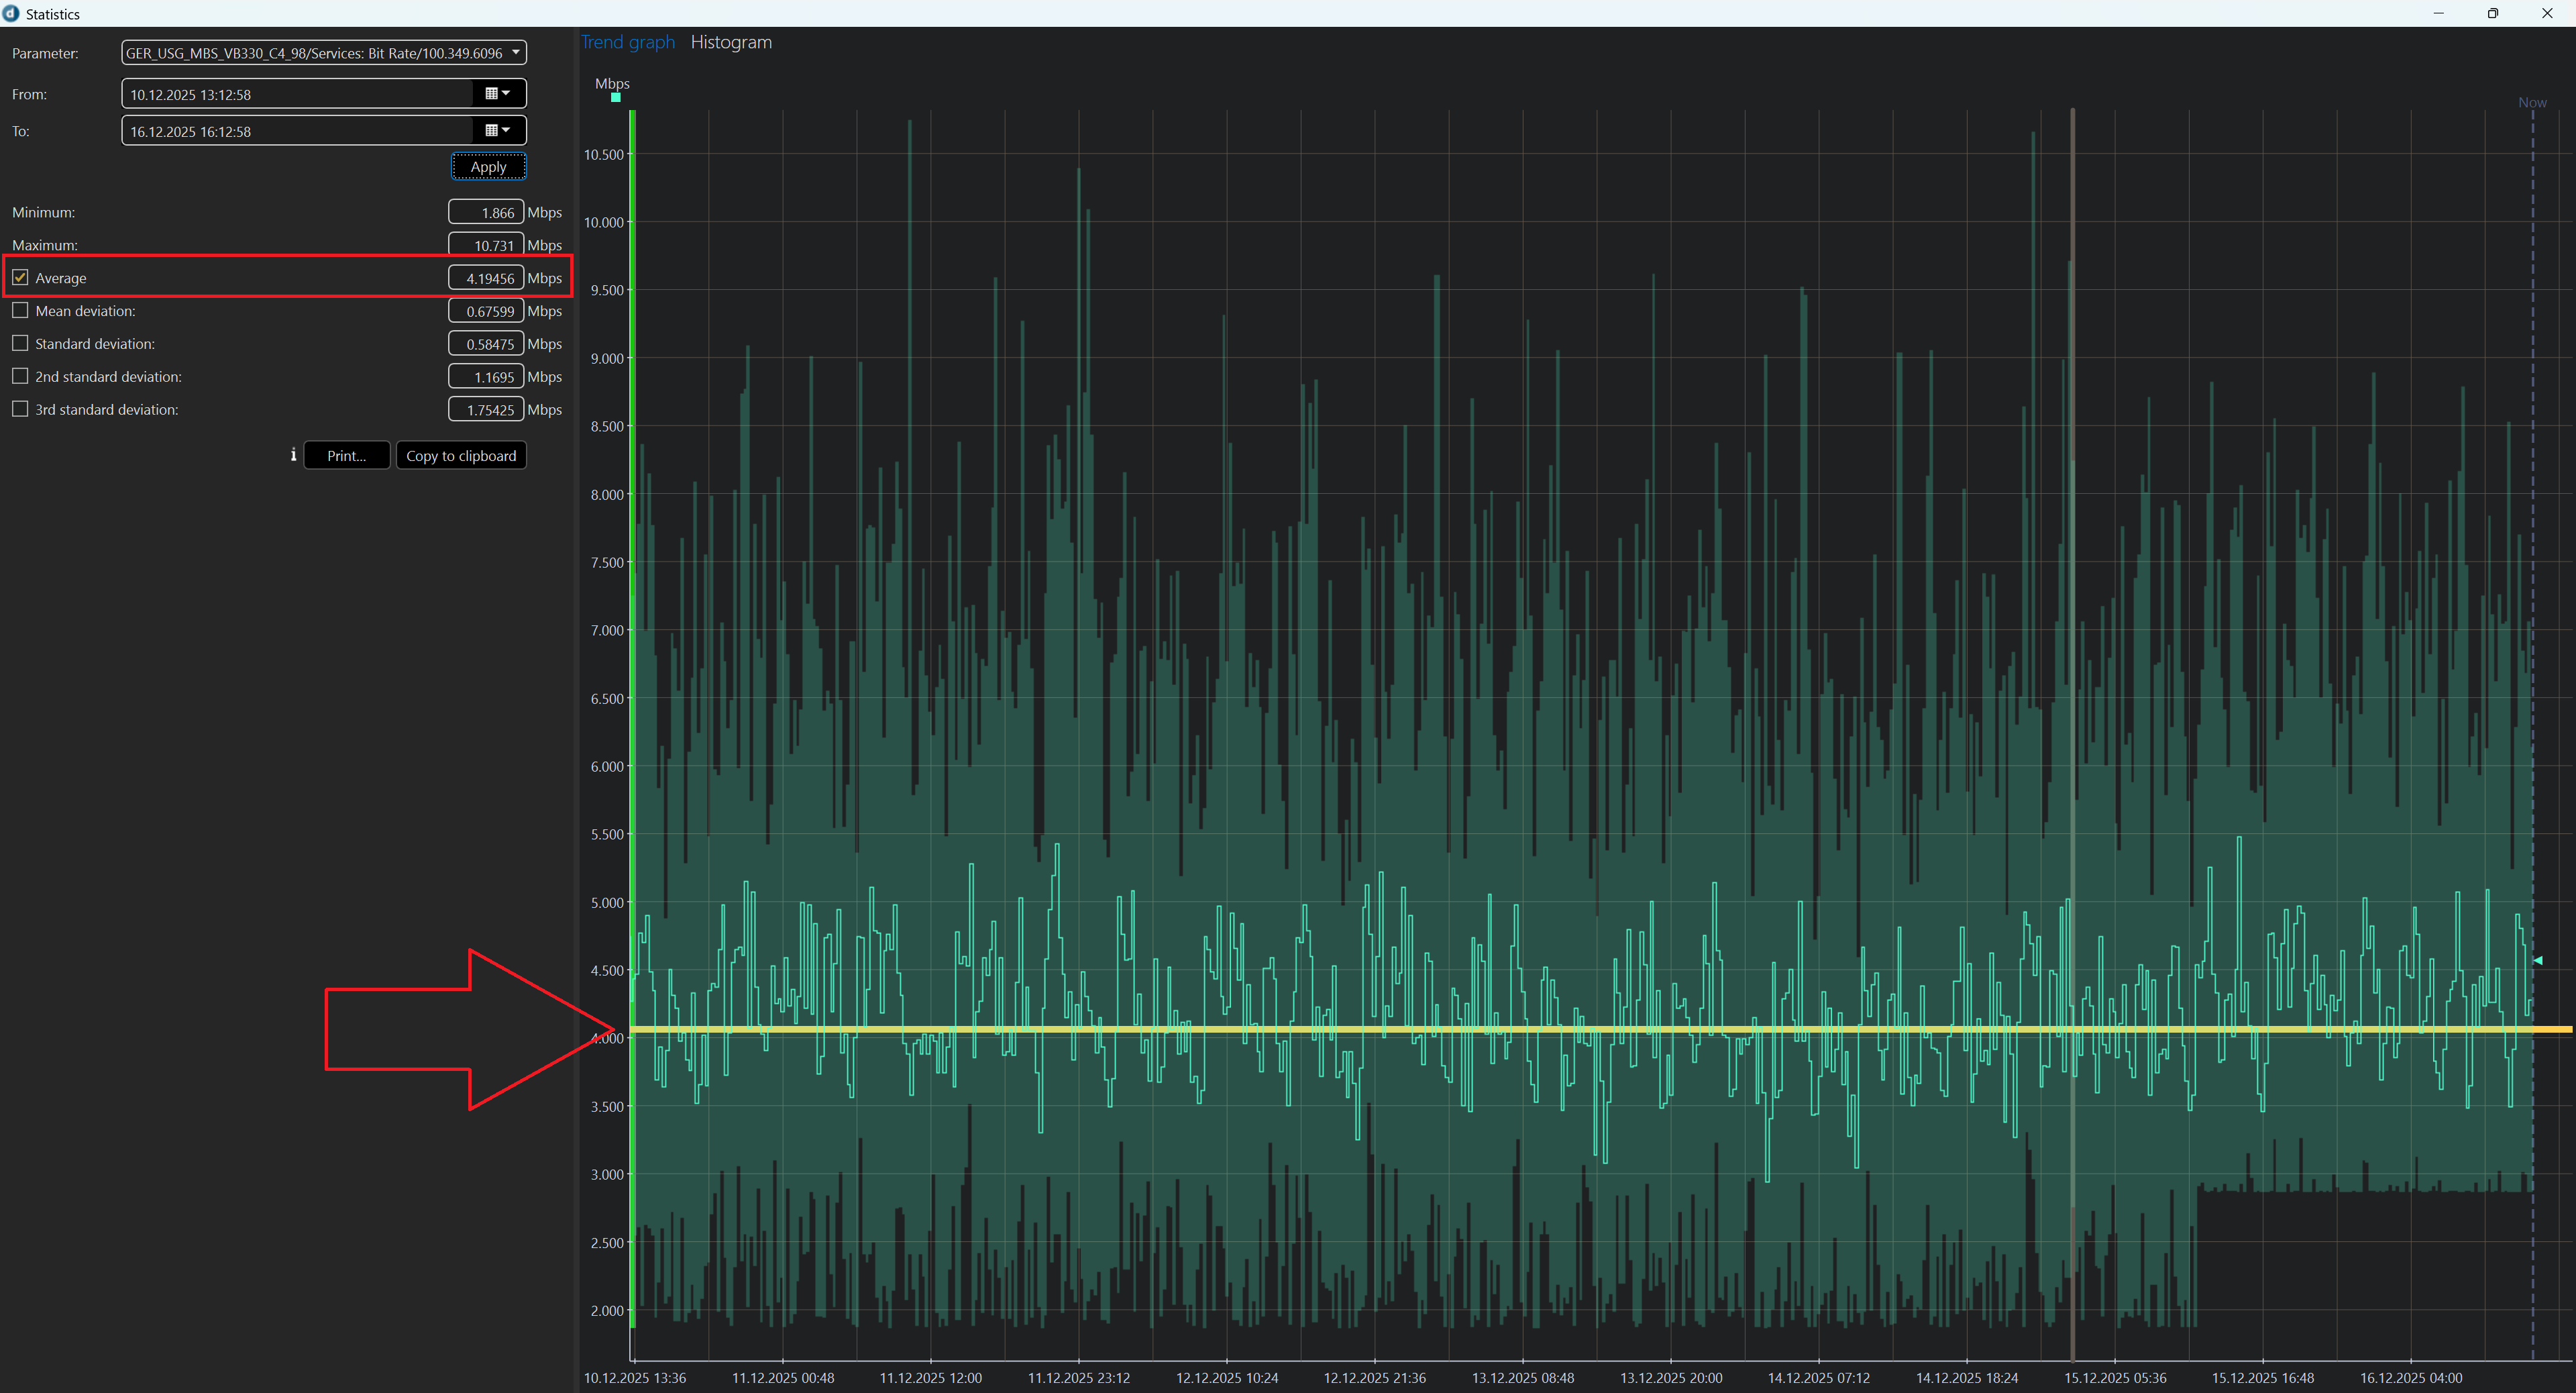
Is this possible in a Visio drawing or in a dashboard? Right now I haven't found a solution.
In Visio I could create a trend component and the user has to go to statistics manually. From the time would be a week, month for example.

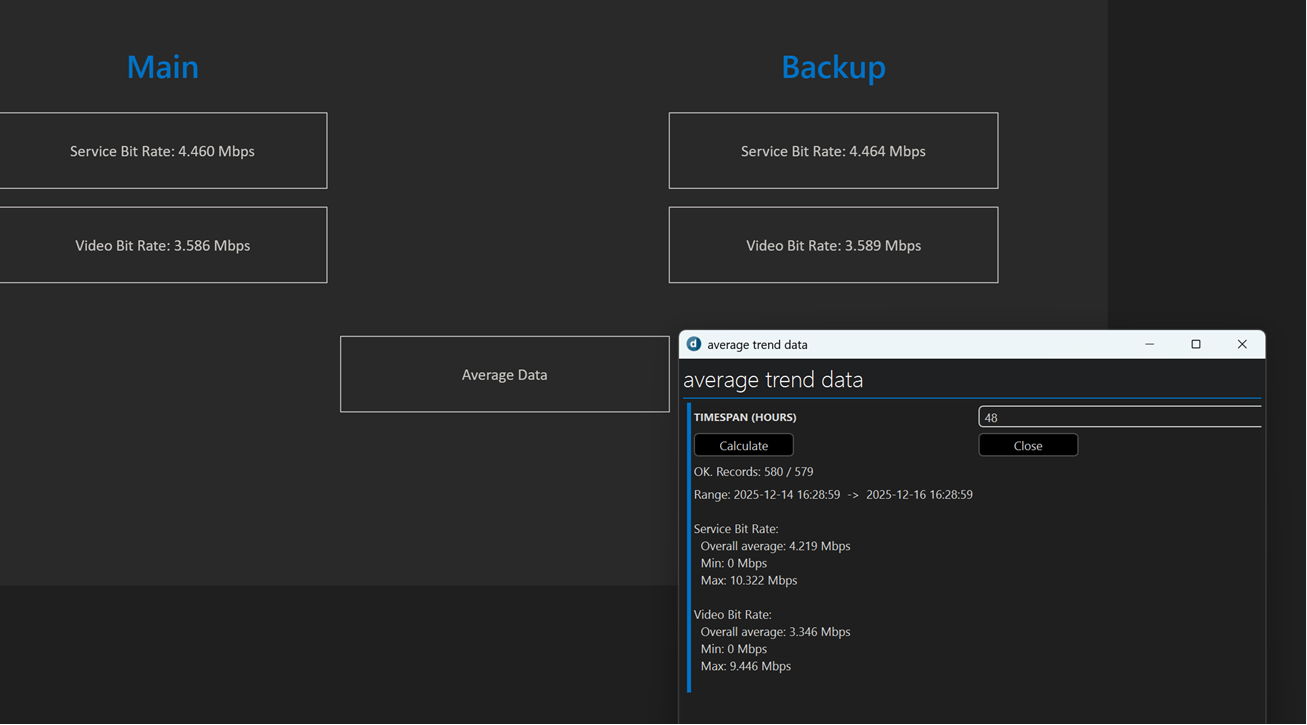
Example Visio with automation script:

RDashboard like from Ben:

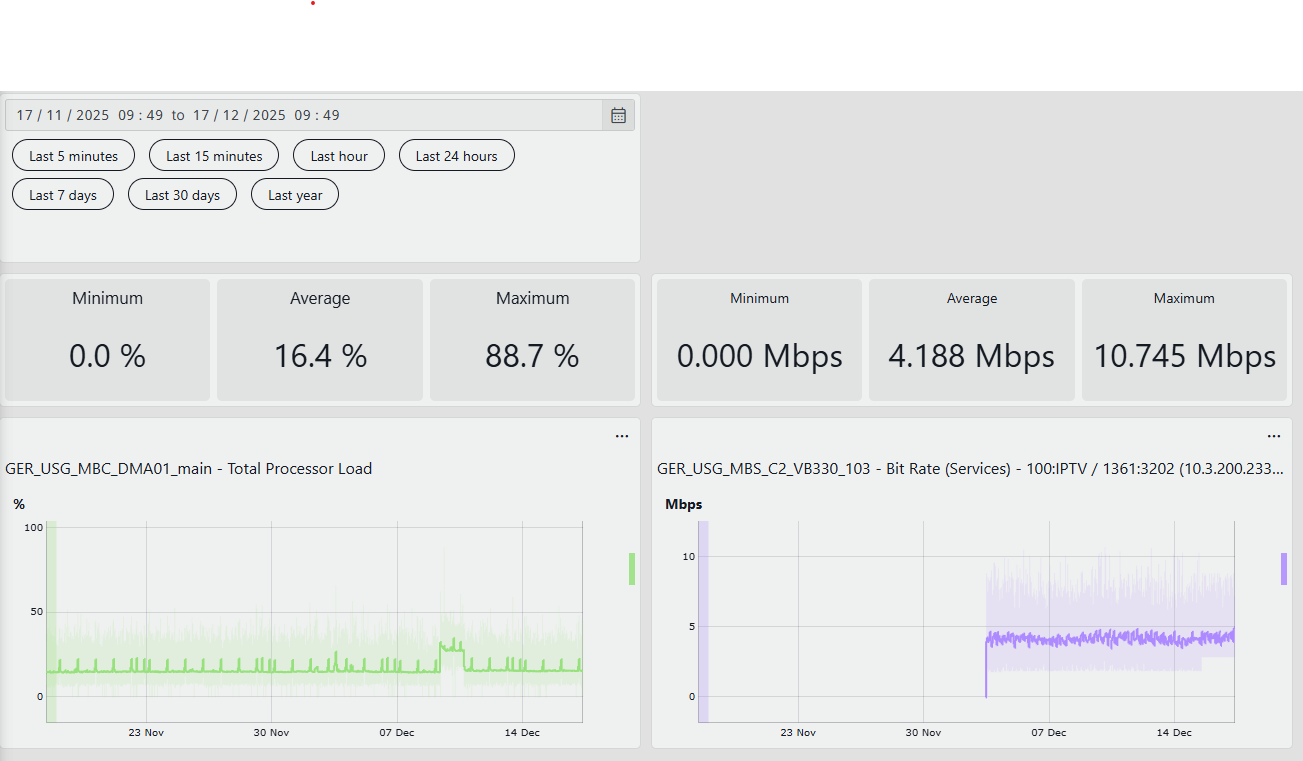
At this solution I have not used QUERIES because somehow it's not recognizing the trend ability. If you use Parameters directly it's working like a charme.

Stefan Schedletzky [DevOps Enabler] Selected answer as best 1 day ago

2 Answers

  • Active
  • Voted
  • Newest
  • Oldest
3
Ben Vandenberghe [SLC] [DevOps Enabler]9.46K Posted 1 day ago 2 Comments

Screen gif related to a comment on the other thread: 

Ben Vandenberghe [SLC] [DevOps Enabler] Posted new comment 19 hours ago
Stefan Schedletzky [DevOps Enabler] commented 1 day ago

Ben, thank you very much. I have updated my original post and could achieve the same and added my findings.

Ben Vandenberghe [SLC] [DevOps Enabler] commented 19 hours ago

Thanks, great to hear it worked out!

3
Shawn Michaud [SLC] [DevOps Member]706 Posted 2 days ago 5 Comments

Good day Stefan!

I assume you are working with DataMiner 10.5 or later. Please see below dashboard with options when you edit the line graph component. There you will find the option to select average and/or show/hide other values as required.
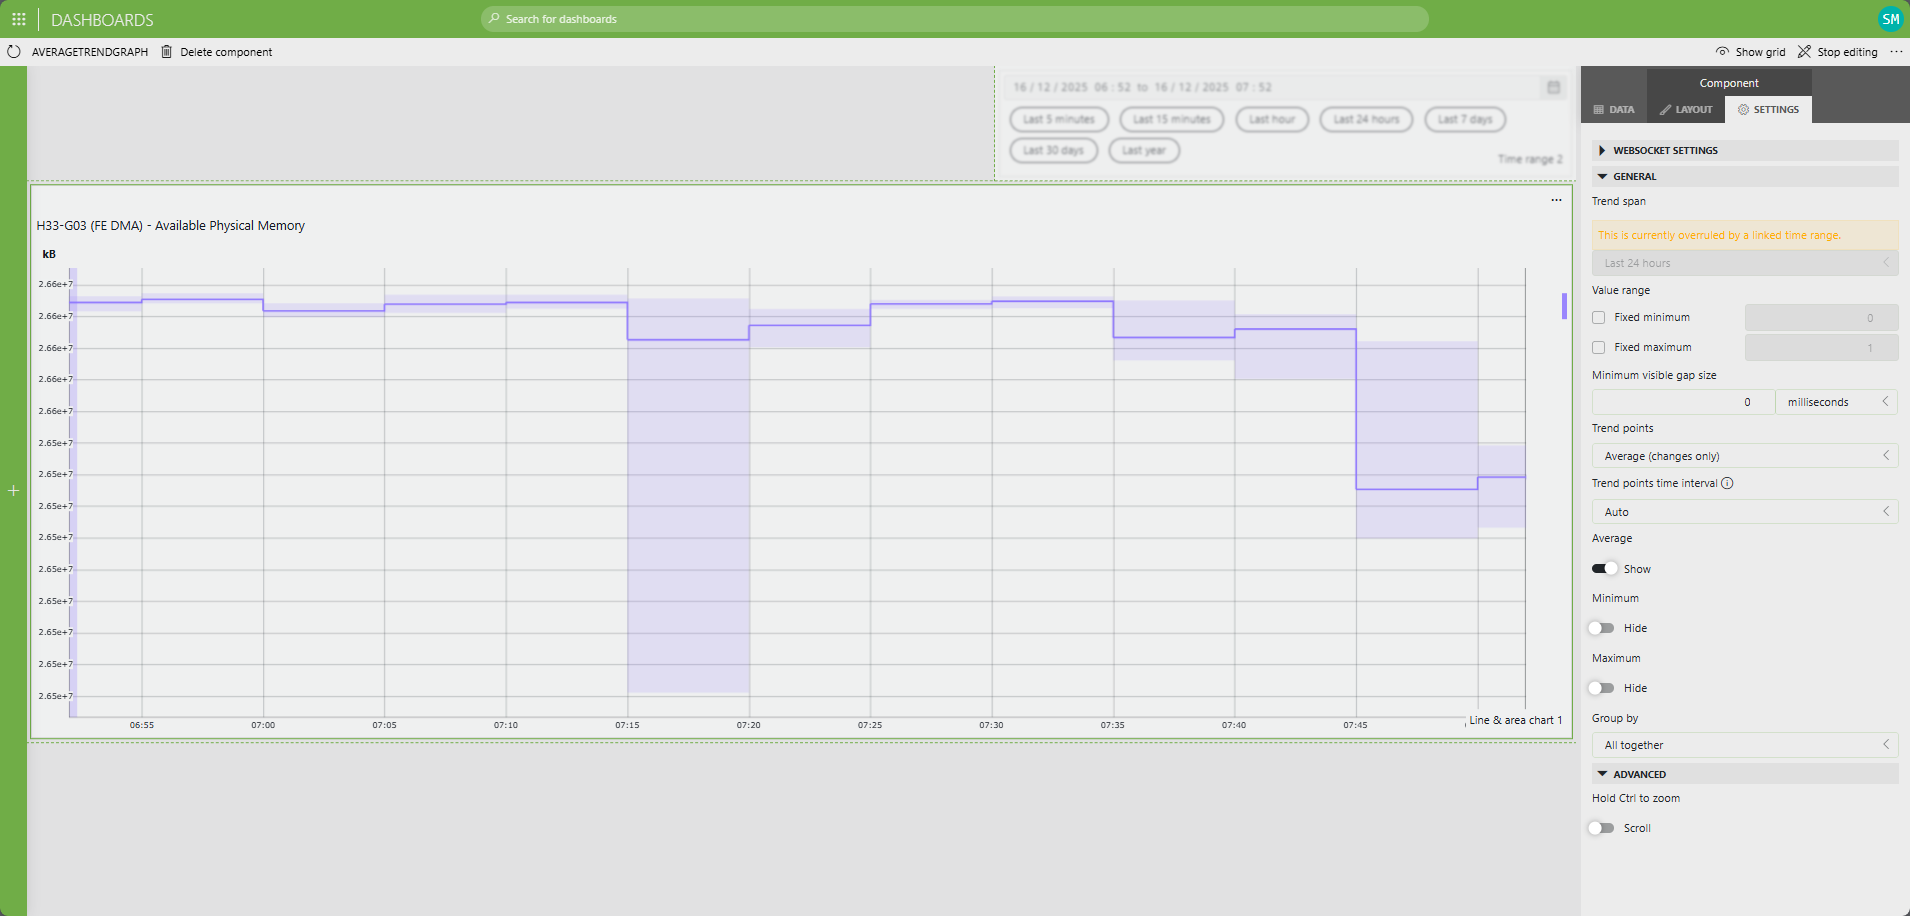
Ben Vandenberghe [SLC] [DevOps Enabler] Posted new comment 1 day ago
Stefan Schedletzky [DevOps Enabler] commented 2 days ago

Hi Shawn,
thanks for the picture. But is it only showing the average line and not the value over time?

Shawn Michaud [SLC] [DevOps Member] commented 2 days ago

When you say "value over time" what value are you interested in if its not average, are you looking for Realtime, Max, Min, etc?

Ben Vandenberghe [SLC] [DevOps Enabler] commented 2 days ago

Stefan wants to see the average of all the values in the current time window he's looking at. That is not supported in the dashboard component. In the LAYOUT tab though (next to the SETTINGS tab shown in the capture above) you will find at the bottom ADDITIONAL LINES, and there you can choose to display a PERCENTILE LINE – not exactly the same as an average, but you can set it to 50% to get the Median value. Also, with the QUERIES (GQI) you do have the option to query the trend data and to calculate the average (get the trend data and do an aggregate and choose average). Now this is going to give you a separate metric on your dashboard of course, next to your trend graph (but could link both in terms of adapting to the same time span). Hope this might help a bit.

Stefan Schedletzky [DevOps Enabler] commented 1 day ago

I have now a solution with an automation script for my Visio drawing. User can click on it and via UI he can click calculate and define the time in hours.
I tried my luck with QUERIES but I was not able to geht the trend data and show an average value. Only for tables average over a column, but not for trend data.
Is there any example for it?

Ben Vandenberghe [SLC] [DevOps Enabler] commented 1 day ago

Hi Stefan – I actually overlooked an option which is exactly also doing this. There's also a "Trend Statistics" component in the dashboards (you can find it in the section "Other" of the widgets). You can link this to a trended metric, and instead of the graph it will show min, max and average of the data for the selected time span. With a time range component you can easily add a user-definable time selection (which can link to both a trend graph showing the trended data, and with a trend statistic component – so whatever time frame the user selects, the graph will show the data and the trend statistics will show immediately the min, average and max). So maybe this can be useful as well? (I'll add a quick screen cap in a separate response)

Please login to be able to comment or post an answer.

My DevOps rank

DevOps Members get more insights on their profile page.

My user earnings

0 Dojo credits

Spend your credits in our swag shop.

0 Reputation points

Boost your reputation, climb the leaderboard.

Promo banner DataMiner DevOps Professiona Program
DataMiner Integration Studio (DIS)
Empower Katas
Privacy Policy • Terms & Conditions • Contact

© 2025 Skyline Communications. All rights reserved.

DOJO Q&A widget

Can't find what you need?

? Explore the Q&A DataMiner Docs

[ Placeholder content for popup link ] WordPress Download Manager - Best Download Management Plugin