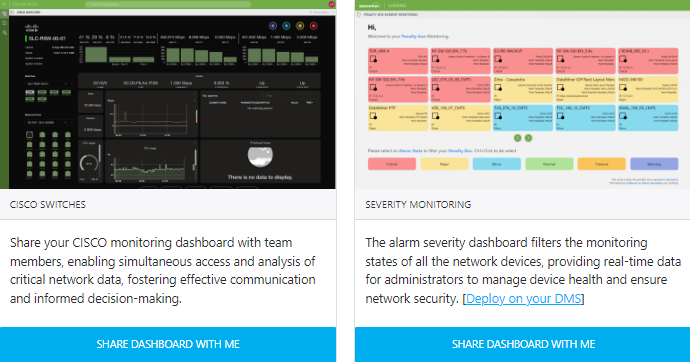
In the age of information, data has become the lifeblood of businesses and organizations worldwide. With the growing volume and complexity of data, the need for powerful and user-friendly data visualization tools has never been greater.
The rollout of dataminer.services offers a variety of cloud-powered features, including Live Dashboard Sharing. This innovative solution empowers users to collaborate, analyze, and share real-time data insights with both internal and external users with one click of a button.
At its core, a live dashboard is a visual representation of data that updates in real time. It aggregates various data sources and presents the information in a concise, visually appealing, and interactive manner. Live dashboards allow users to monitor critical metrics, trends, and KPIs continuously, enabling a faster and more informed decision-making process.
The “sharing” aspect of Live Dashboard Sharing takes this a step further by facilitating the seamless distribution of these live dashboards with others, both within and outside an organization. Users can easily collaborate and exchange insights with team members, clients, or stakeholders in real-time. This real-time access to data promotes enhanced communication, enables quicker responses to emerging trends, and fosters a data-driven culture within the organization.

Benefits of Live Dashboard Sharing
Enhanced data collaboration
Foster a collaborative environment where teams can work together in real time, regardless of physical locations. This promotes synergy among different departments and encourages data-driven decision-making across the organization.
Simplified data accessibility
Unlike traditional data reporting, which often involves generating static reports that become outdated quickly, live dashboard sharing allows stakeholders to access and interact with up-to-date data in a flash. It eliminates the need to constantly request or recreate reports, making it easier to share anything, be it KPI and SLA metrics with different stakeholders or more technical metrics with the Engineering department.
Real-time insights
By sharing live dashboards, teams can access the latest data updates and key metrics instantly. This enables timely reactions to changing market conditions, customer preferences, and emerging opportunities.
Keep an eye on this page as new dashboards are being added every few weeks! You’ll be able to easily deploy them to your DataMiner system with the click of a button.