solution Use Case
Using Dashboards and GQI to correlate alarms to views and readings
Roberts Communications Network (RCN), the leading communications services provider to the pari-mutuel industry, needed a way to quickly see the status of their generators and UPSs at remote sites. In their DataMiner System, the Surveyor view structure grouped the equipment into local sites, so the Generic Query Interface (GQI) was used to correlate the views, parameters, and alarm states for each site to present the desired information. In our Skyline lab system, this concept was then further expanded into an OTT monitoring solution for services and failure point notification (router, ingress, or egress). You can view this solution on our ziine demo system. If you’re not familiar with this system yet, go to Online DataMiner Systems for information and to gain access.
USE CASE DETAILS
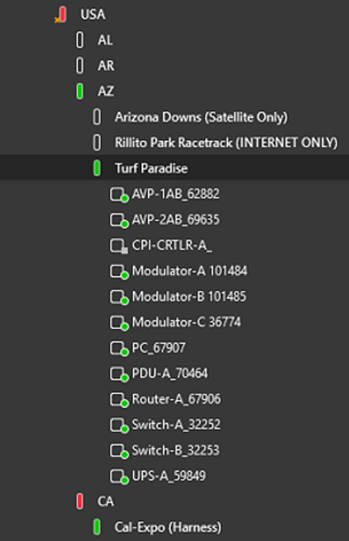 The tree structure of the RCN Surveyor goes from country to state, city, site, and finally equipment. The equipment name is the same for each site except for an identifier number at the end of the name. This means that GQI has to use the “Get View Relations” and “Get Views” functions to correlate data to the site.
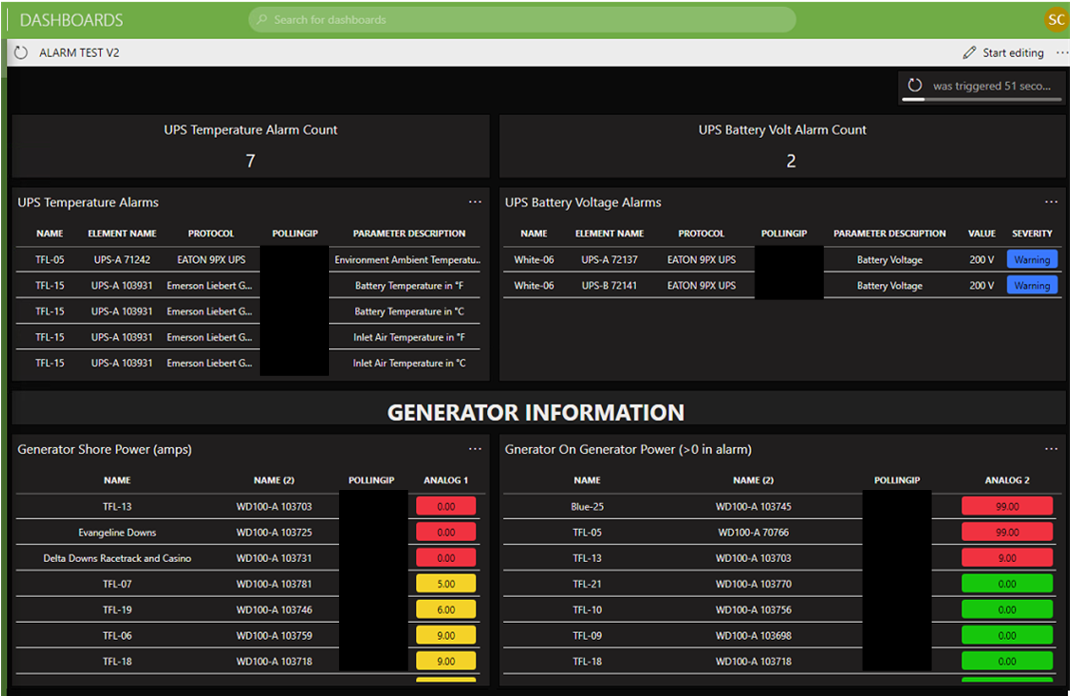
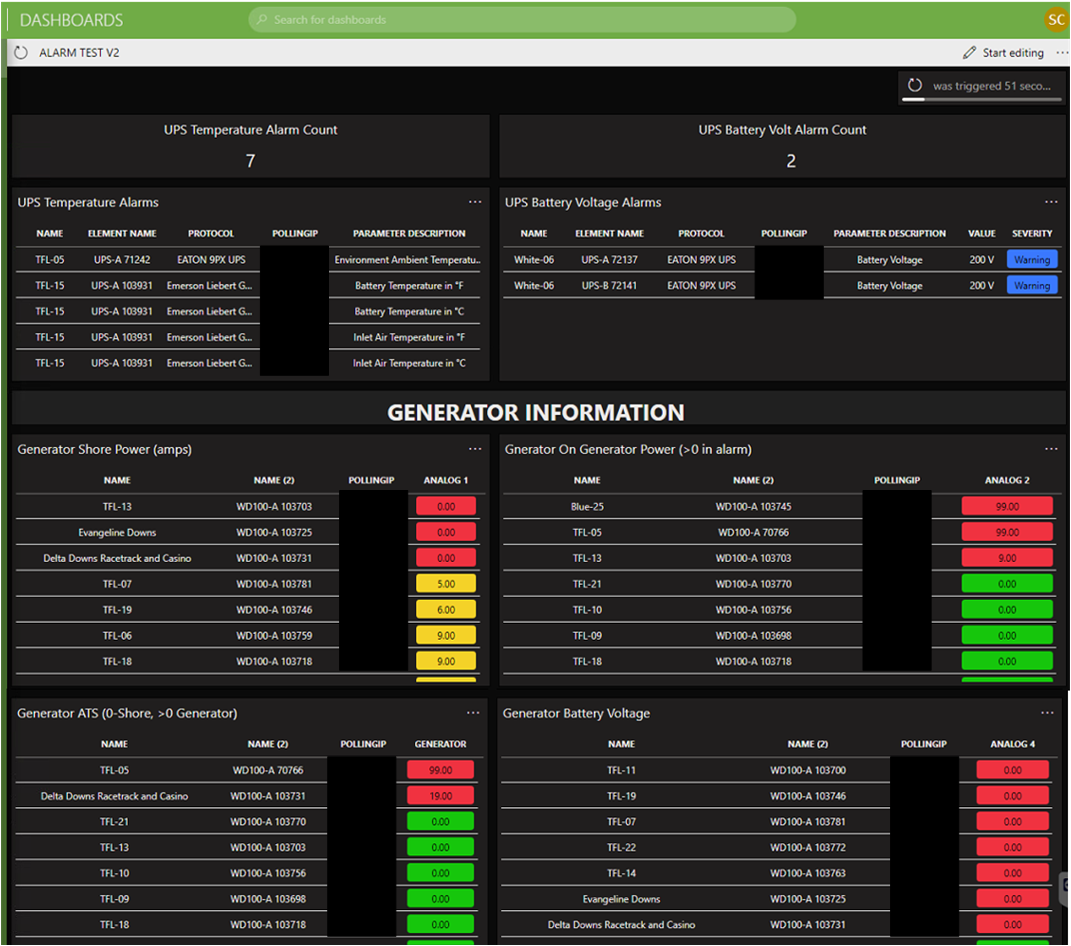 Based on the collected view information, the dashboard then has to show UPS alarms for temperature and battery voltage, along with select generator parameter readings (Shore Power, Generator On, Generator ATS, and Generator Battery Voltage). This allows operators to quickly know which locations are running off generator or UPS rather than shore power. They can also see the current generator status to verify availability for all sites if needed.
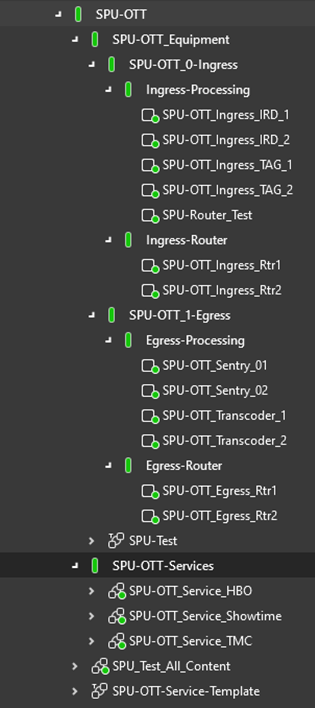 On our ziine demo system, the solution is available as an OTT service status dashboard. The GQI setup and dashboard reference a similar Surveyor structure and show the OTT information correlated to each view (Ingress, Egress, and Router).
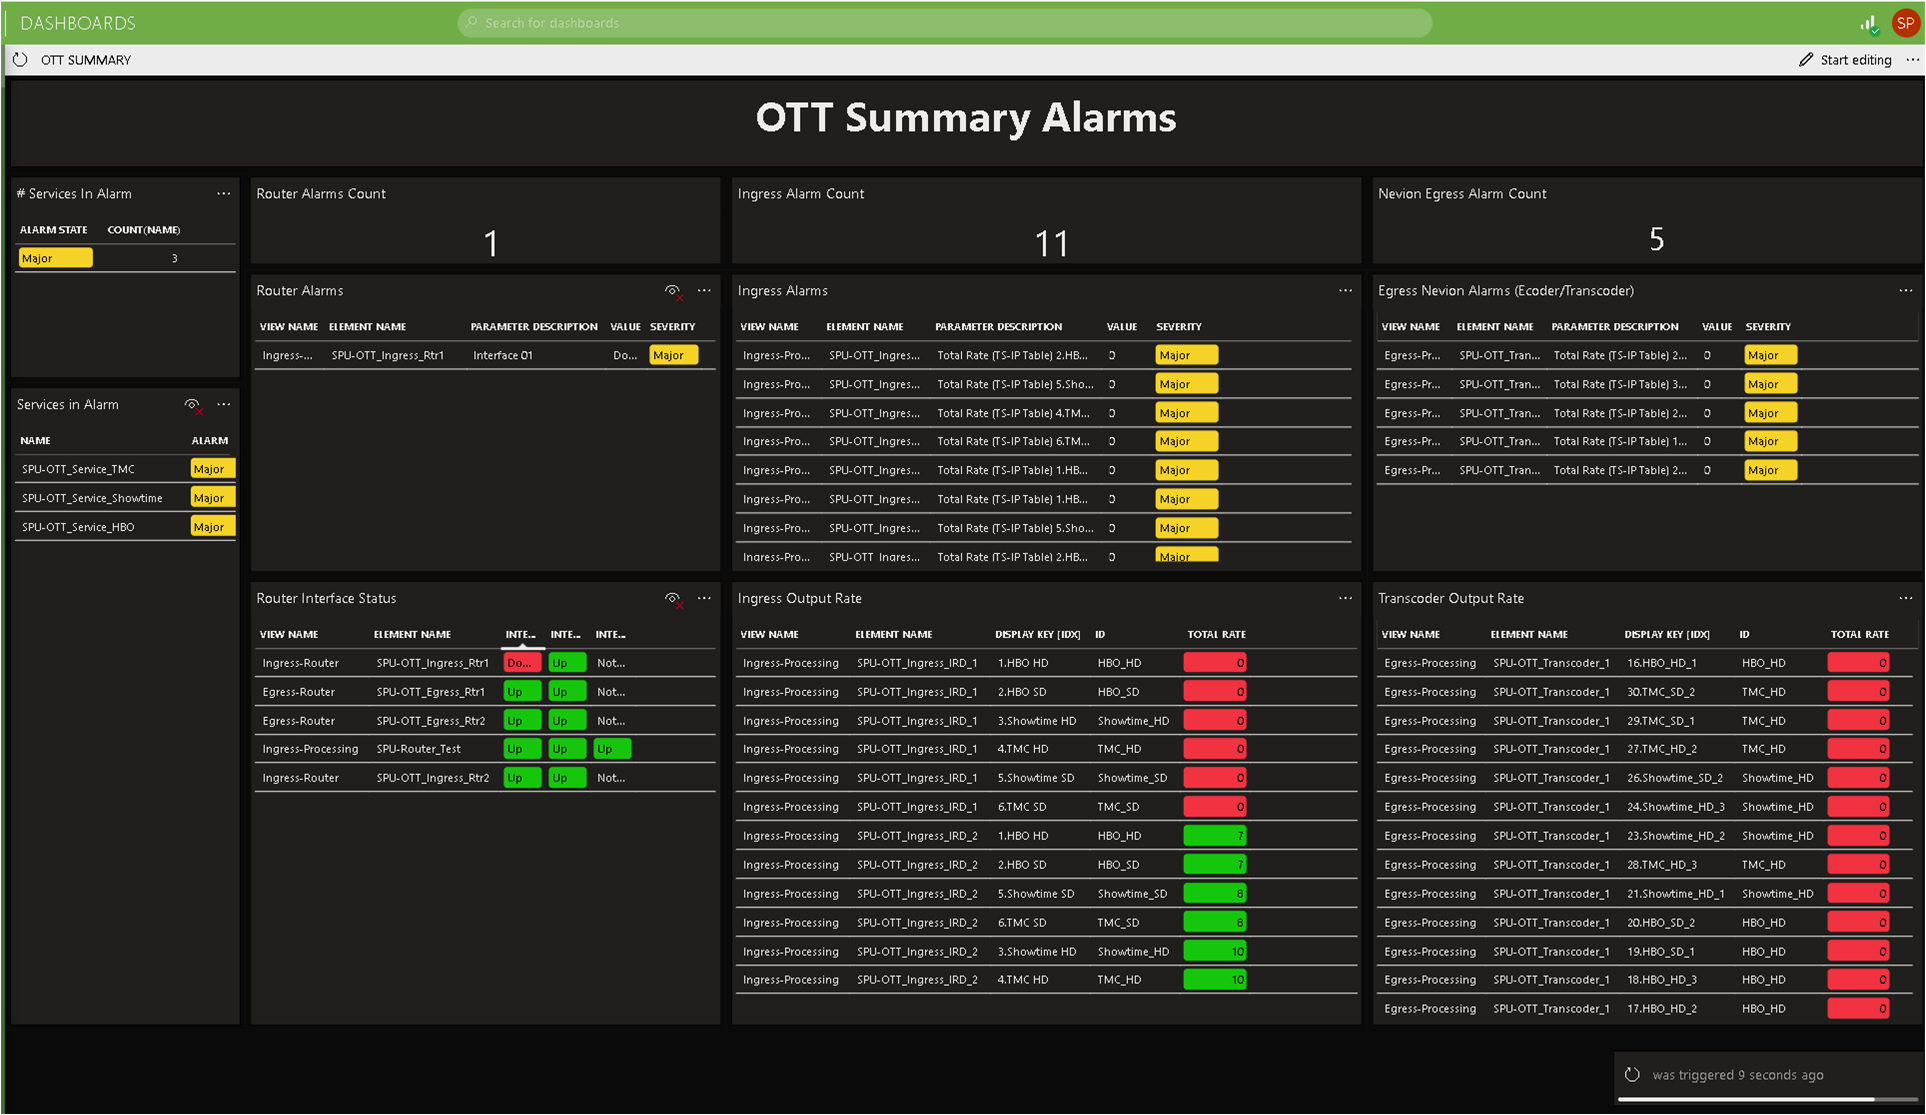 The overall OTT Summary dashboard shows the following information grouped by the associated Surveyor view and element names: the number of services by alarm severity, a penalty box of services in alarm, the number of alarms and the active alarms by router-, ingress-, or egress-related equipment, parameter-specific information for router interfaces, and ingress and egress rates by Surveyor view location.
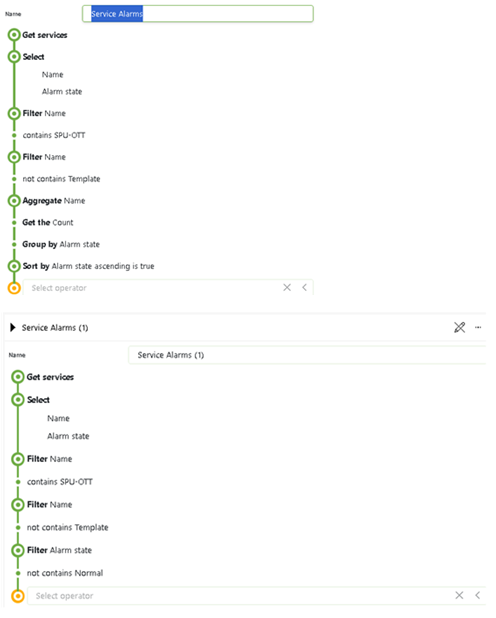 To create this dashboard, GQI queries were used that retrieve the services in alarm and service alarm count. These are based on a "Get services" function, which is then filtered by service name and filtered or aggregated by name to provide a list and count of each alarm state (i.e. severity).
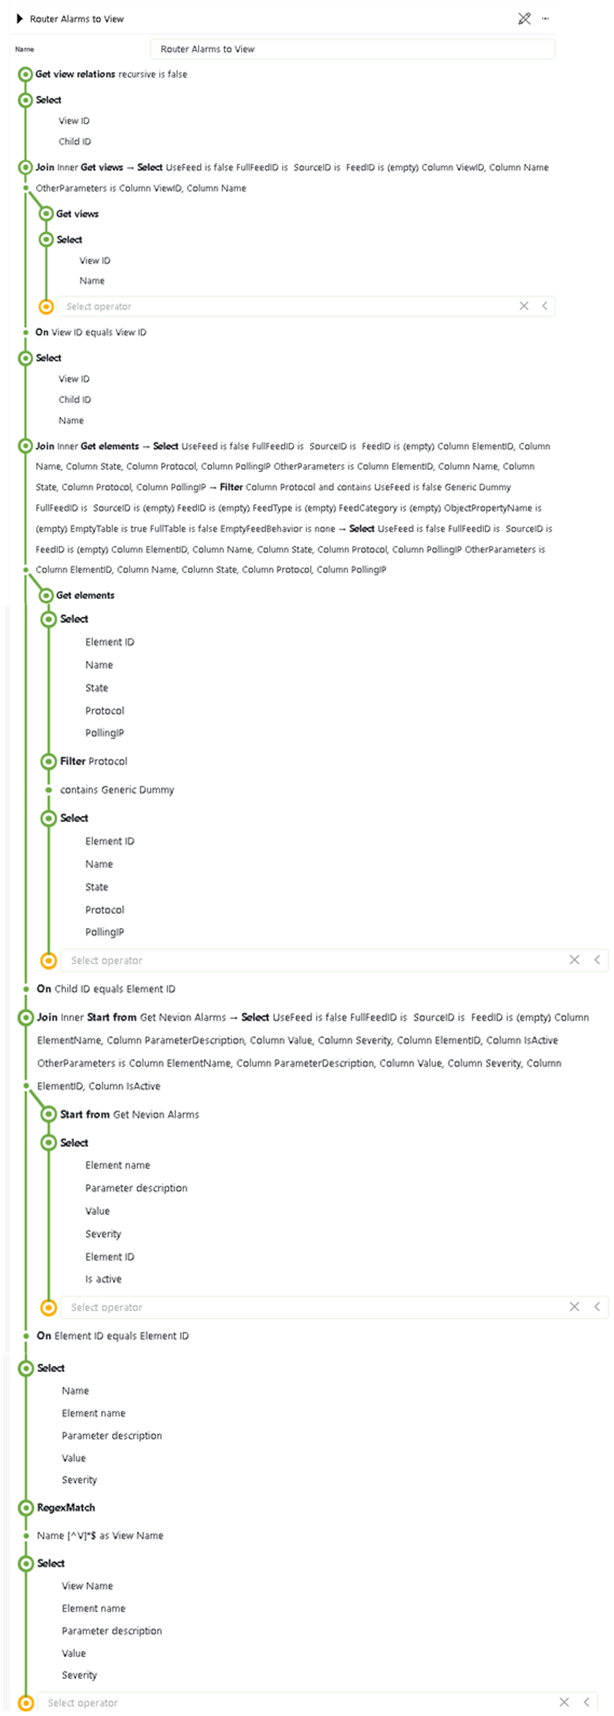 For the router, ingress, and egress alarm list sections, the “Get view relations” and “Get views” functions were used with multiple query joins to correlate and filter the alarms by Surveyor view names. A query was created for each required view filter (router, ingress, and egress).
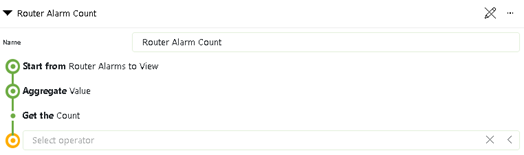 To show the alarm counts, another query was created based on the query above, which was then aggregated to show the alarm count.
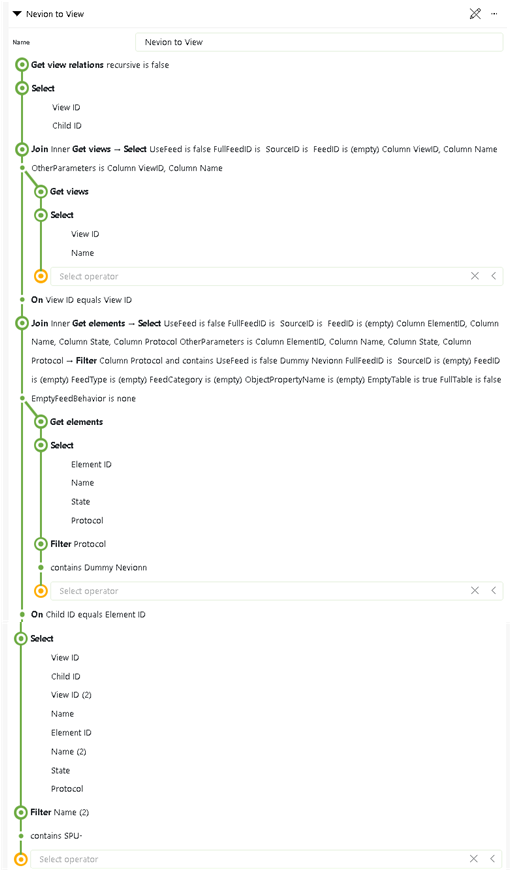 To generate the element parameter data, a first GQI query was needed to correlate the desired equipment to the associated view. This is the starting point for a second query to collect the desired parameters by matching the element to the view.
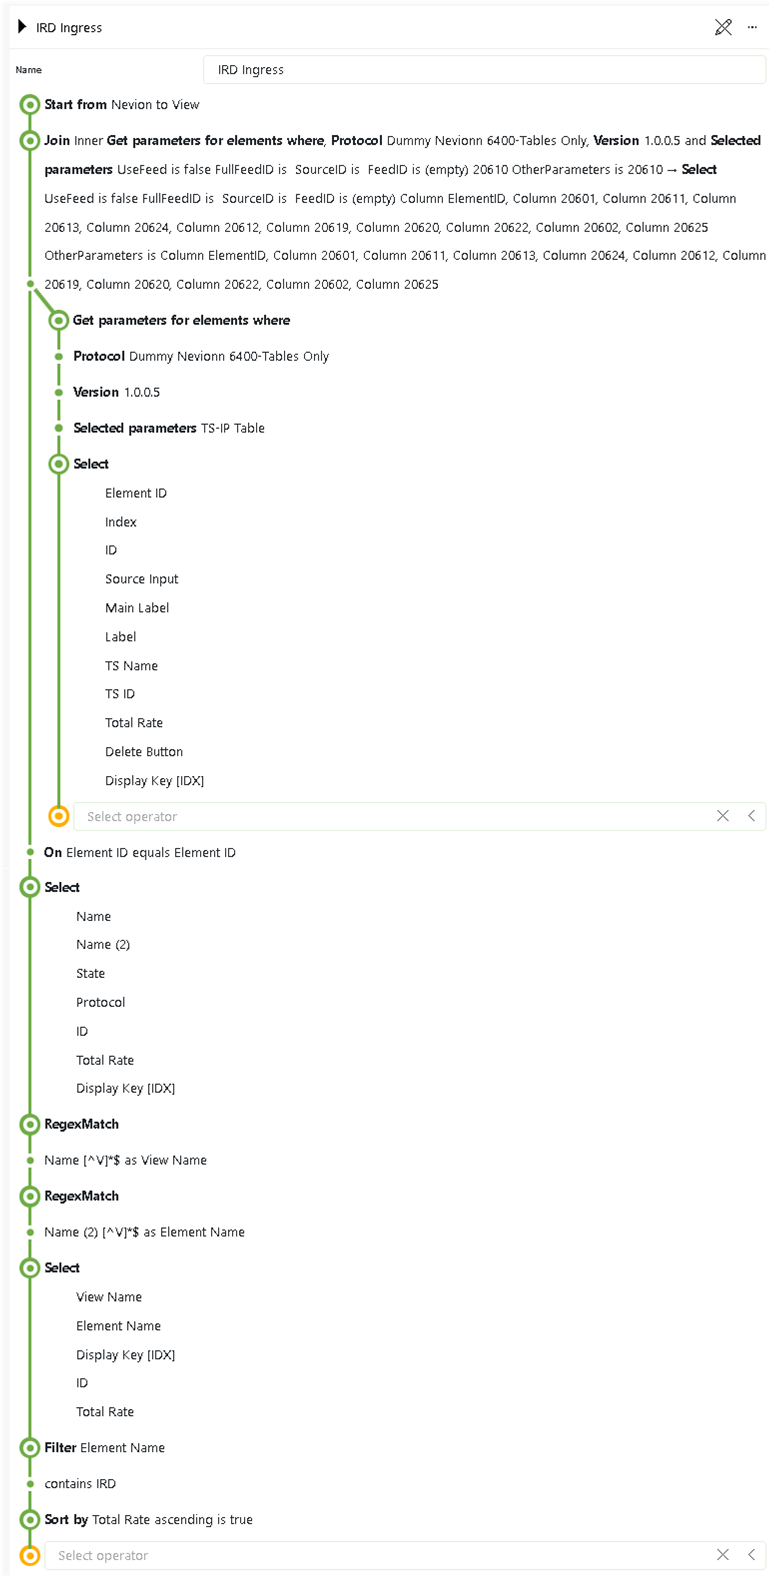 The second query collects the element parameters, starting from the view-to-element relation query.
1 thought on “Using Dashboards and GQI to correlate alarms to views and readings”
Leave a Reply
You must be logged in to post a comment.
Wonderful application for external plants.