
solution Use Case
The PTP Infrastructure Monitoring solution: end-to-end timing & synchronization observability

In all-IP broadcast production environments, clock synchronization is mission-critical. A minor phase drift, an undetected grandmaster failover, or a subtle configuration mismatch in the PTP stack that might have a bad impact on the Best Master Clock Algorithm (BMCA) can compromise synchronization across an entire broadcast chain within milliseconds.
Managing a modern Precision Time Protocol (PTP) infrastructure is inherently challenging, as PTP environments are always multi-vendor. Timing architectures span master clocks, core spine-leaf switches, and media endpoints from different vendors, each with proprietary management tools. General hardware alarms frequently obscure critical timing issues, while subtle discrepancies across BMCA priorities, domains, or message rates remain hidden until an unexpected, disruptive master election occurs.
The DataMiner PTP Infrastructure Monitoring standard solution addresses these operational hurdles by providing a centralized observability and management platform for multi-vendor PTP (IEEE 1588) networks, delivered through a zero-footprint web application deployed directly on DataMiner.
A fundamental advantage of the solution is its in-connector mediation layer. Equipment vendors frequently expose identical BMCA configuration parameters in fundamentally different numerical formats—such as expressing PTP announcement rates in decimal (DEC), hexadecimal (HEX), or logarithmic (LOG) values. Without normalization, verifying that every node in the domain shares consistent settings is nearly impossible. DataMiner automatically normalizes these disparate values into a standardized schema, enabling reliable, instant cross-node audits without requiring intermediate mediation drivers.
The solution delivers:
- Real-time synchronization health: Track active grandmaster status, BMCA parameters, lock states, and follower counts across the domain.
- Integrated PTP packet analysis: Interface directly with dedicated third-party PTP network analyzers and hardware probes to capture in-depth packet telemetry, providing live trend graphs for Offset from Master and Mean Path Delay.
- Focused dual-scope alarm triage: Distinguish general equipment hardware alerts from dedicated PTP timing alarms to isolate root causes without operational noise.
- Proactive configuration comparison: Compare node parameters side by side to automatically highlight discrepancies and configuration drift across BMCA attributes.
- Automatically detected interactive network topology: Automatically detect and visualize the complete physical network topology and logical PTP clock hierarchy, featuring animated synchronization flow indicators and drag-and-drop node positioning.
- Multi-domain operational agility: Seamlessly switch between and independently track multiple PTP domains from a single interface.
Benefits of PTP Infrastructure Monitoring
PTP Infrastructure Monitoring delivers significant operational advantages over traditional, fragmented monitoring approaches:
| Capability | Traditional Approach | PTP Infrastructure Monitoring |
|---|---|---|
| Access & deployment | Desktop-bound client installations | Zero-footprint web application accessible from any modern browser |
| Multi-vendor normalization | Inconsistent parameter formats (DEC, HEX, LOG) across vendor tools | In-connector mediation providing unified parameter normalization across 30+ vendors |
| Alarm triage | Timing anomalies buried under general hardware alarms | Dedicated dual-scope alarm filtering isolating timing faults from hardware issues |
| BMCA configuration audits | Labor-intensive manual inspection of individual device parameters | Automated side-by-side comparison with instant visual mismatch highlighting |
| Packet-level observability | Disconnected probe tools requiring separate login sessions | Integrated telemetry from PTP hardware analyzers within the central workflow |
| Network topology | Static schematics disconnected from live network state | Automatically detected interactive network topology with live hierarchy and alarm overlays |
| Multi-domain governance | Separate siloed monitoring views per domain | Multi-domain switching within a single consolidated interface |
End-to-end root cause correlation
While this solution places the operational spotlight on PTP-specific parameters and clock synchronization health, DataMiner simultaneously monitors the entire underlying physical and transport infrastructure. A network link failure, dropped packets on a switch port, or a degrading SFP optical transceiver can directly destabilize PTP timing. Because DataMiner monitors the entire infrastructure stack from optics to application layers, it correlates underlying transport degradations with PTP alerts—ensuring engineering and operations teams pinpoint the true root cause of any timing degradation rapidly.
The solution is available in the DataMiner Catalog. For setup and operational instructions, see the DataMiner Documentation.
USE CASE DETAILS
Summary dashboard
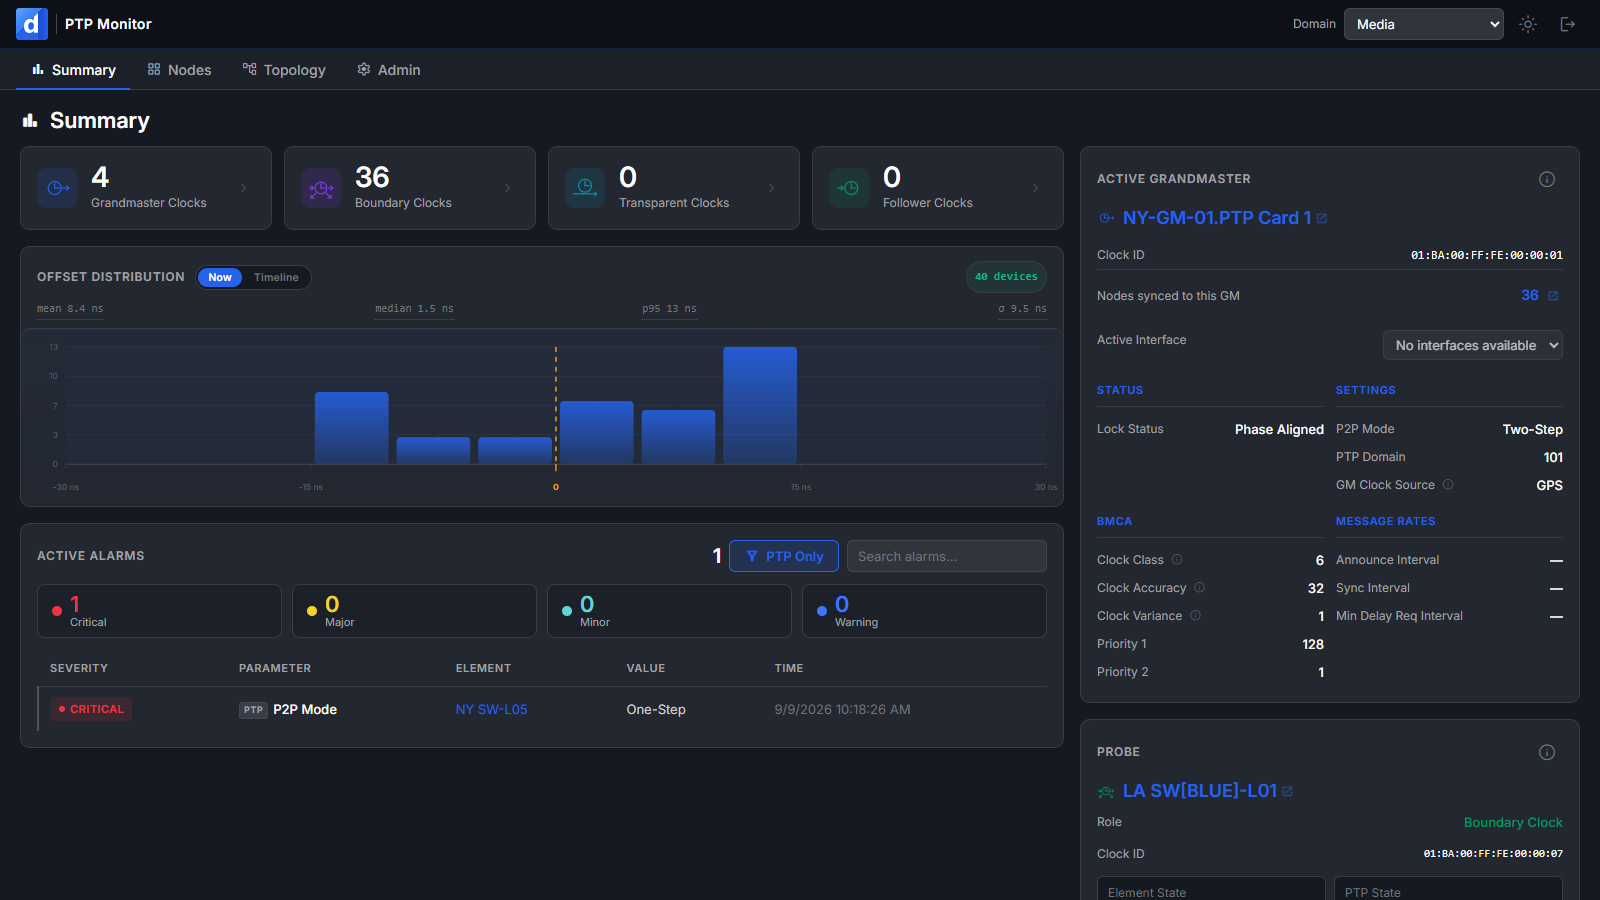
The Summary page provides an immediate operational overview of the active PTP domain:
• Active grandmaster telemetry: View the clock identity, lock state, follower count, BMCA attributes such as Priority 1 and 2, Clock Class, Clock Accuracy, and Clock Variance, and message rates.
• PTP probe stability: Follow one-hour trend graphs for Offset and Mean Path Delay, captured by dedicated hardware probes.
• Domain KPIs: Navigate directly to filtered node views for grandmasters, boundary clocks, transparent clocks, and followers.
• Targeted alarm feed: Instantly switch between PTP synchronization alarms and general device alarms.
Nodes inventory and dual alarm scopes
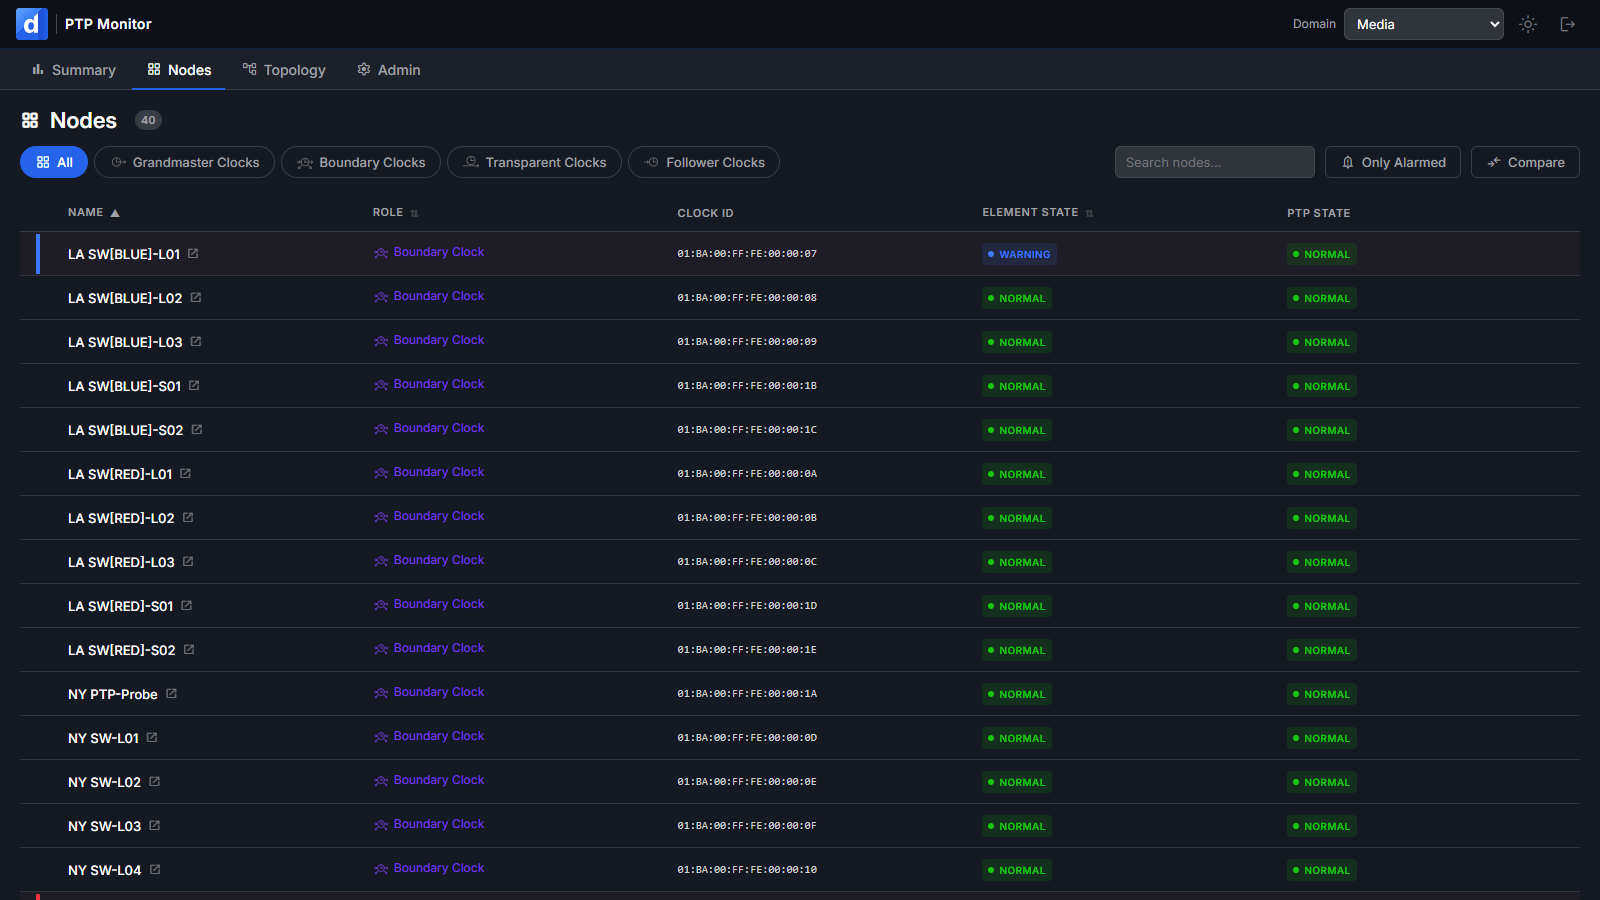
The Nodes page provides comprehensive device and clock tracking across the domain:
• Role-based filtering: Instantly isolate grandmasters, boundary clocks, transparent clocks, or follower devices.
• Dual alarm indicators: Distinguish the element state, which reflects device hardware health, from the PTP state, which reflects clock synchronization health, isolating timing degradations from equipment faults.
• Slide-out detail panel: Inspect clock datasets, port configurations, and live sparkline metrics without leaving the inventory grid.
• Fast search: Quickly locate a node by element name or clock identity.
Side-by-side node comparison
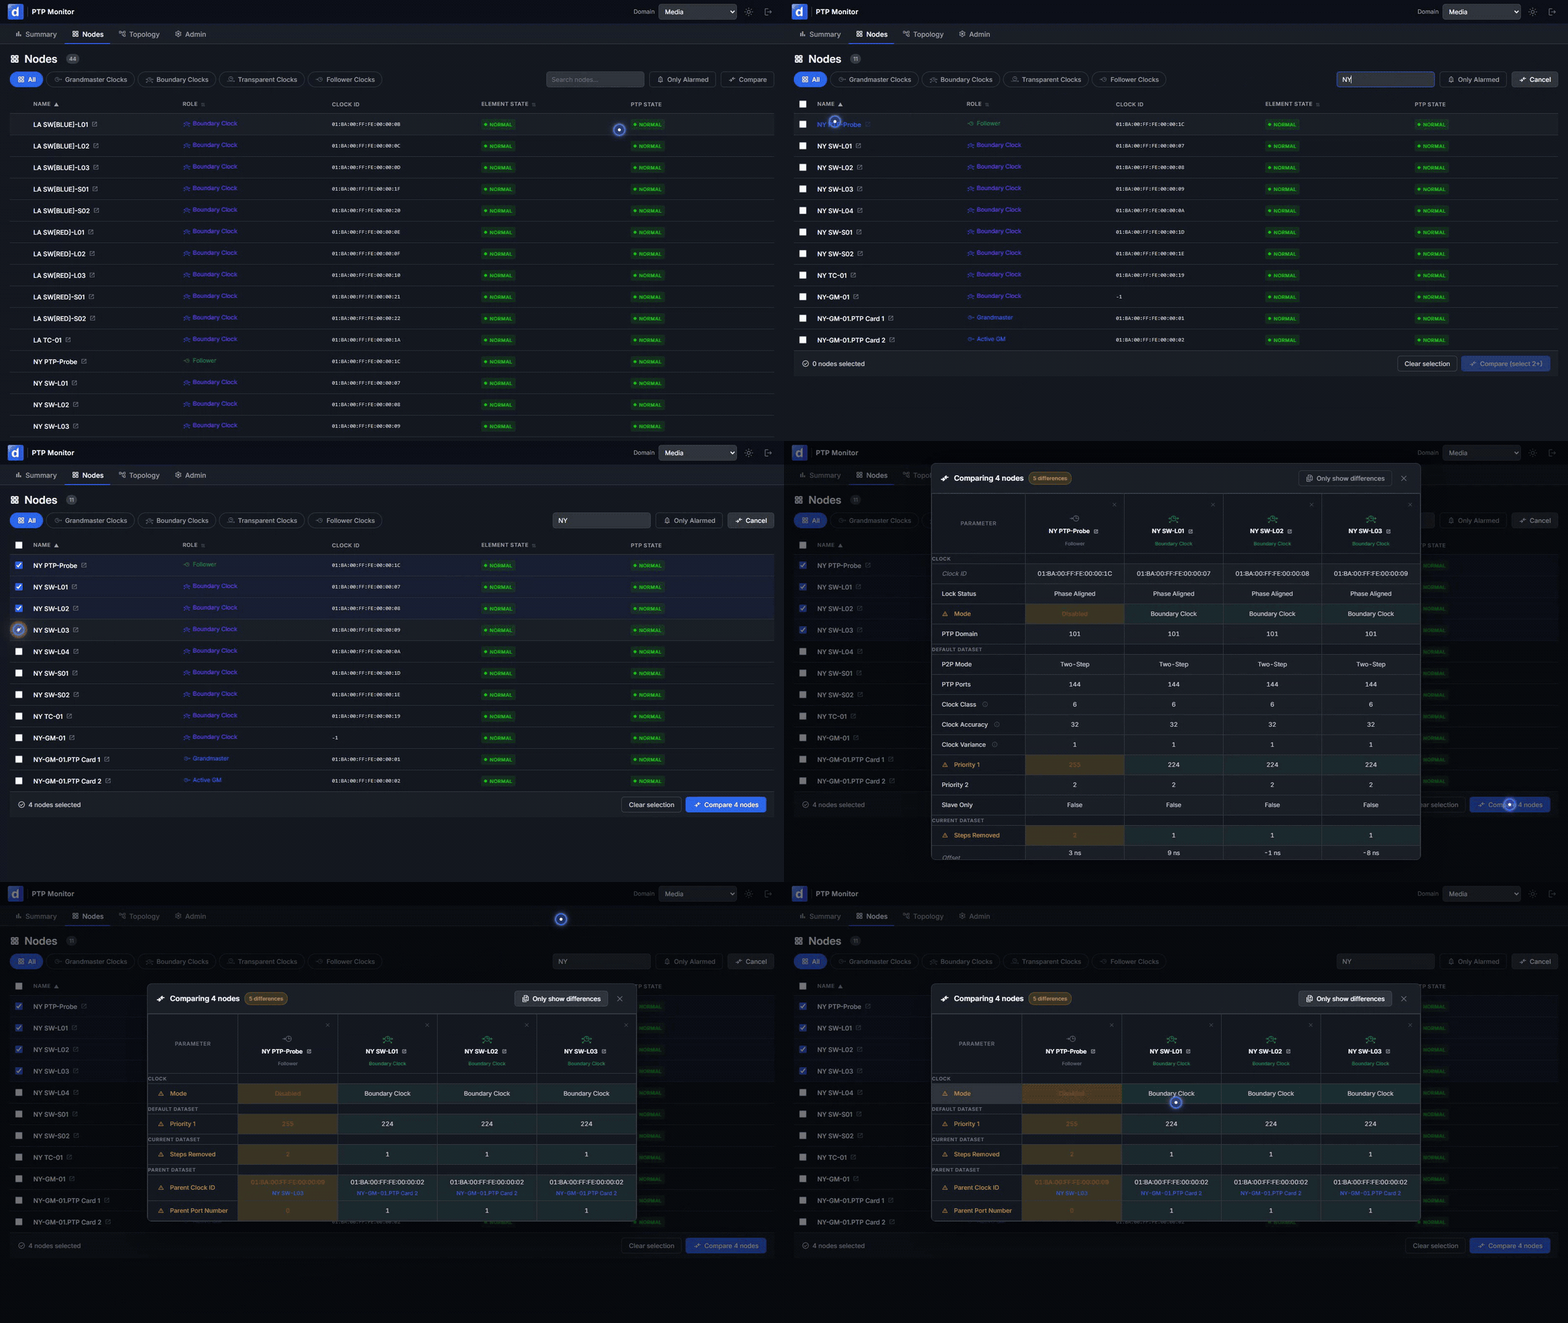
Configuration drift across nodes is a primary cause of unexpected BMCA elections. The built-in Compare panel enables rapid cross-node analysis:
• Multi-node selection: Select any combination of devices across the domain by using checkboxes.
• Mismatch highlighting: See BMCA attributes and dataset values that differ highlighted in amber, together with a total difference count.
• Differences-only filter: Hide matching fields with the "Only show differences" toggle to focus on potential misconfigurations.
• Comparative sparklines: Compare real-time Offset and Mean Path Delay stability across nodes.
Interactive network topology and hierarchy
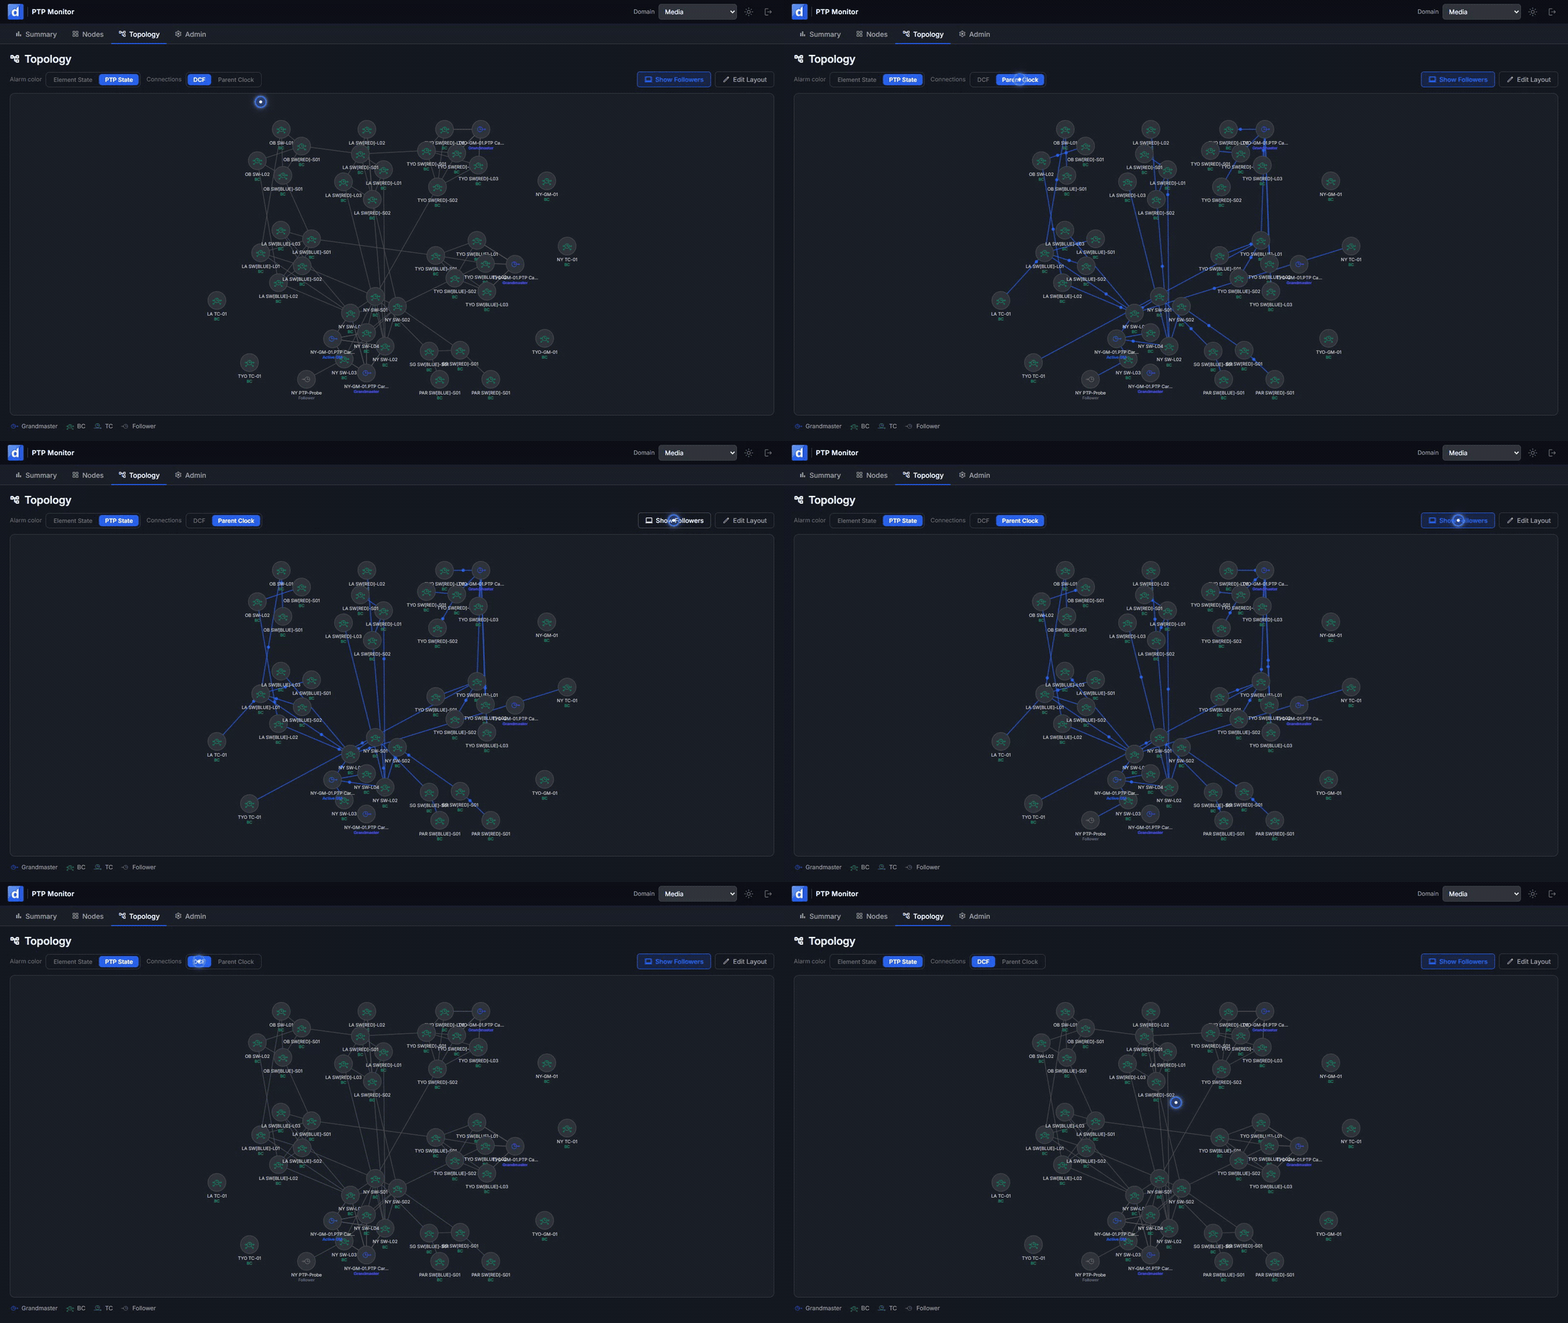
The Topology page displays the complete PTP distribution tree as an interactive graph that updates with live information:
• Two connection modes: Switch between automatically detected physical network cabling and logical Parent Clock synchronization hierarchy.
• Synchronization flow: Use animated indicators to follow the clock synchronization flow along parent-child paths.
• Follower filtering: Show or hide followers to simplify dense network views while keeping core clock trees visible.
• Custom layouts: Drag nodes to reposition them and retain coordinates for each domain.