solution Use Case
The Elements With Most Alarms dashboard
GQI
Multiviewer

The Elements With Most Alarms dashboard, available in the DataMiner Catalog, offers a ready-made overview of the 10 elements that have generated the most alarms within a specified time range.
It can be challenging to gauge the impact of devices that frequently enter and exit alarm states. With this dashboard, you can more effectively identify problematic devices within your system.
Want to try it out yourself?
Deploy the Elements With Most Alarms package directly from the DataMiner Catalog.
Note: To use this dashboard, DataMiner version 10.4.0 or higher is required.
USE CASE DETAILS
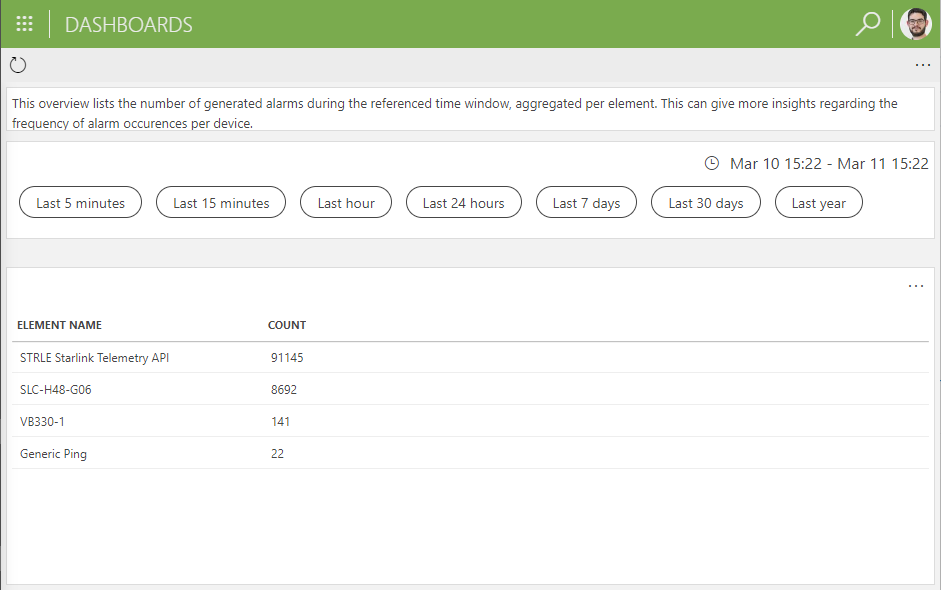 The dashboard displays the 10 elements with the most alarms within the specified time range. The first column of the table component shows the element, while the second column indicates the frequency of the alarm occurrence.
If an alarm is not linked to a specific element, the DataMiner Agent name is shown in the first column instead, akin to how it is done in the Alarm Console in DataMiner Cube.
You can select the desired time range using the time range feed component located above the table.
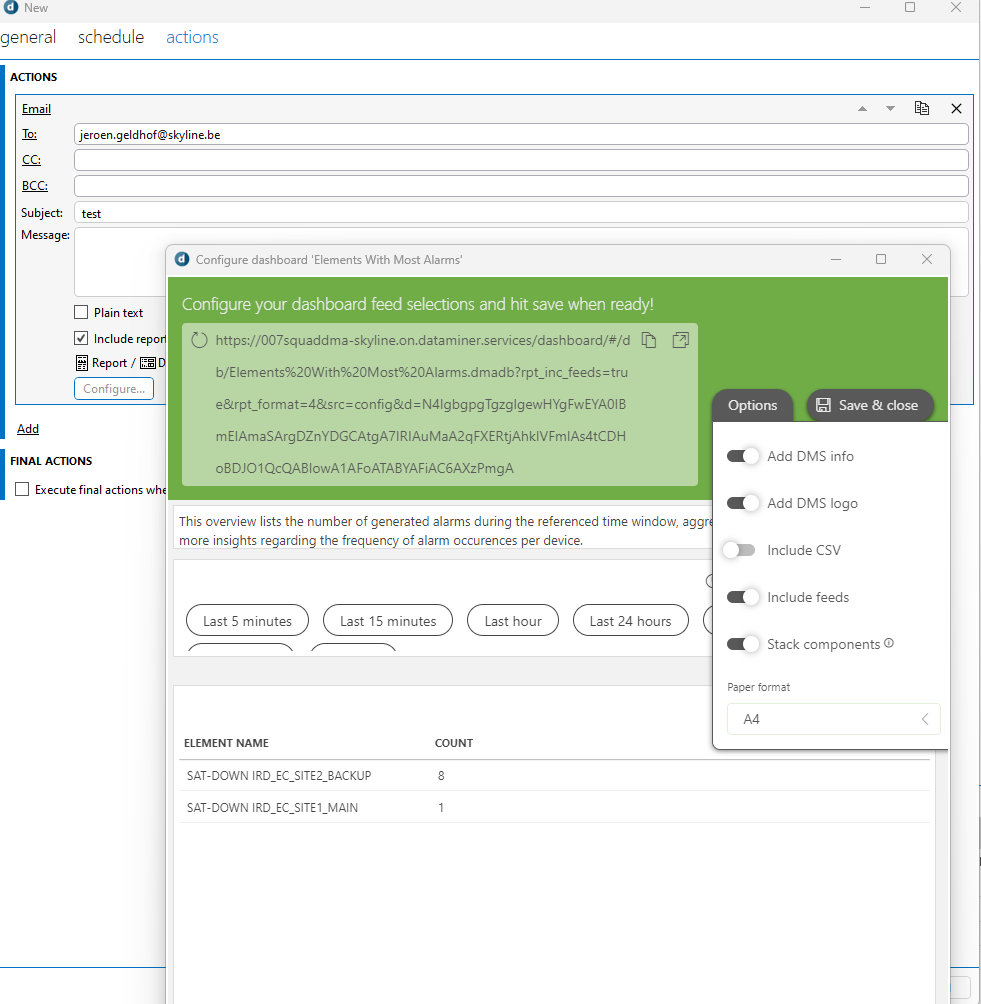 When you include the dashboard in a scheduled email set up using the Scheduler module, you can configure the time range feed component to, for example, display the elements with the most alarms for the last hour only.
 Additionally, by clicking the Options button in the top-right corner of the configuration pop-up window, you can set additional preferences. In this example, we chose to include feeds.
For more information about the Scheduler module, see
Manually adding a scheduled task
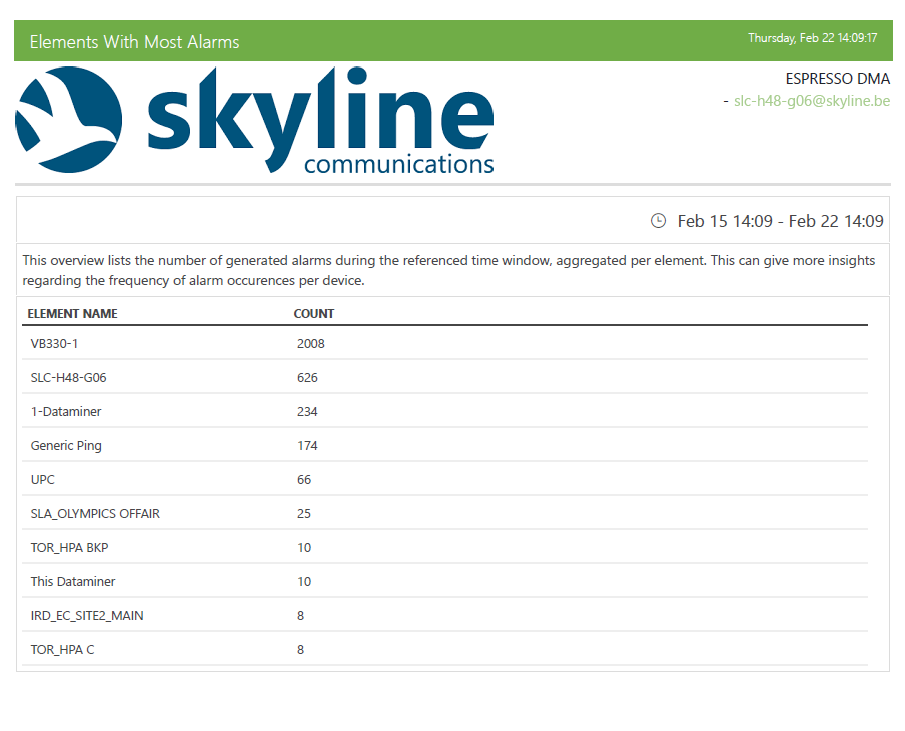 Once you have successfully created the scheduled task, specifying the interval and time for the email, you will receive an email report in your mailbox at the chosen time. You now get an overview of the elements generating the most alarms without even having to consult the dashboard. Singling out potentially problematic elements has never been easier.