integration Use Case
TestTree – Tech Partner Integrations
Enensys

Take a look at how DataMiner Dashboards are used to visualize data retrieved from TestTree’s probes:
- TestTree StreamProbe
- TestTree EdgeProbe Advanced
USE CASE DETAILS
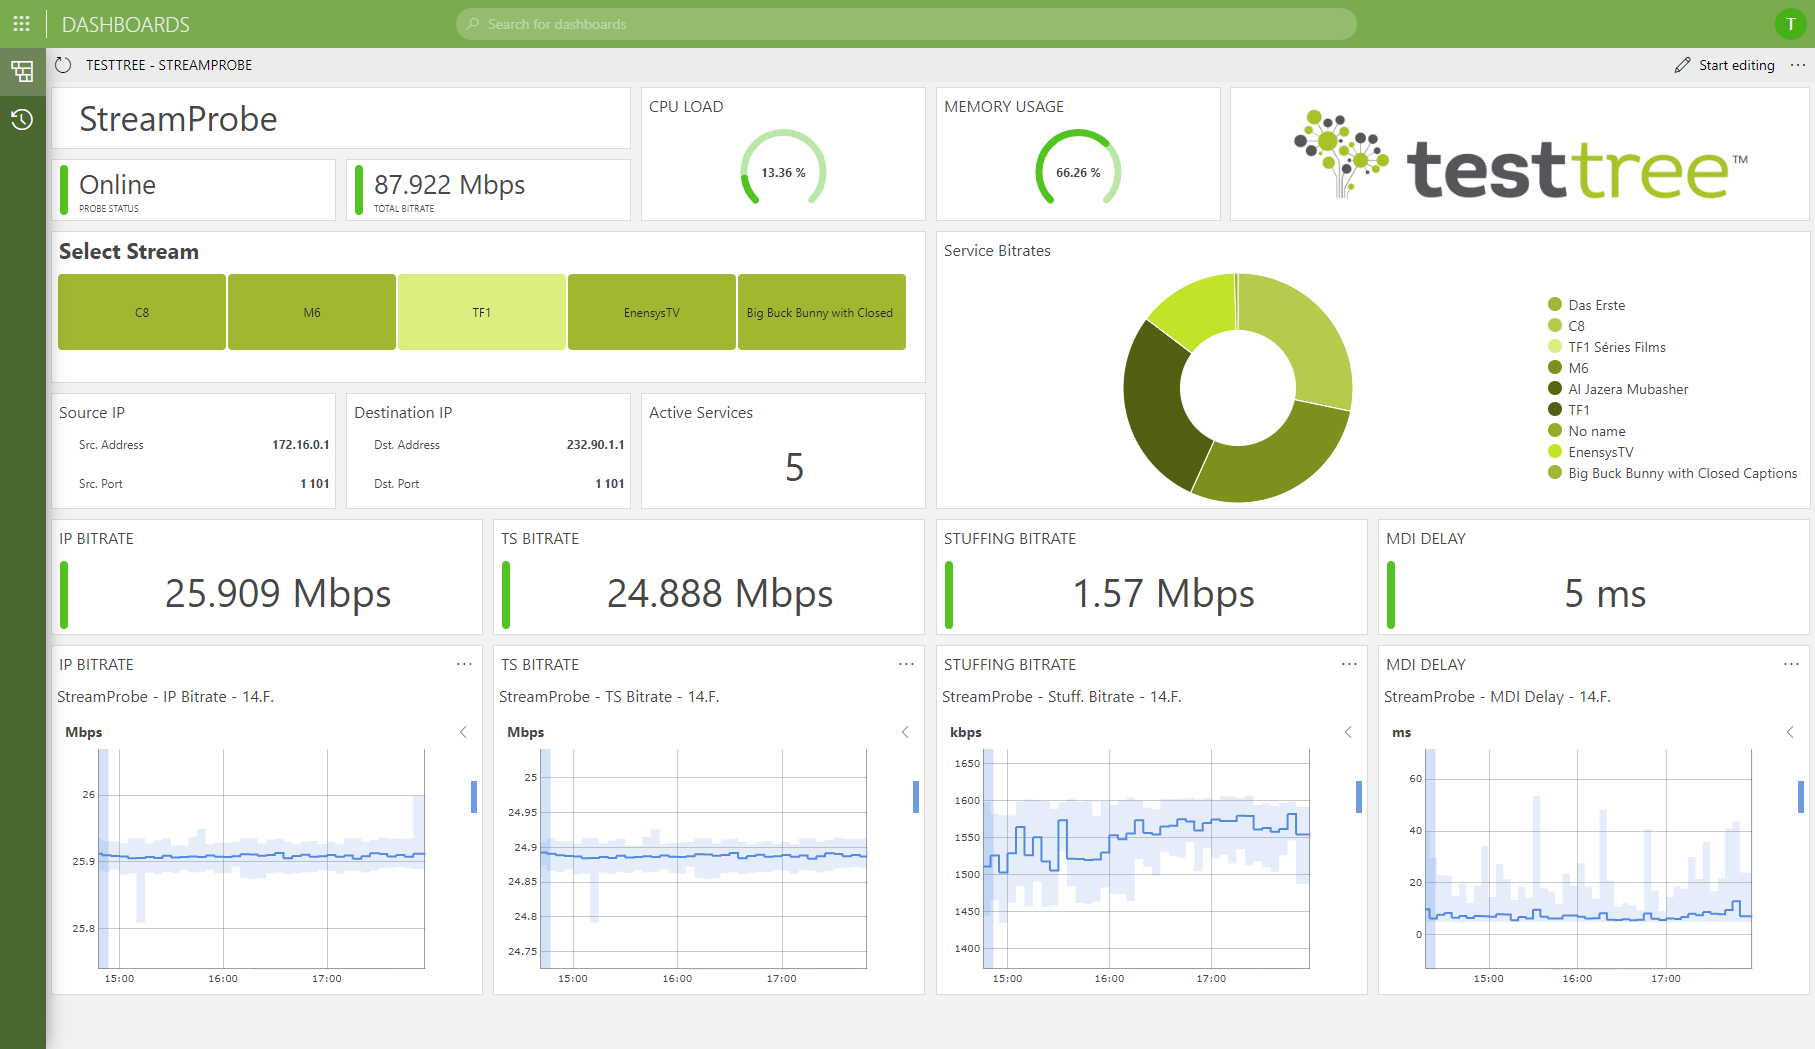
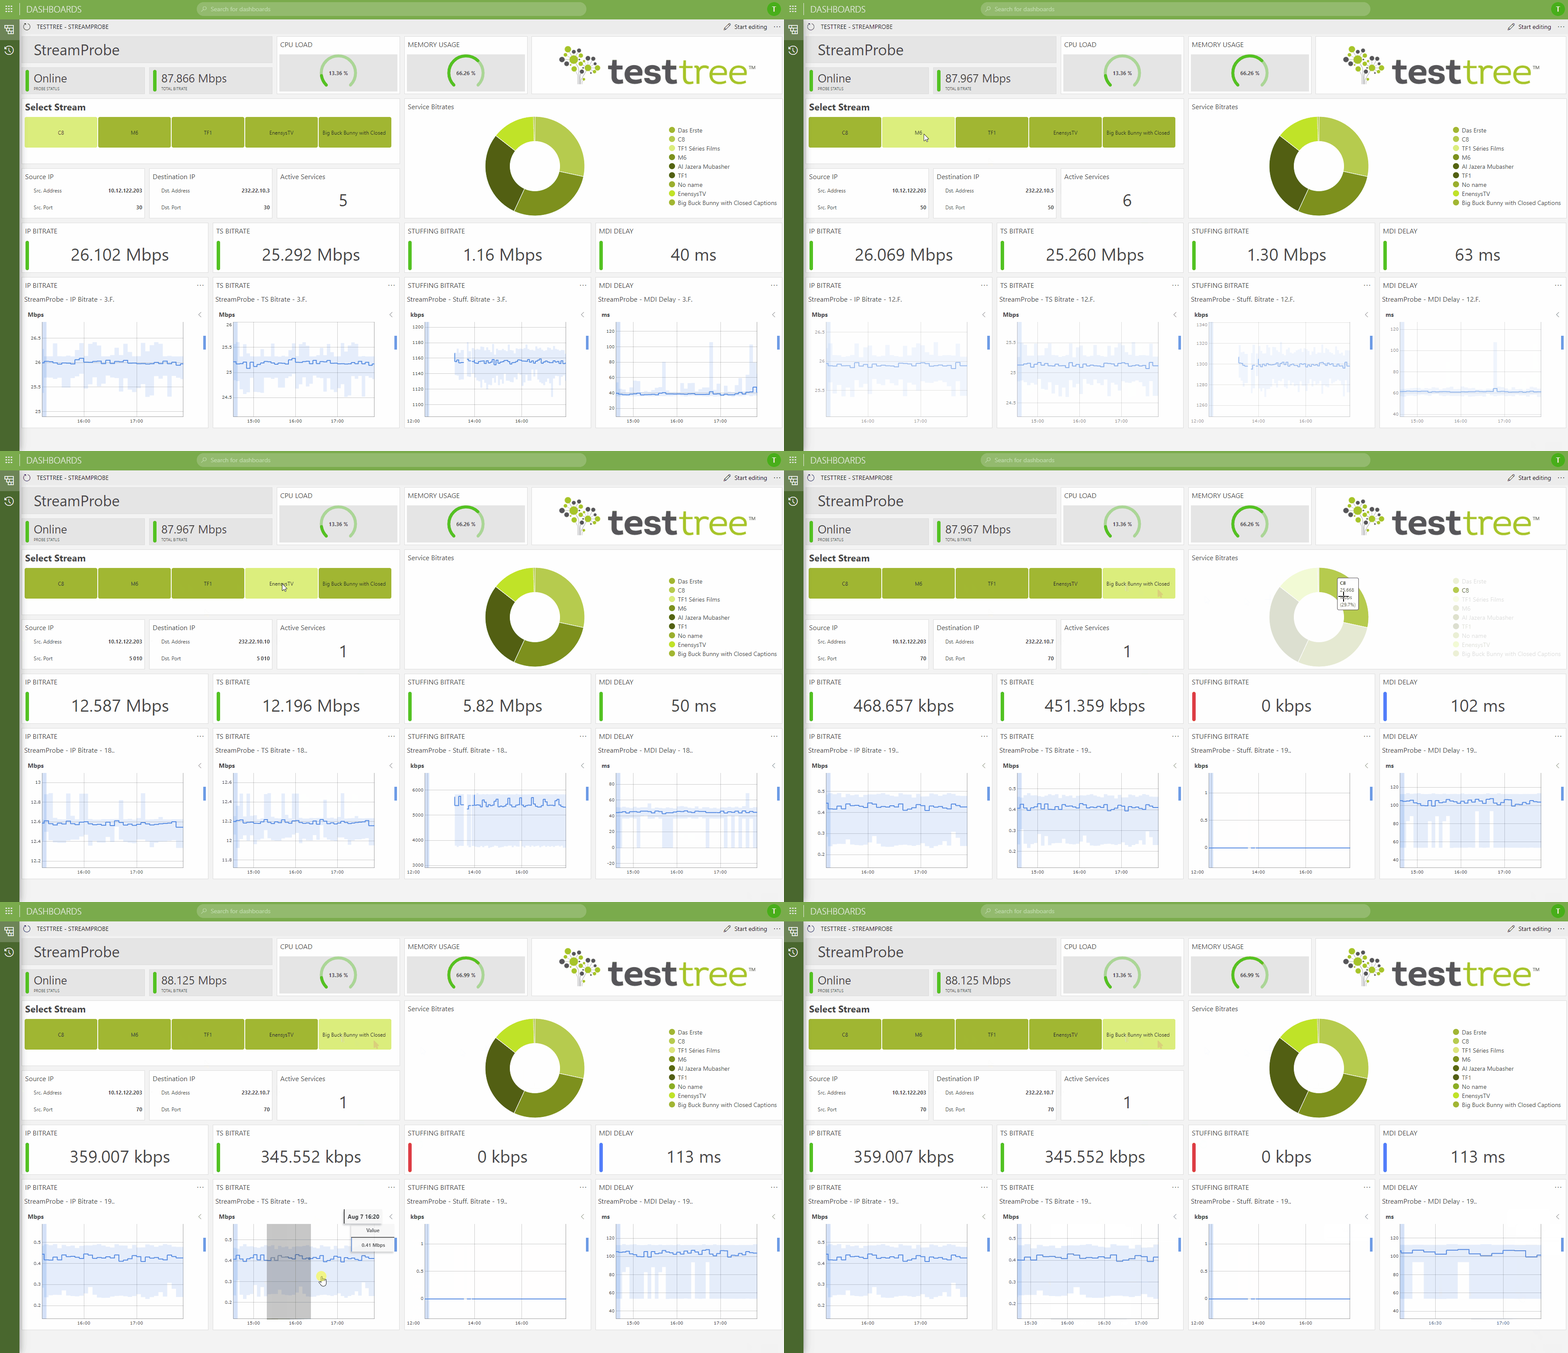
 This example dashboard showcases data collected from a TestTree StreamProbe. When you select one of the active streams, you can immediately see the most important KPIs like IP and TS bitrates or the multicast-source IP and group. DataMiner also monitors the underlying hardware, e.g. CPU and memory utilization.
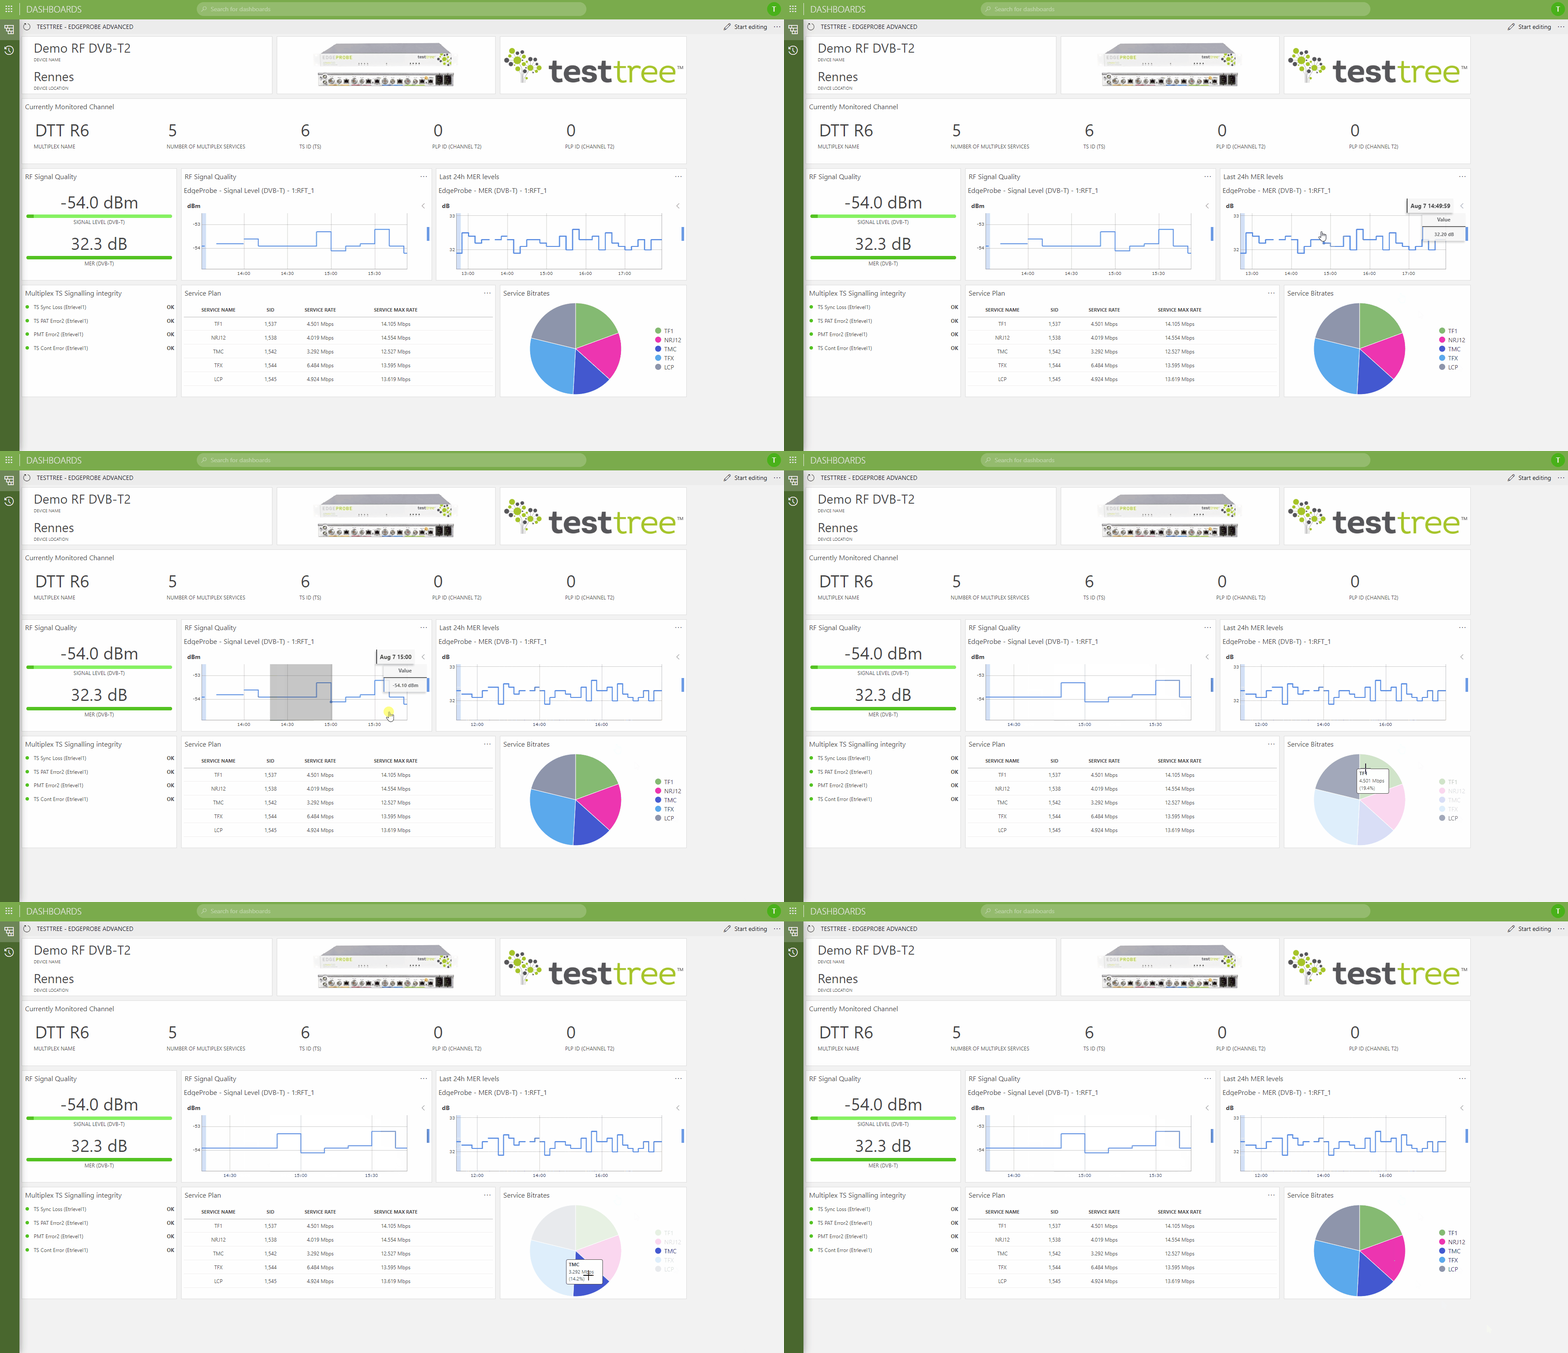
 This dashboard displays metrics from a TestTree EdgeProbe Advanced, designed for monitoring a DTT multiplex. Within this dashboard, you find metrics related to RF signal quality, as well as details about the individual services of that multiplex, such as current and maximum bitrates.