solution Use Case
Starlink Enterprise

In today’s fast-paced digital landscape, efficient connectivity management is crucial for businesses to thrive. Whether maintaining a fleet of terminals or ensuring seamless communication across remote locations, real-time insights and control are indispensable. That’s why we’re excited to unveil our latest integration with the Starlink Enterprise API, offering a comprehensive solution to revolutionize connectivity management.
Through this integration, our solution equips businesses with a holistic view of their terminal fleet.
Key Performance Indicators (KPIs) such as signal quality, bandwidth usage, latency, and uptime are now readily accessible, allowing for proactive monitoring and optimization.
One of the standout features of our integrated solution is the ability to visualize the entire terminal network on Google Maps. This intuitive interface offers a geographical representation of assets, enabling you to pinpoint locations, identify potential connectivity issues, and streamline operations with precision.
In conclusion, our integration with the Starlink Enterprise API marks a significant milestone in connectivity management. By combining cutting-edge technology with user-centric design, we empower businesses to unlock new levels of efficiency, reliability, and control in managing their terminal fleets.
Stay connected with us as we continue to innovate and redefine the future of connectivity management.
Ready to explore this solution firsthand?
Kickstart your journey by deploying our solution directly from the DataMiner Catalog. The solution will initiate in simulation mode to get you started.
Does your business already have a Starlink Enterprise API account? Configure your user ID and secret within the solution to seamlessly interface with your antenna fleet data.
Notes:
- To use the low-code app, DataMiner version 10.4.2 or higher is required. To visualize the terminals on the maps component, DataMiner version 10.4.4 or higher is required.
- This connector (or package) is intended solely for use in production with Skyline’s usage-based services model. Any other use is prohibited. For more detailed information, see Usage-based services. For inquiries regarding commercial production usage, contact Skyline Sales at sales@skyline.be.
USE CASE DETAILS
 Deploy the Starlink Enterprise package from the DataMiner Catalog with one click. See also:
 Deploying a Catalog item to your system
The respective views, low-code app, element, and simulation should now be installed. You can access the Starlink Enterprise low-code app via the root page of your DataMiner System.
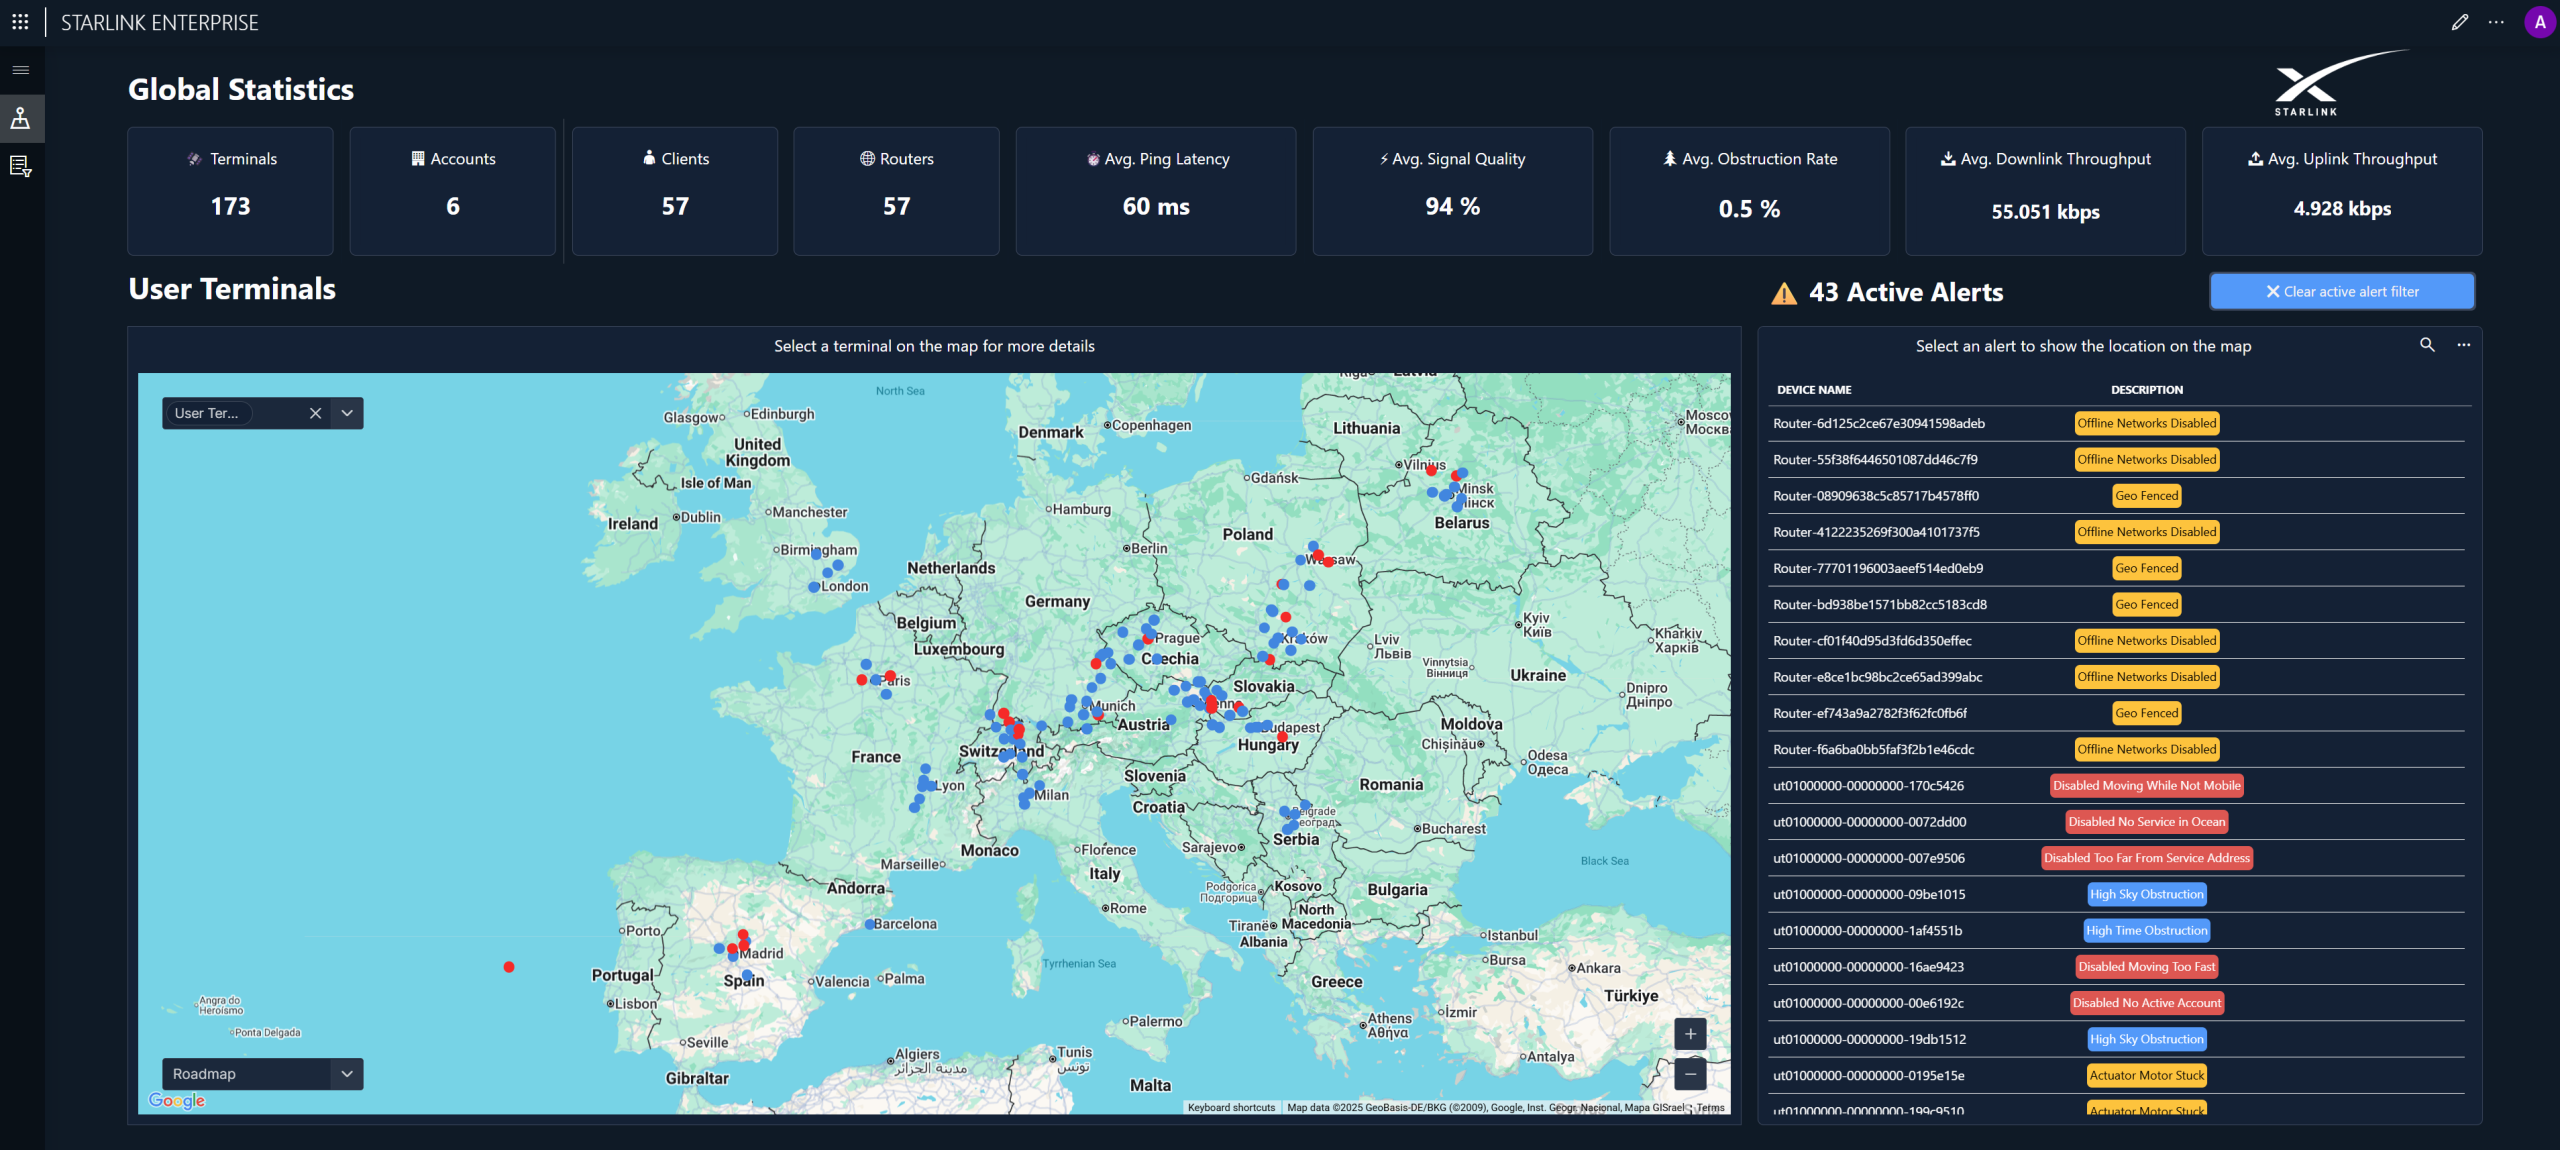 This low-code app leverages the Starlink Enterprise connector as its foundation. Alongside the most important aggregated KPIs, it offers a visual representation of user terminals on a map, indicated by blue dots, with any open alerts highlighted in red.
Can you believe the first version of this app was created in under 2 hours? With minimal effort, this app can be securely shared beyond your organization's confines.
 By selecting any of the terminals on the map, you can access further details about that specific terminal. When closing the side panel, the Alerts list will now be filtered based on the selected terminal.
 Explore and monitor your fleet with ease by accessing detailed information about user terminals, complete with standard filter capabilities.
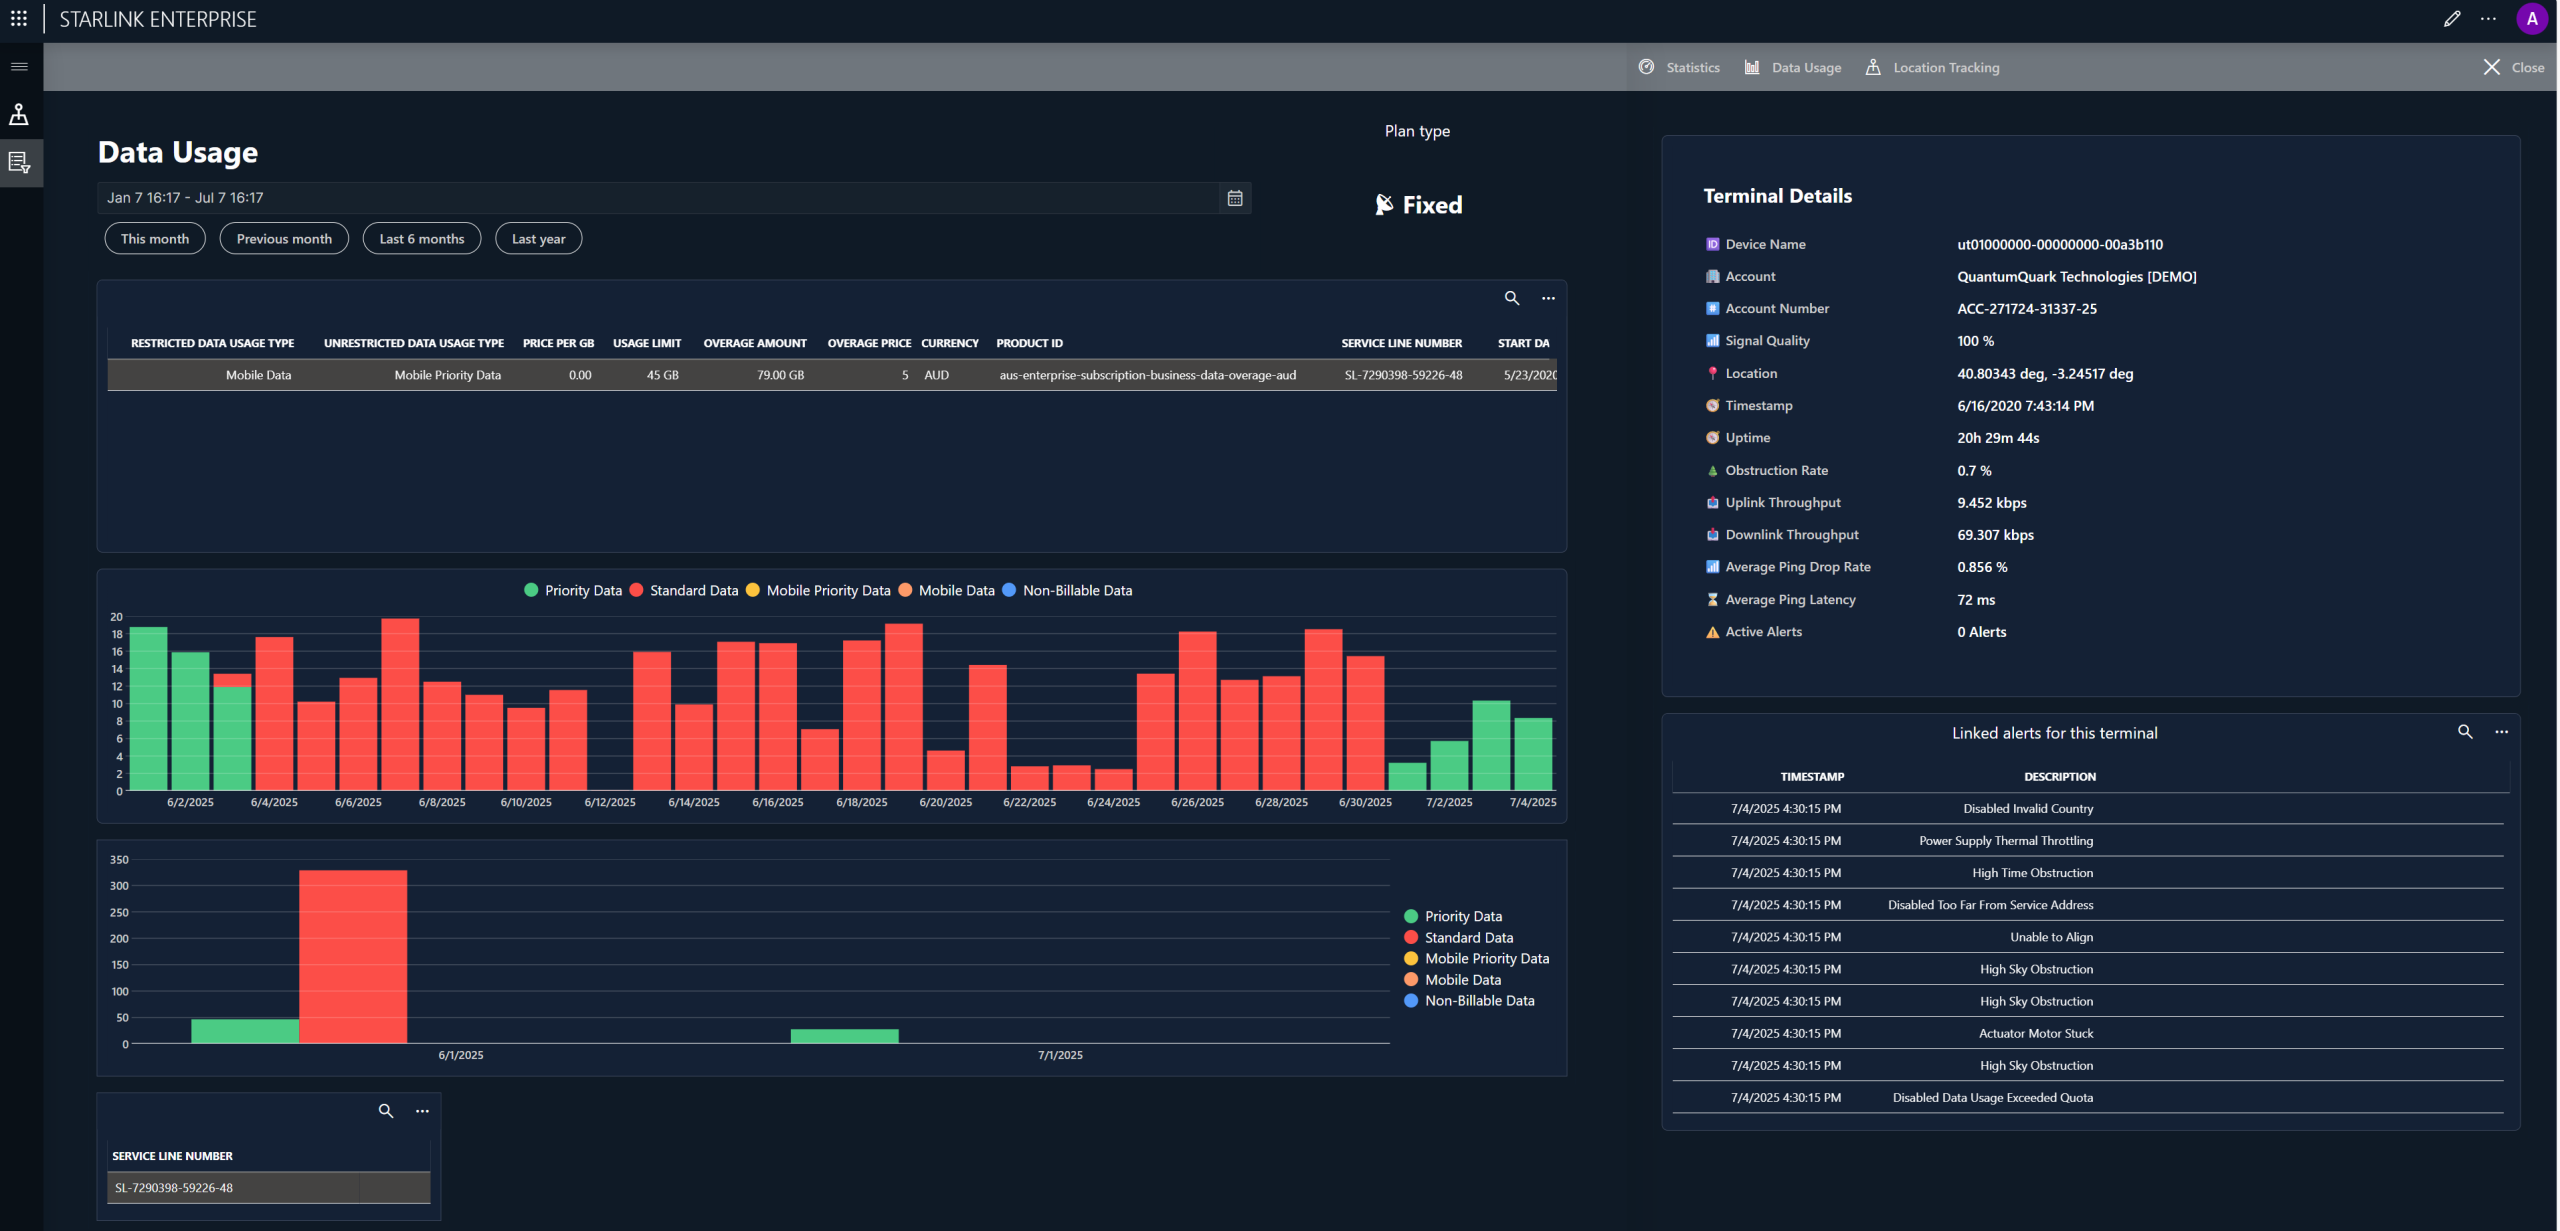 You can now gain real-time visibility into the bandwidth consumption of your Starlink fleet. Track monthly and daily usage, identify high-traffic terminals, and make informed decisions to optimize your network. Keep your fleet connected, efficient, and ready for whatever comes next.
 For the integration of the maps component and data layers, we are using the native Google Maps integration for DataMiner low-code apps. You can even configure the map styles to suit your preferences! 💡
By leveraging trended location data (longitude and latitude), DataMiner offers an interactive map-based interface where users can replay movement paths, assess travel routes, and explore potential causes for performance drops tied to geographic transitions.
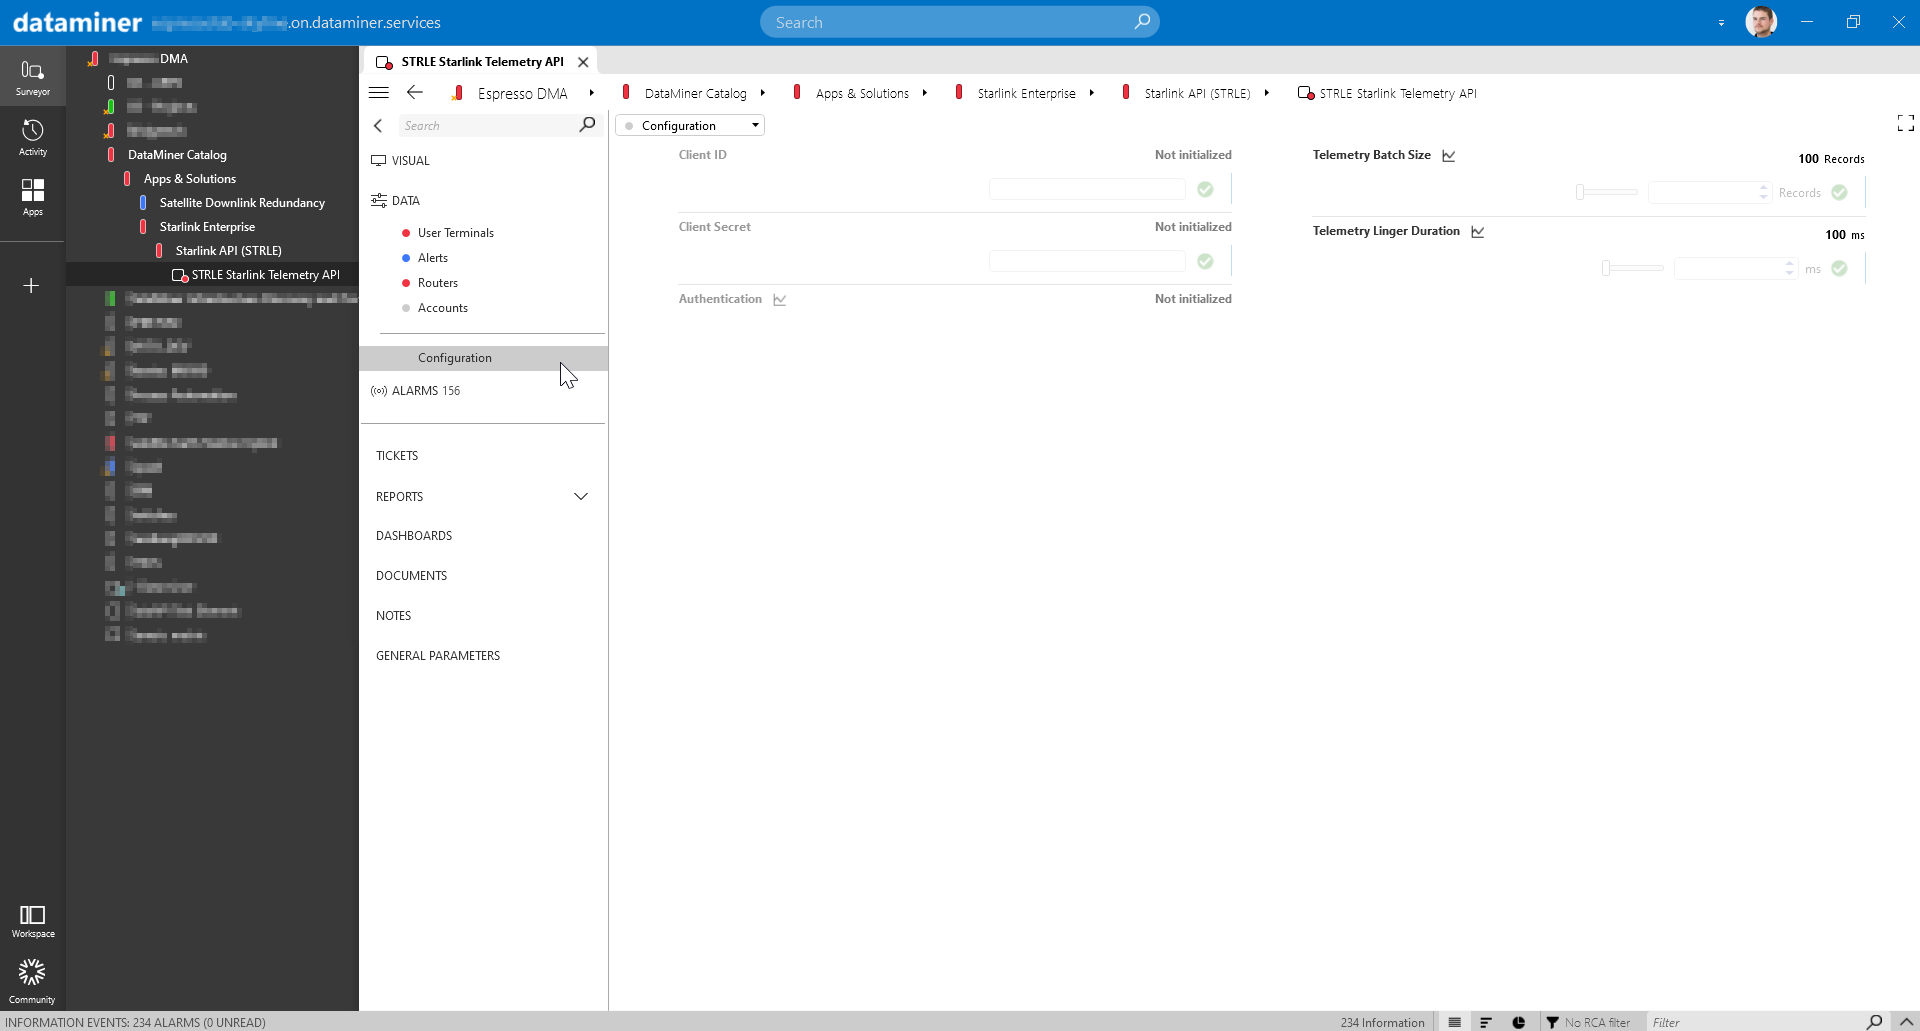 When navigating to the Configuration page in Cube, you will find the Client ID, Client Secret, and Authentication field. When both Client ID and Client Secret are accepted by the API, the Authentication field will display "Successful", and data will begin populating in the element. The connector automatically updates its access token every 15 minutes, just before it expires.
The Configuration page also contains two telemetry request configuration parameters: Batch Size, which represents the maximum number of telemetry entries to return in the response, and Linger Duration, which represents the maximum duration, in milliseconds, to collect telemetry entries for.
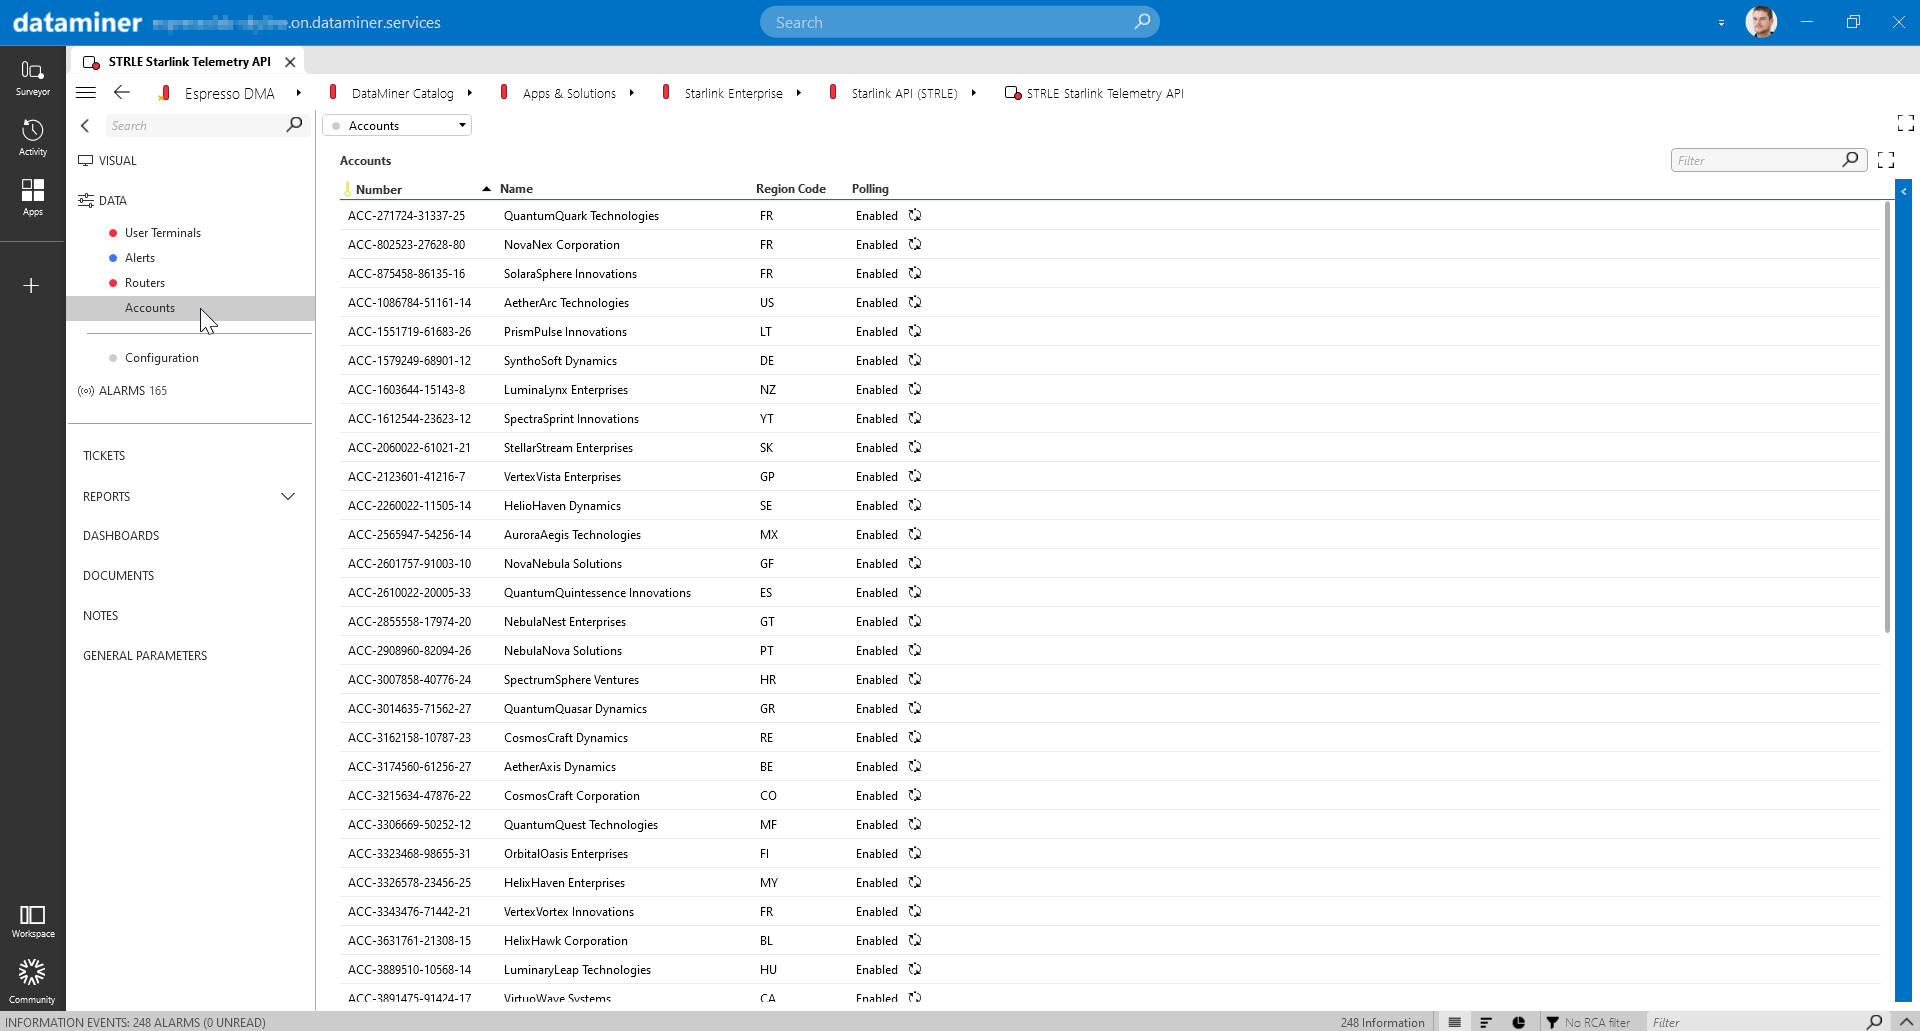 The Accounts table displays all linked accounts managed through your enterprise account. Each row in this table contains a polling button. By enabling polling for the desired accounts, you initiate the retrieval of live data, such as User Terminals, Alerts, and Routers.
 Detailed information is available for every router listed in the Routers table. This includes Internet Ping Latency, WAN Tx/Rx bytes, and the number of connected clients, offering detailed insights into router performance.