example Use Case
Penalty Box Monitoring
Management By Exception has become a necessity to manage a complex media environment with many services and signals. Penalty boxes are an essential tool for NOC operators, DevOps engineers, and customer service desk staff to direct their attention where it is really needed. Check out this use case to learn how DataMiner’s penalty box works.
Instead of showing all your services in DataMiner (e.g. in a dashboard) and all your video and audio signals on an external multiviewer wall, where a service in alarm can easily be overlooked, a penalty box is empty as long as your signals and services are OK.
Only in case of an alarm will DataMiner place a service in the DataMiner penalty box. Optionally, DataMiner can also route the affected video/audio signal to a third-party multiviewer that has been reserved for penalty box operations. This can include additional logic, e.g. changing the multiviewer layout to full screen with the affected signal or pushing alarm details to the multiviewer (e.g. via TSL protocol).
While many multiviewers have a built-in penalty box feature already, this can only detect issues with the incoming video and audio signals, for example a video freeze, loss of audio, or a missing subtitle. DataMiner goes one step further and monitors the complete service infrastructure that belongs to your signal chain. This can for example be playout servers, audio and video processing equipment, encoders, decoders, IP gateways, and so on, and even the multiviewers themselves. The latter act as video and audio probes, which means that DataMiner will learn from the multiviewers when there is an issue with any of the signals.
Today, media functions like encoders are often software-based. To get the full picture, DataMiner also monitors the underlying infrastructure, such as blade servers, virtual machines, and operating systems. This can result in thousands of parameters and monitoring points, each of them contributing to the overall health state of your service.
USE CASE DETAILS
 Have a look at this video to see the penalty box in action.
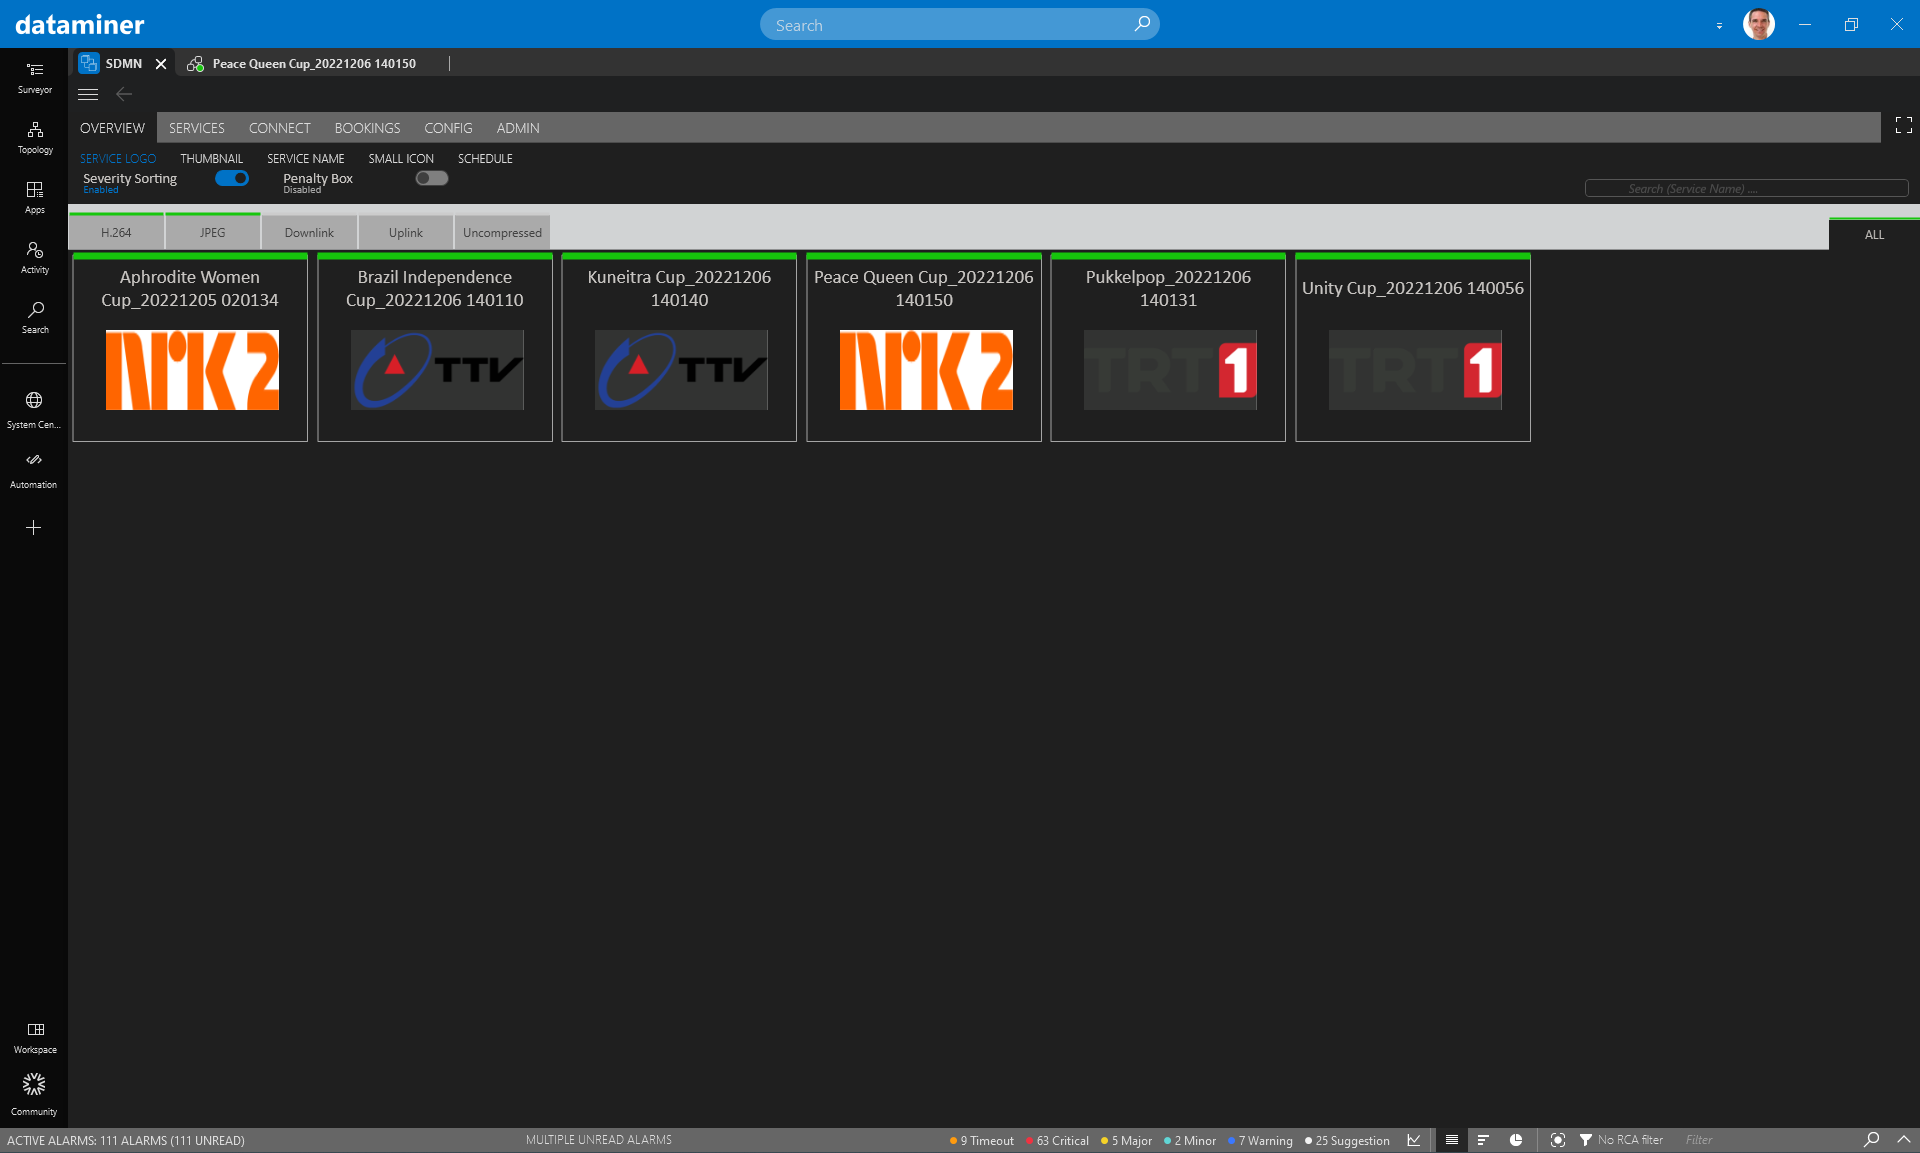 This visual overview shows a regular DataMiner dashboard with all active services, e.g. contribution signals in an MCR, and their overall health state. In this case, all services are healthy.
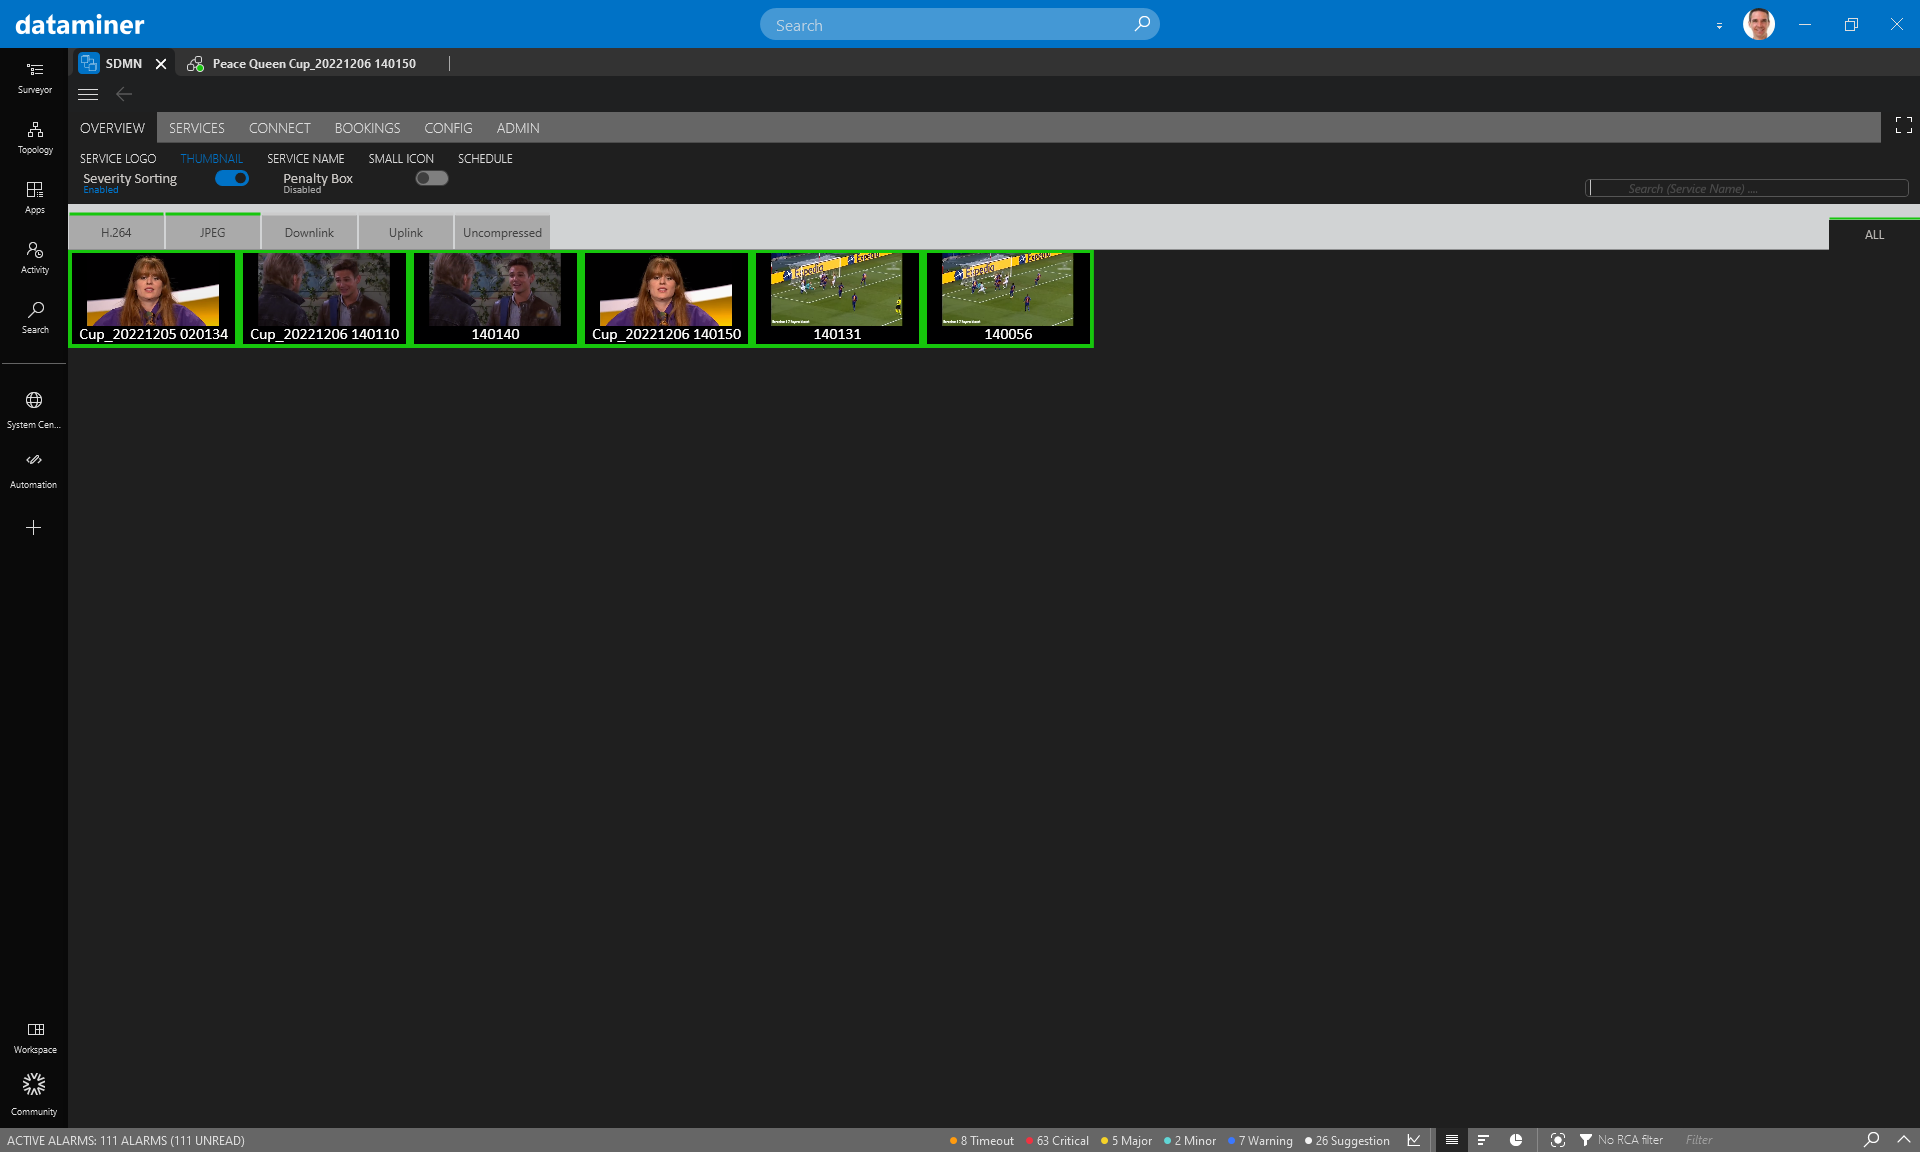 And here is a similar view but including a software multiviewer decoding a low-res copy of the monitored service.
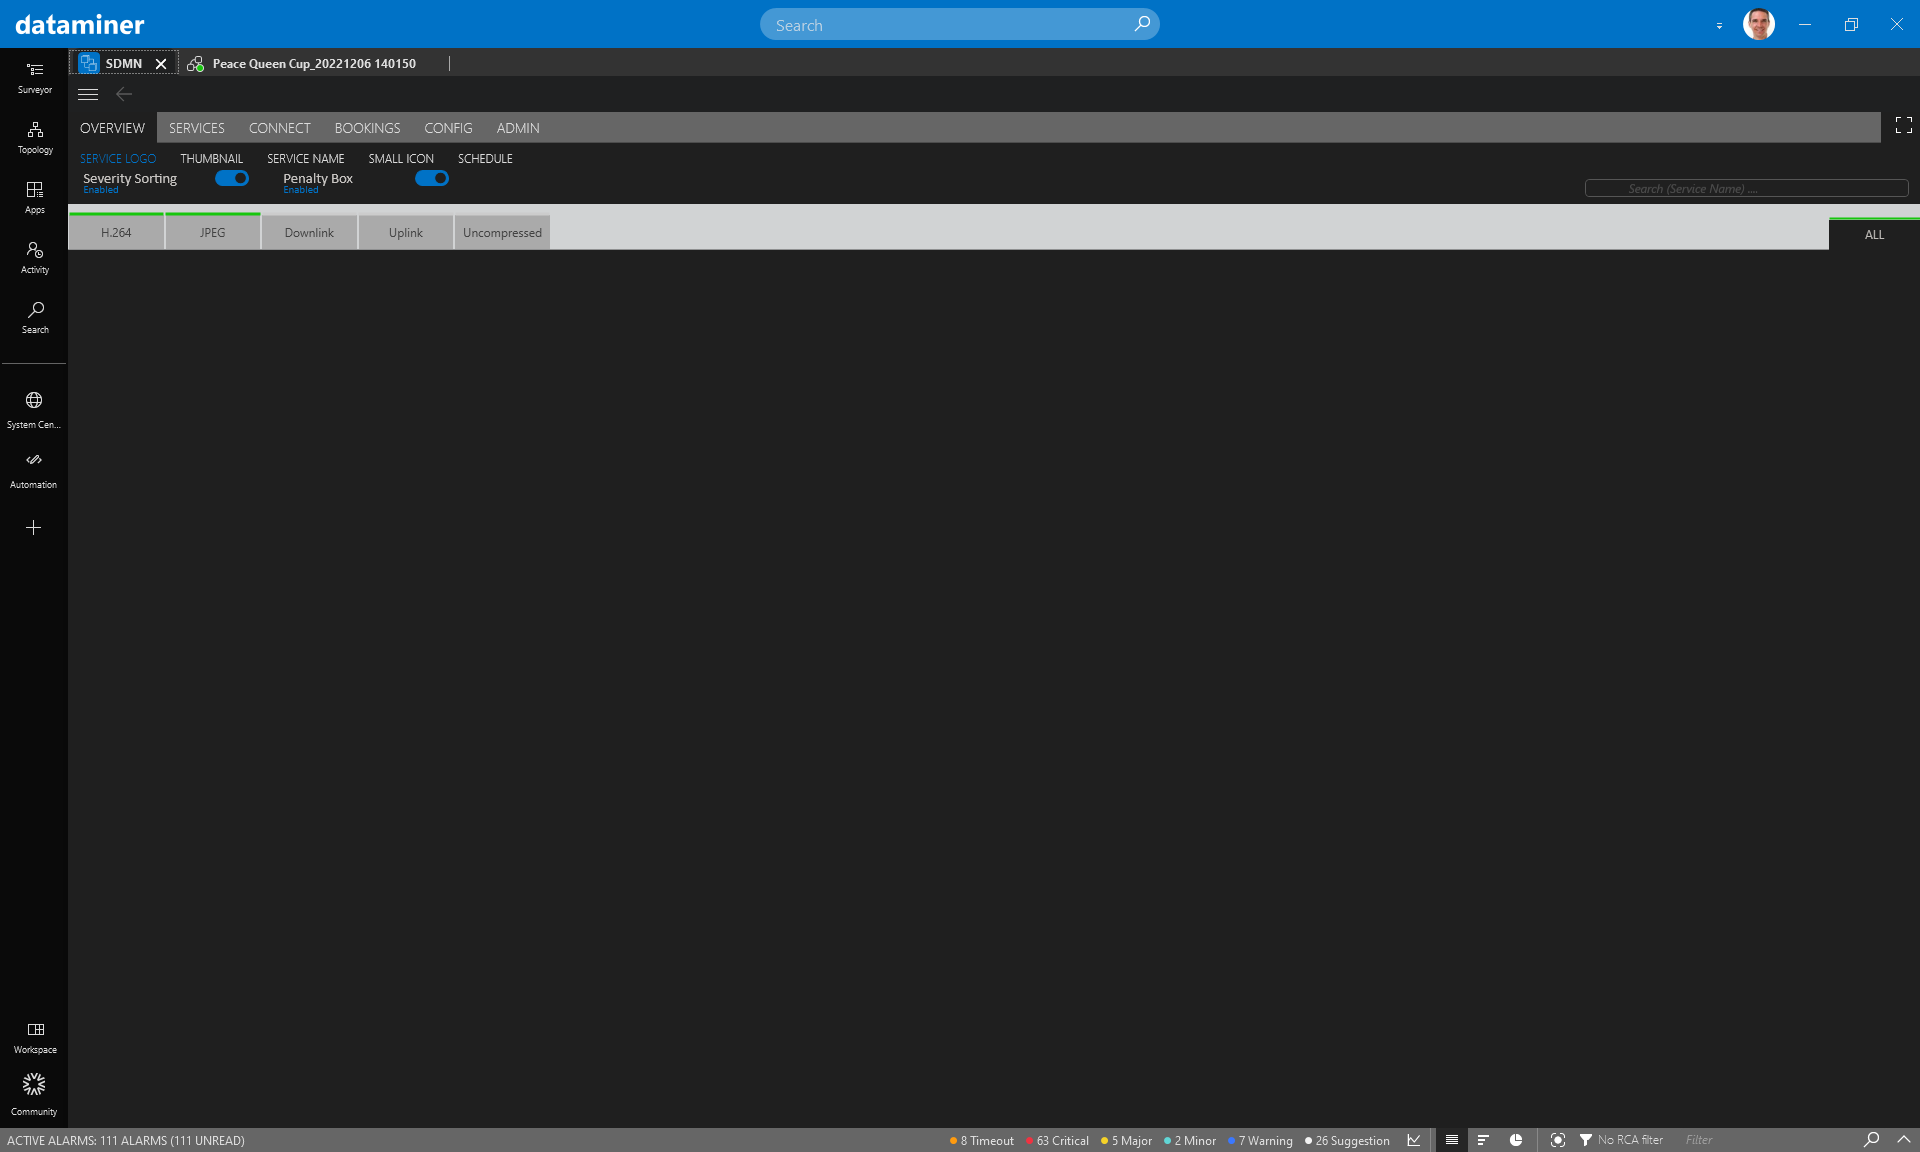 With the "penalty box" toggle button turned on, all services disappear, as there is currently no service in alarm. The same goes for a connected hardware multiviewer: all PIPs will show a black screen.
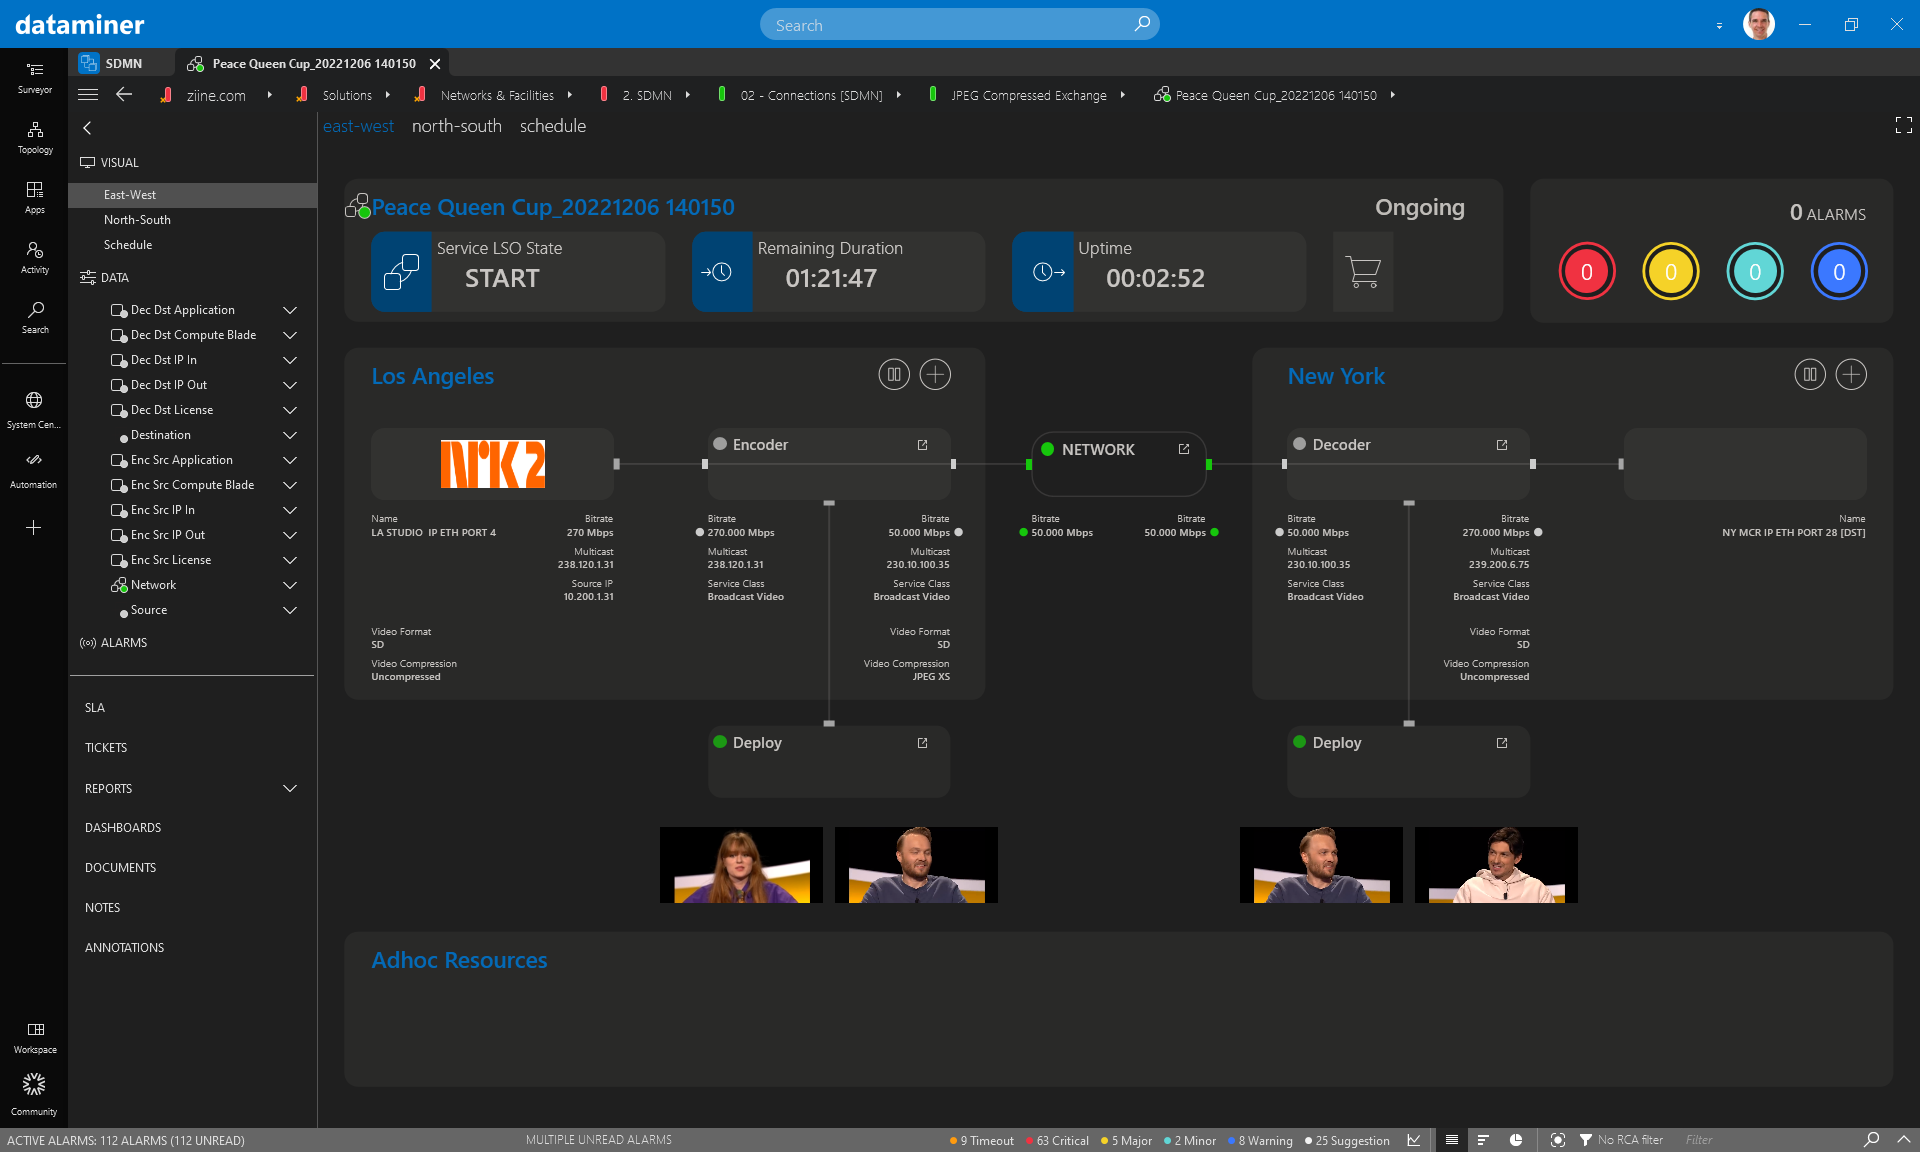 From the DataMiner dashboard, you can easily drill down to see details of each service and all infrastructure contributing to the service (e.g. encoder, network, decoder).
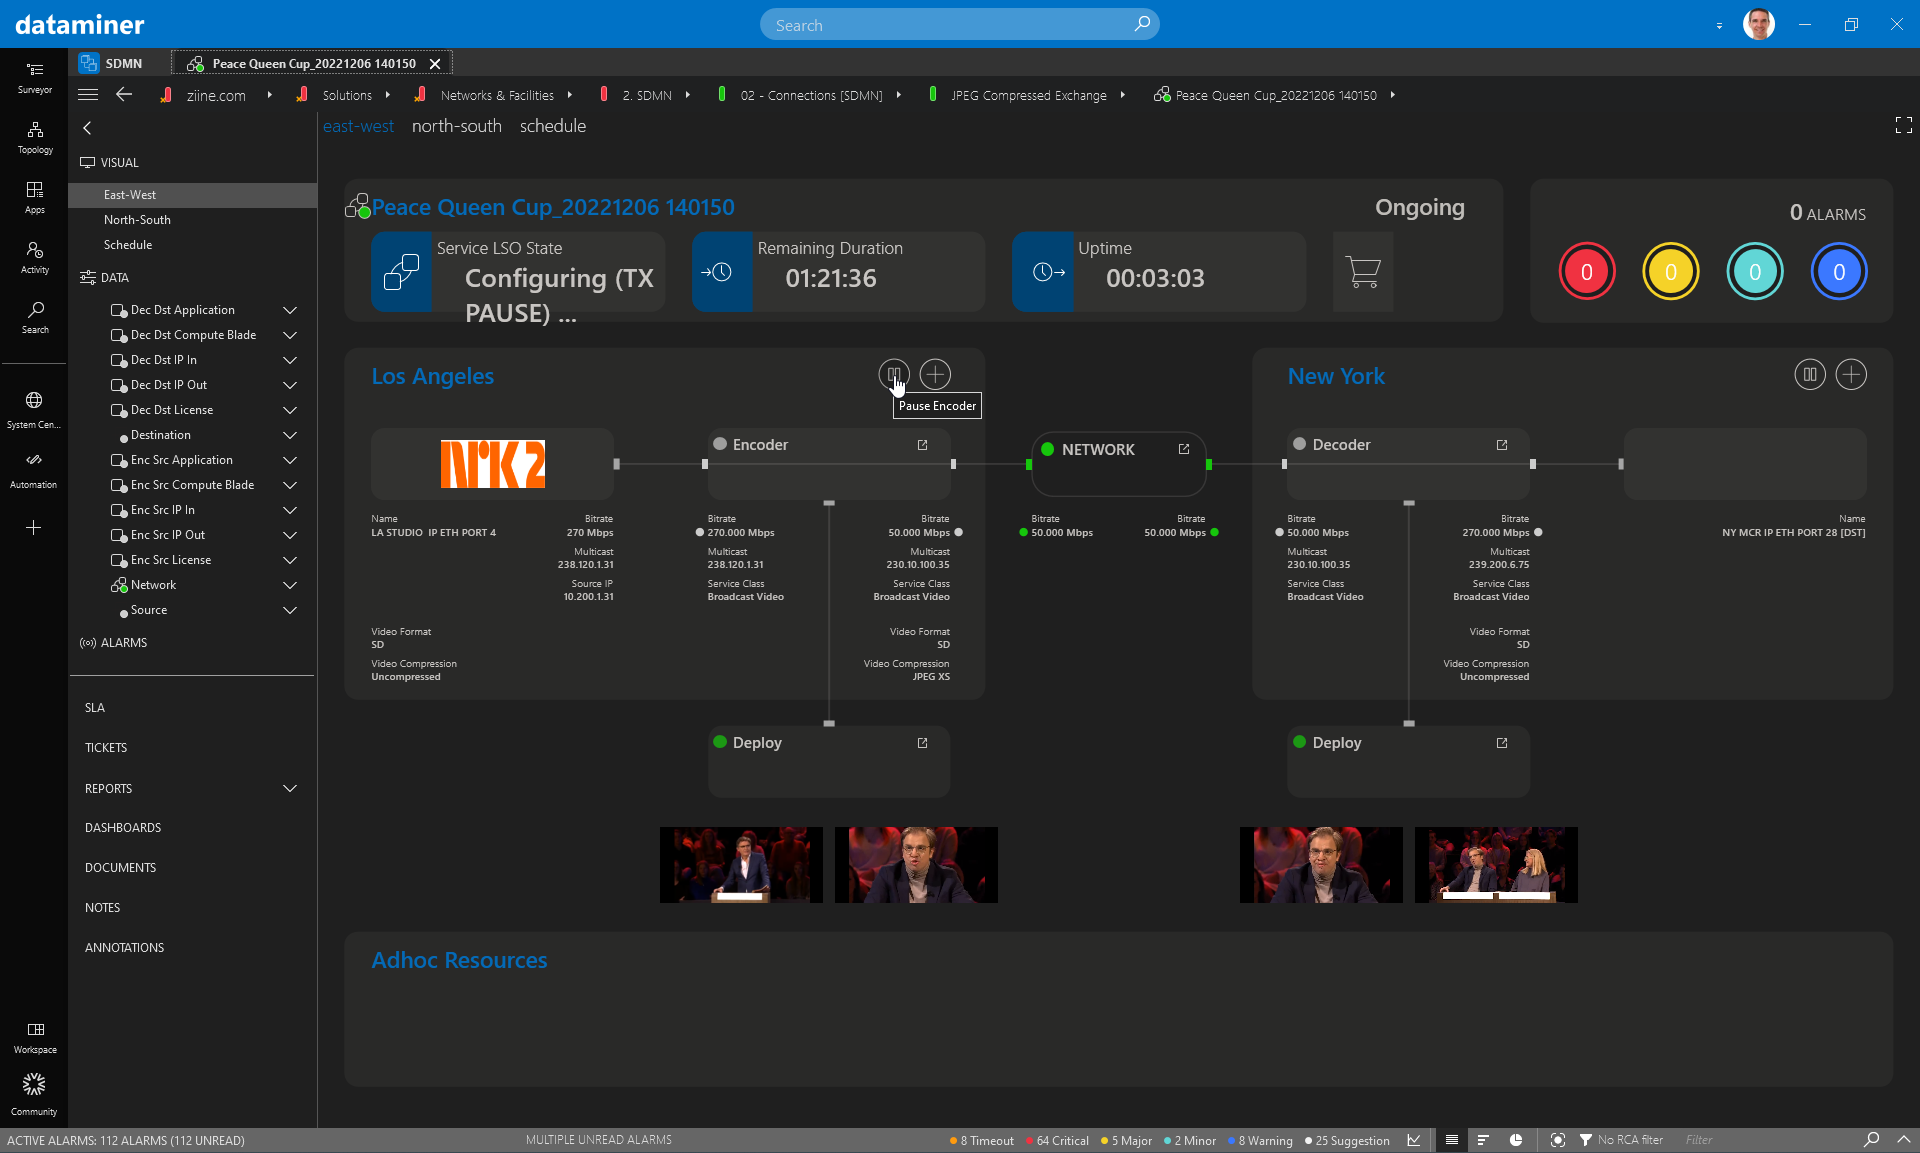 With the built-in controls, you can easily change settings, for example to turn off the encoder output.
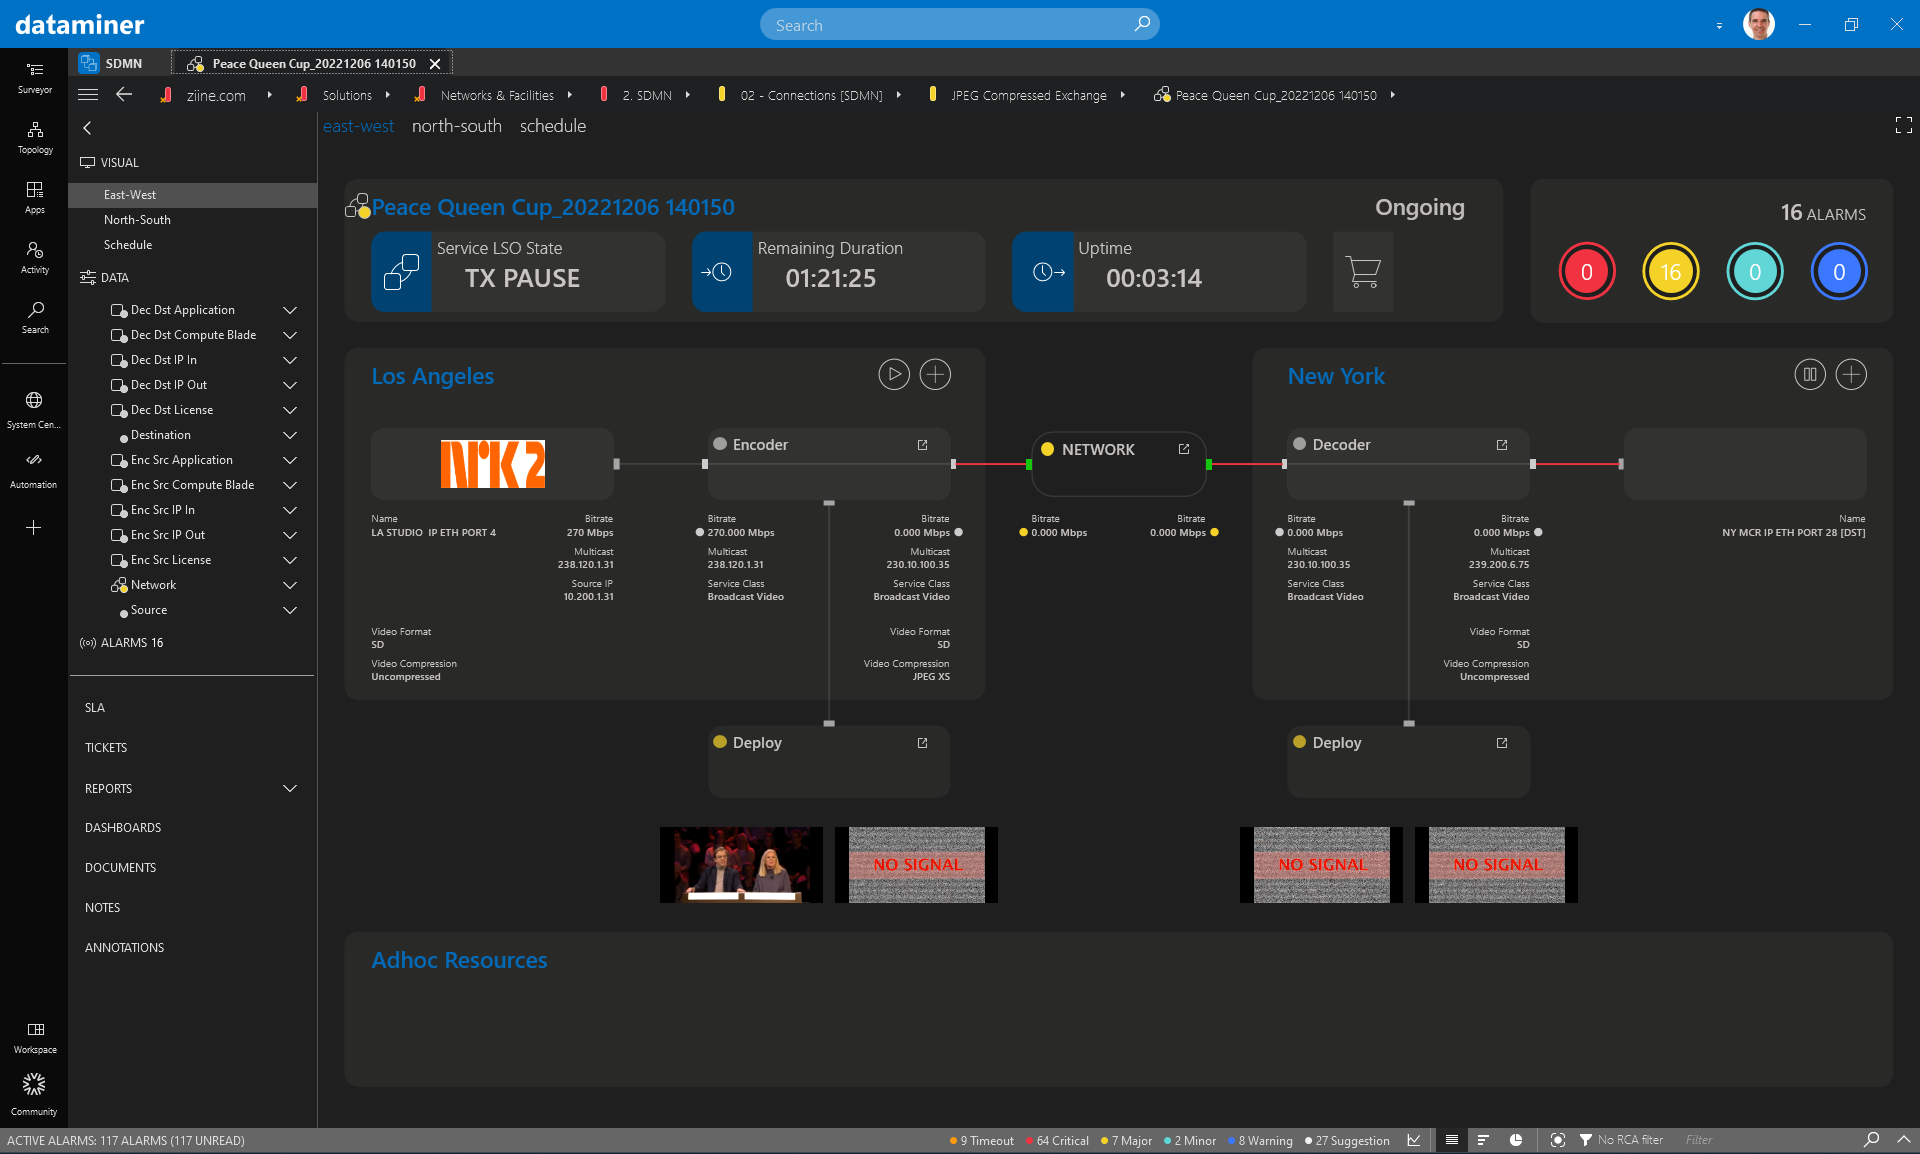 When the encoder stops transmitting, multiple alarms pop up throughout the signal chain (16 in total). The service is now in a major alarm state.
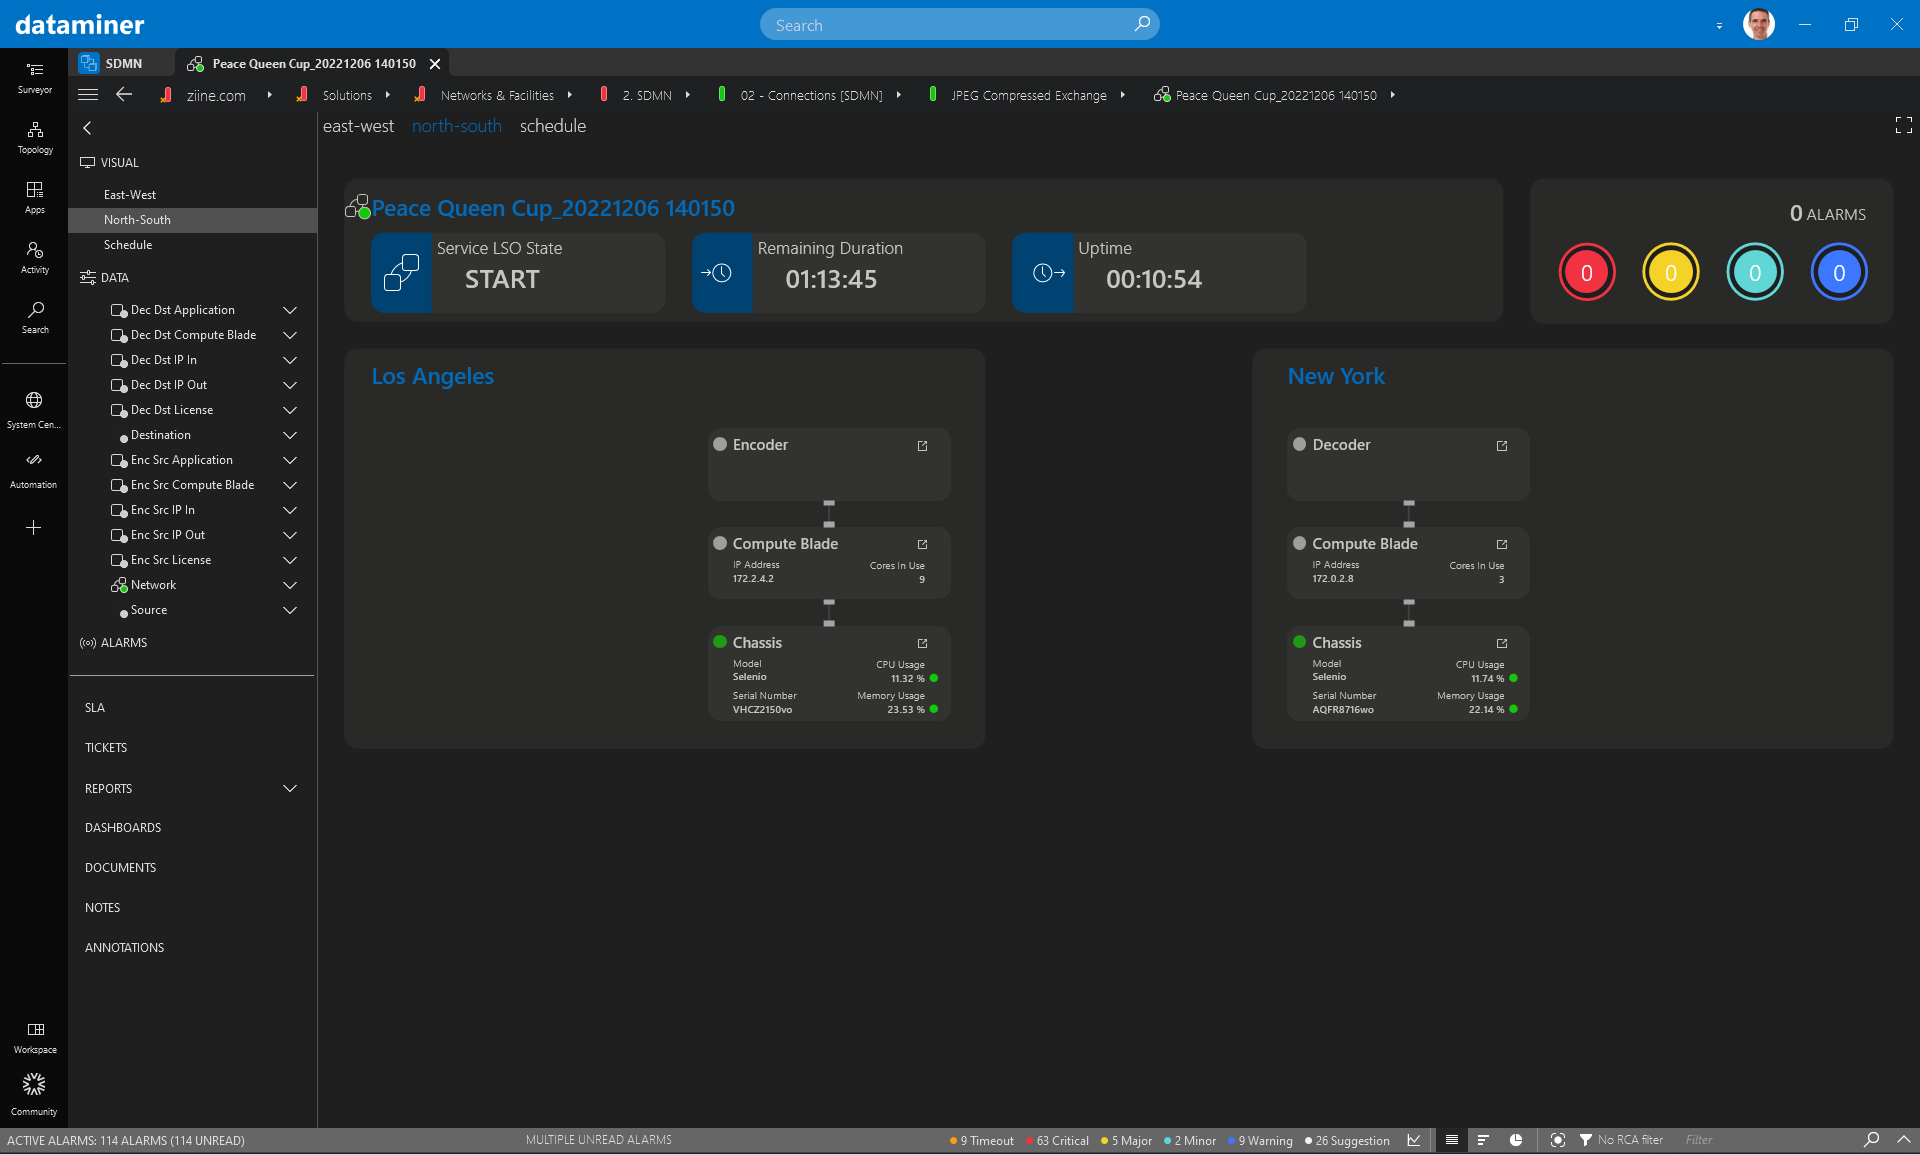 By the way, as the encoder is software-based, DataMiner also monitors the underlying infrastructure, in this case a blade server chassis and the compute blade the encoder is running on.
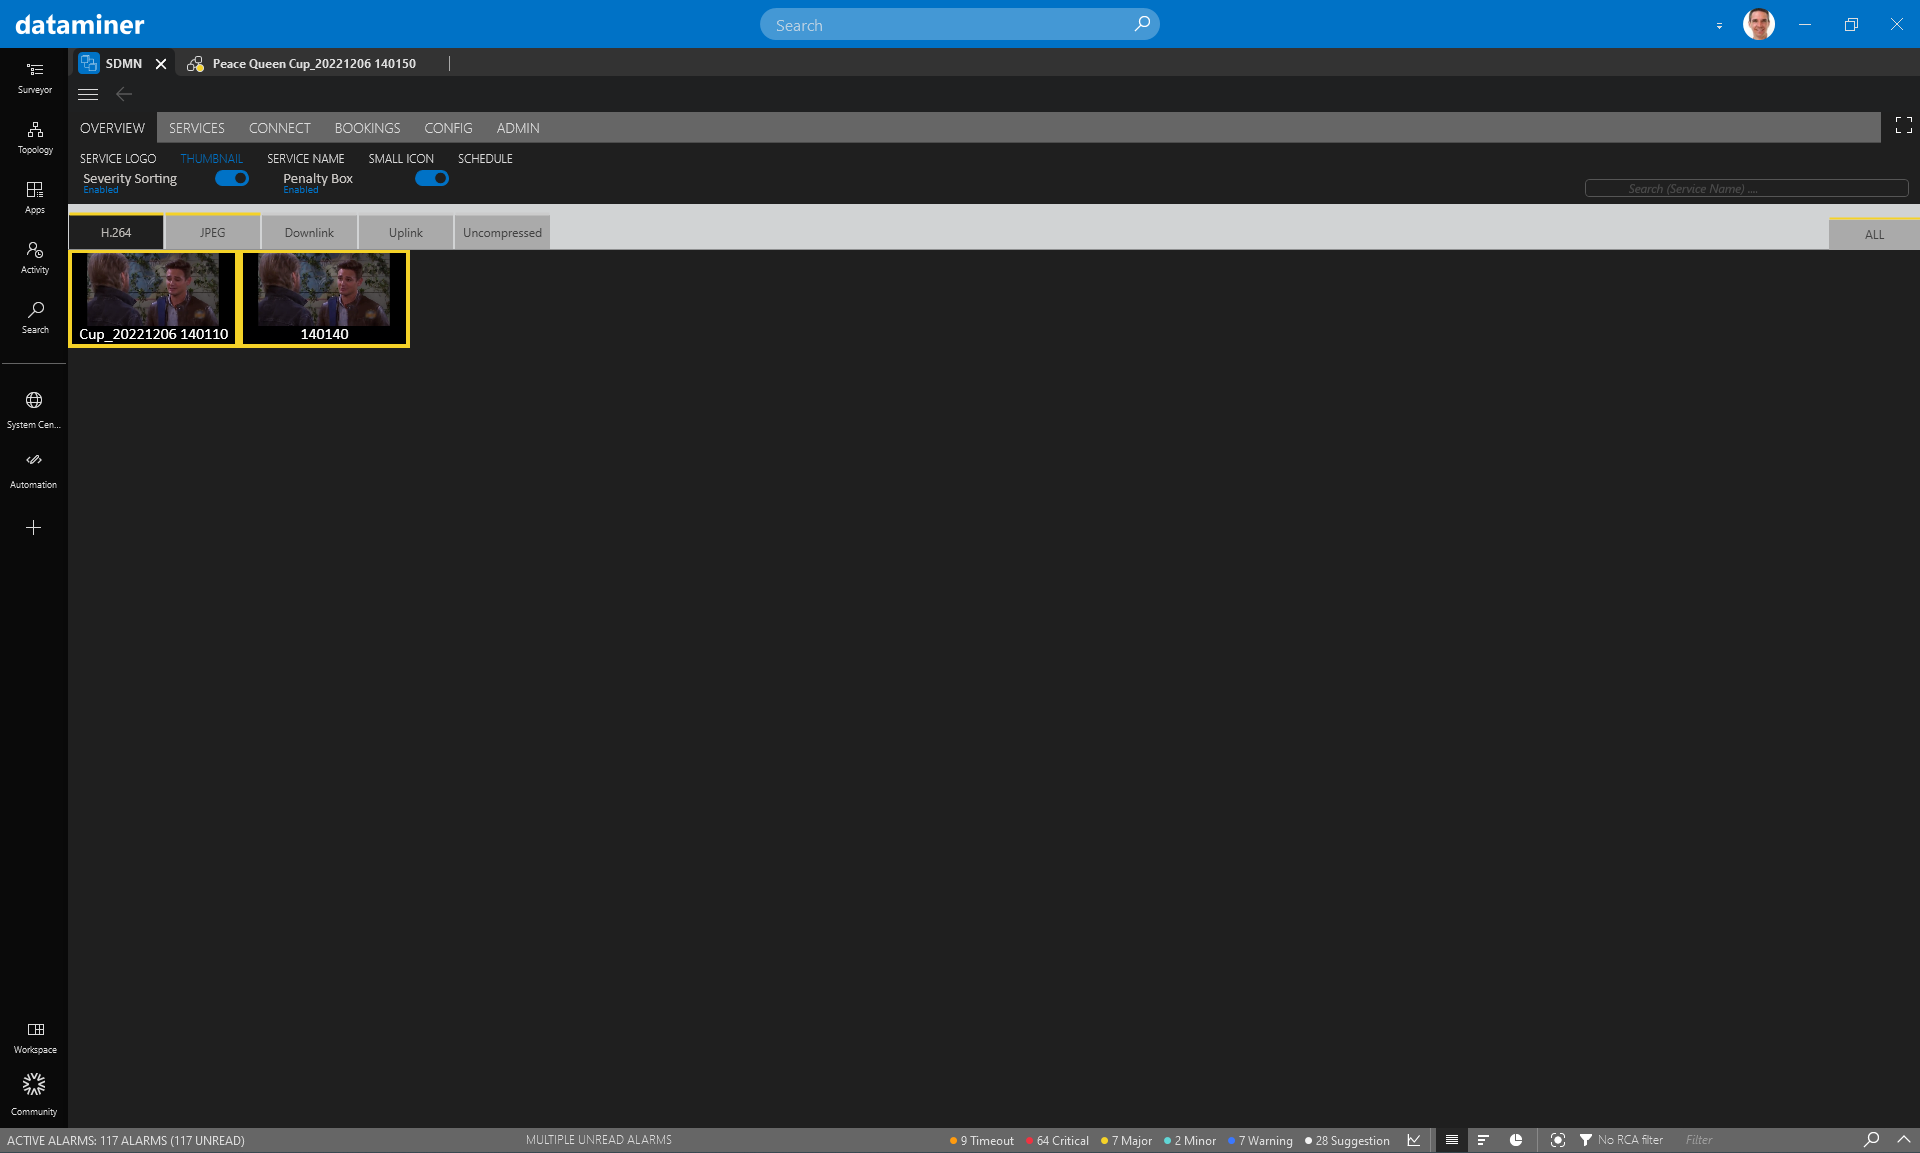 And with that, the DataMiner Penalty Box is no longer empty and shows the affected service. Note that turning off the encoder also put another service in alarm, as the encoder is feeding a second service in parallel. DataMiner also routes the affected signal to your third-party penalty box multiviewer (e.g. TAG MCM9000, Rohde&Schwarz Prismon, Imagine EPIC, etc.), and it can load a different layout or even send details about the alarm to the multiviewer.
1 thought on “Penalty Box Monitoring”
Leave a Reply
You must be logged in to post a comment.
This is a great use case. Thanks Thomas.