integration Use Case
Nevion (Sony) VideoIPath
Nevion VideoIPath is Nevion’s orchestration and SDN control system. It provides connection management, service assurance, and network inventory capabilities for service provides and broadcasters.
The Nevion VideoIPath connector in DataMiner uses HTTP communication to retrieve all data from the Nevion VideoIPath system, mostly using Nevion’s modern services API calls. The connector allows for deep monitoring, including real-time alarm monitoring of the VideoIPath application and all configured services (i.e. crosspoints), including the detailed path across your network. It also allows you to set up point-to-point or point-to-multipoint services. The connector displayed in this use case is developed with firmware version 5.12.4.
To start the communication, you first need to authenticate yourself on the “General” page by entering your username and password and clicking on “Login”.
USE CASE DETAILS
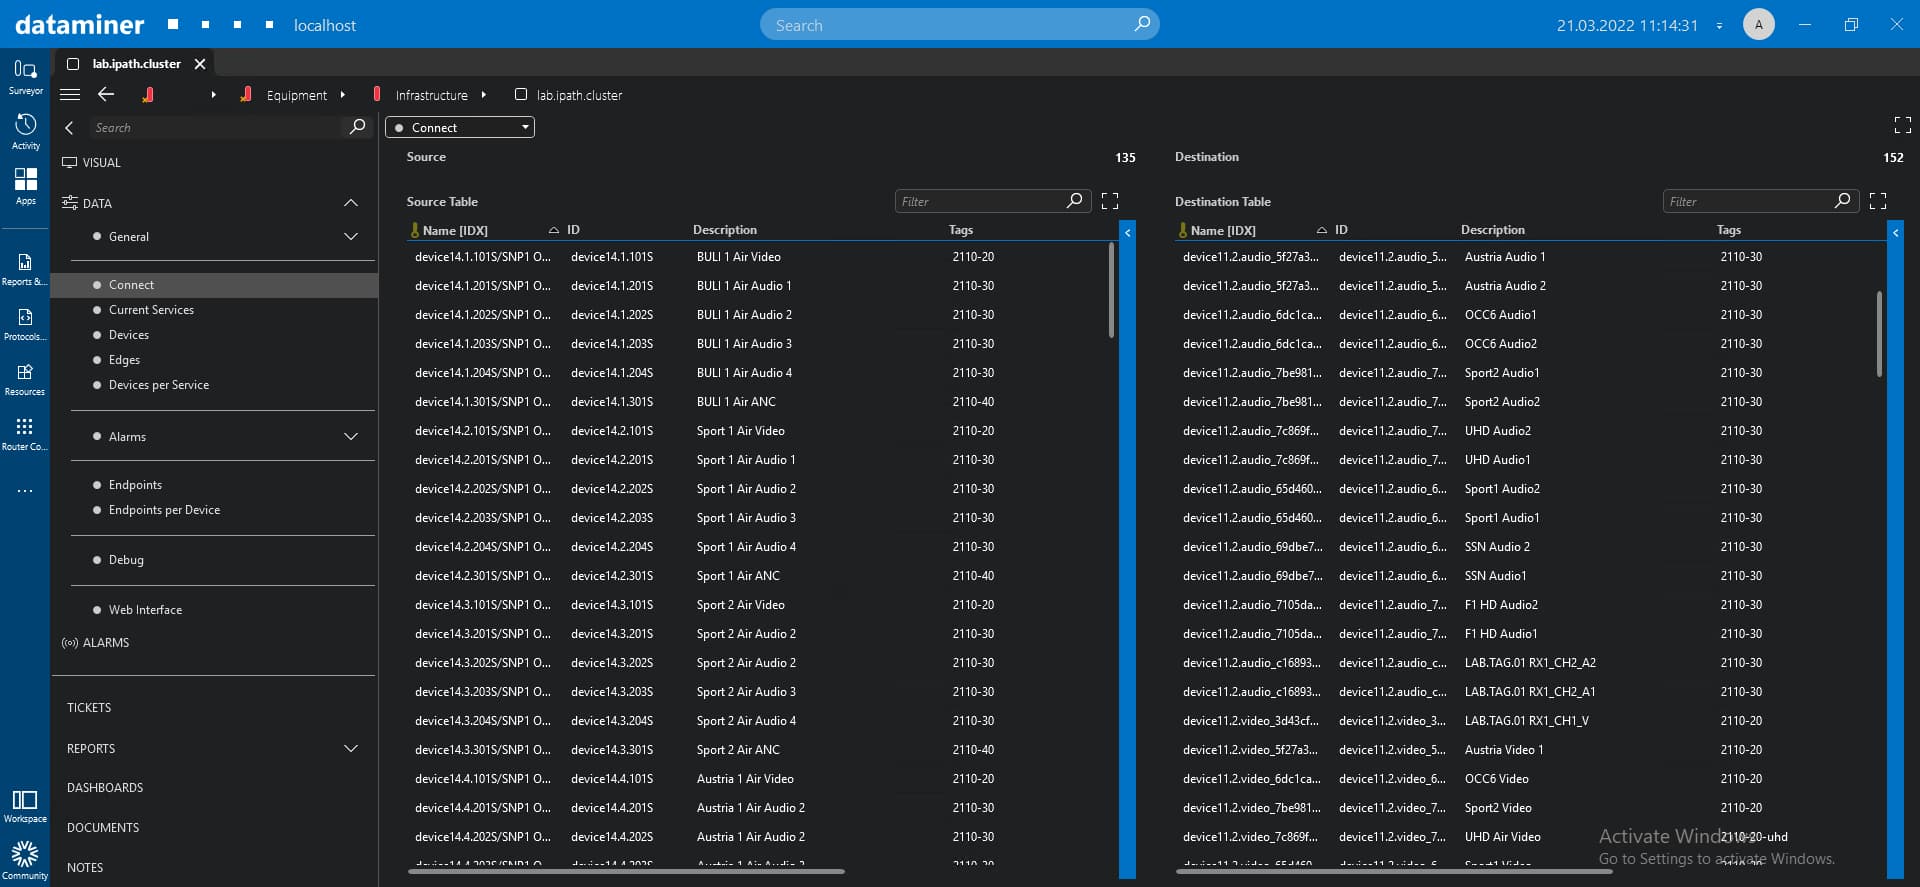 The "Connect" page displays all sources and destinations that are available on the device.
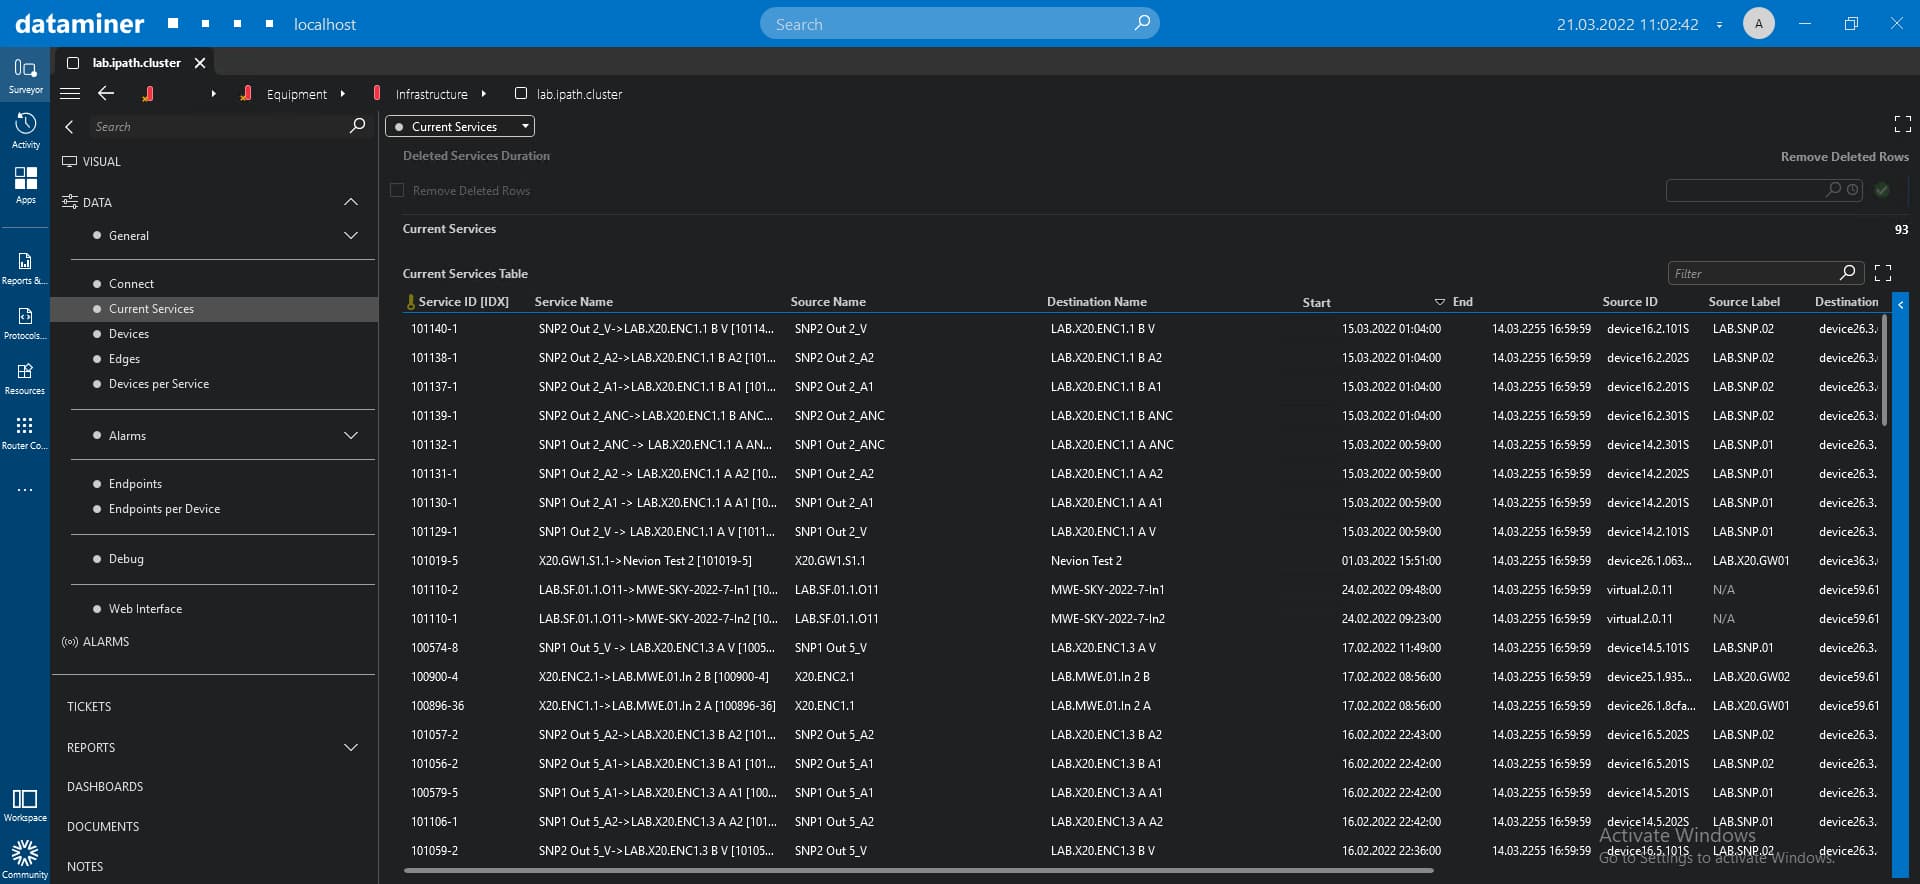 The "Current Services" table lists the information related to the services that are available on the sources and destinations (displayed on the "Connect" page). You can use the "Auto clear" function to remove a service.
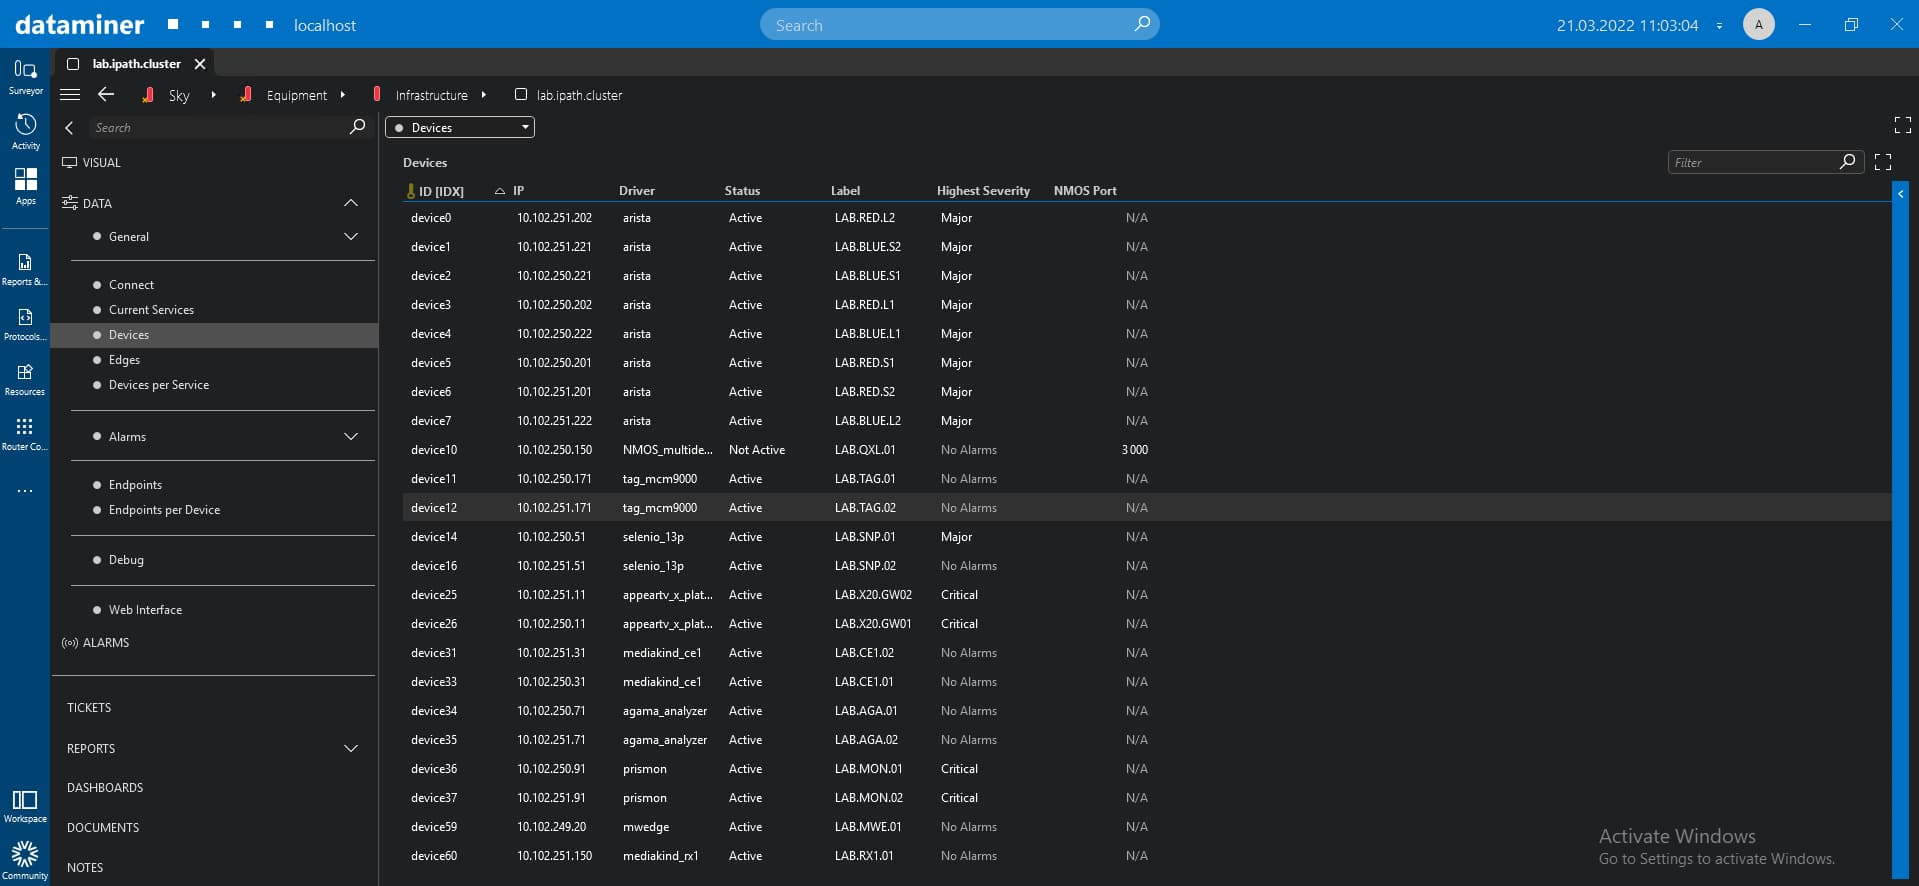 On the "Device" page, the connector lists all devices available on the Nevion VideoIPath network.
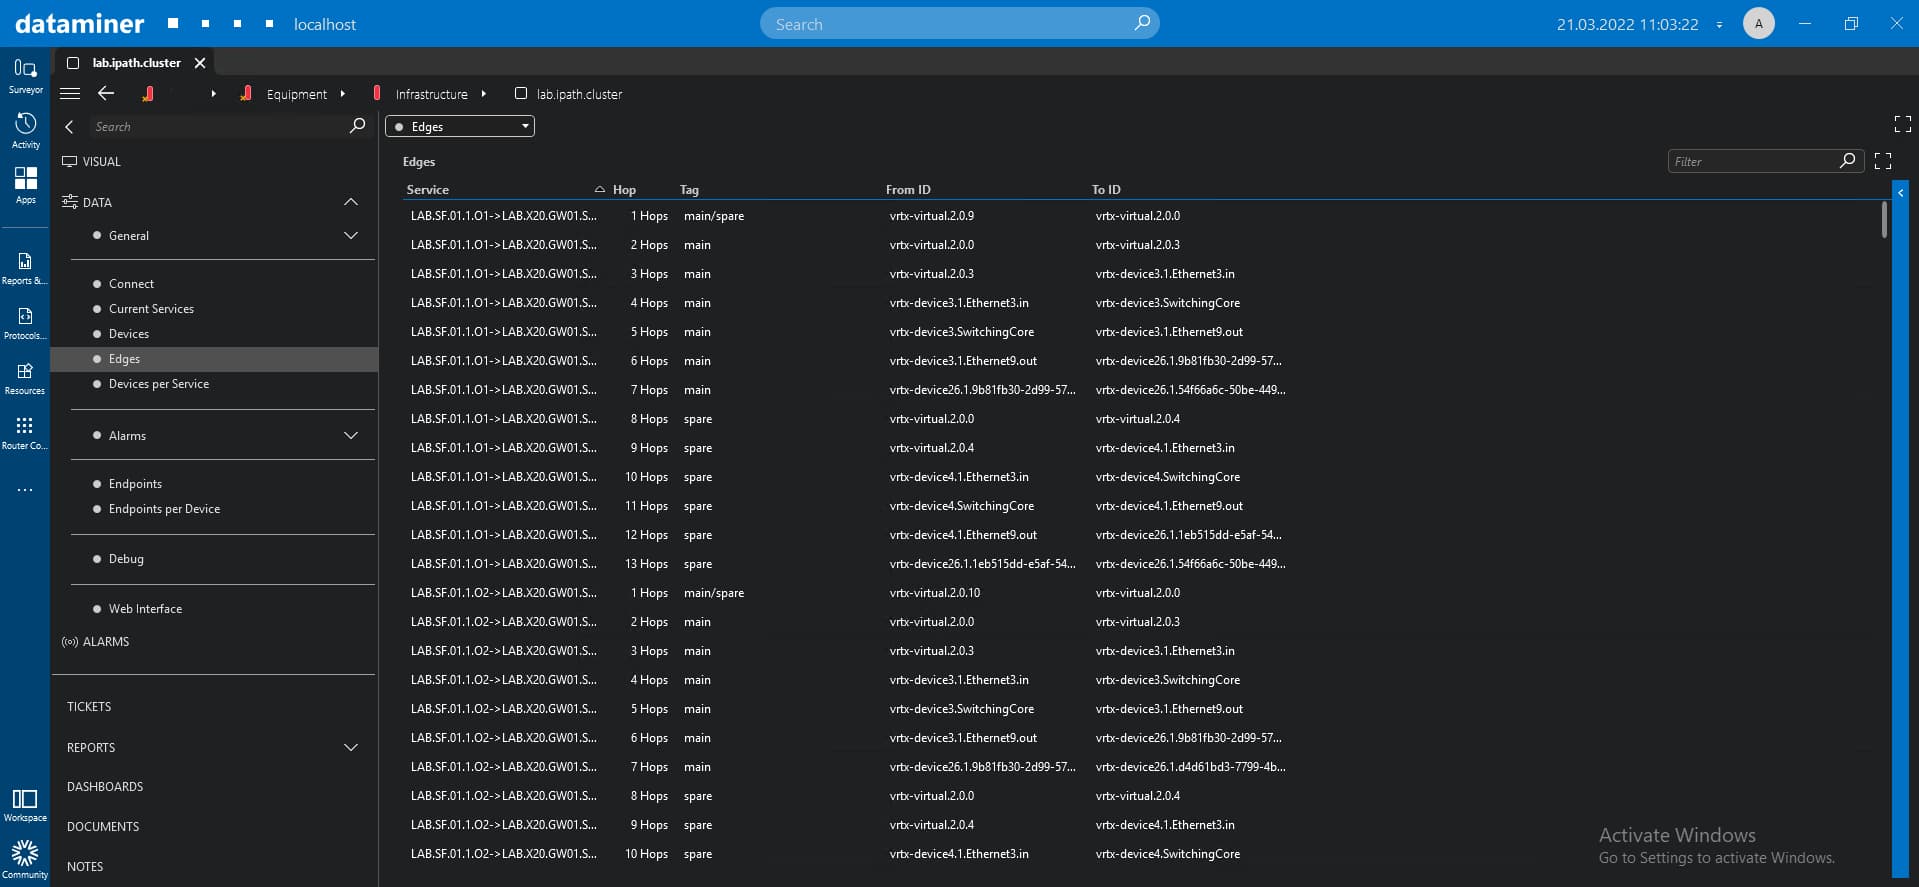 The "Edges" page contains a table that shows the device route used by each service. In the "Edges" table, you can find useful information like "Hop", "Tag", "From ID", and "To ID".
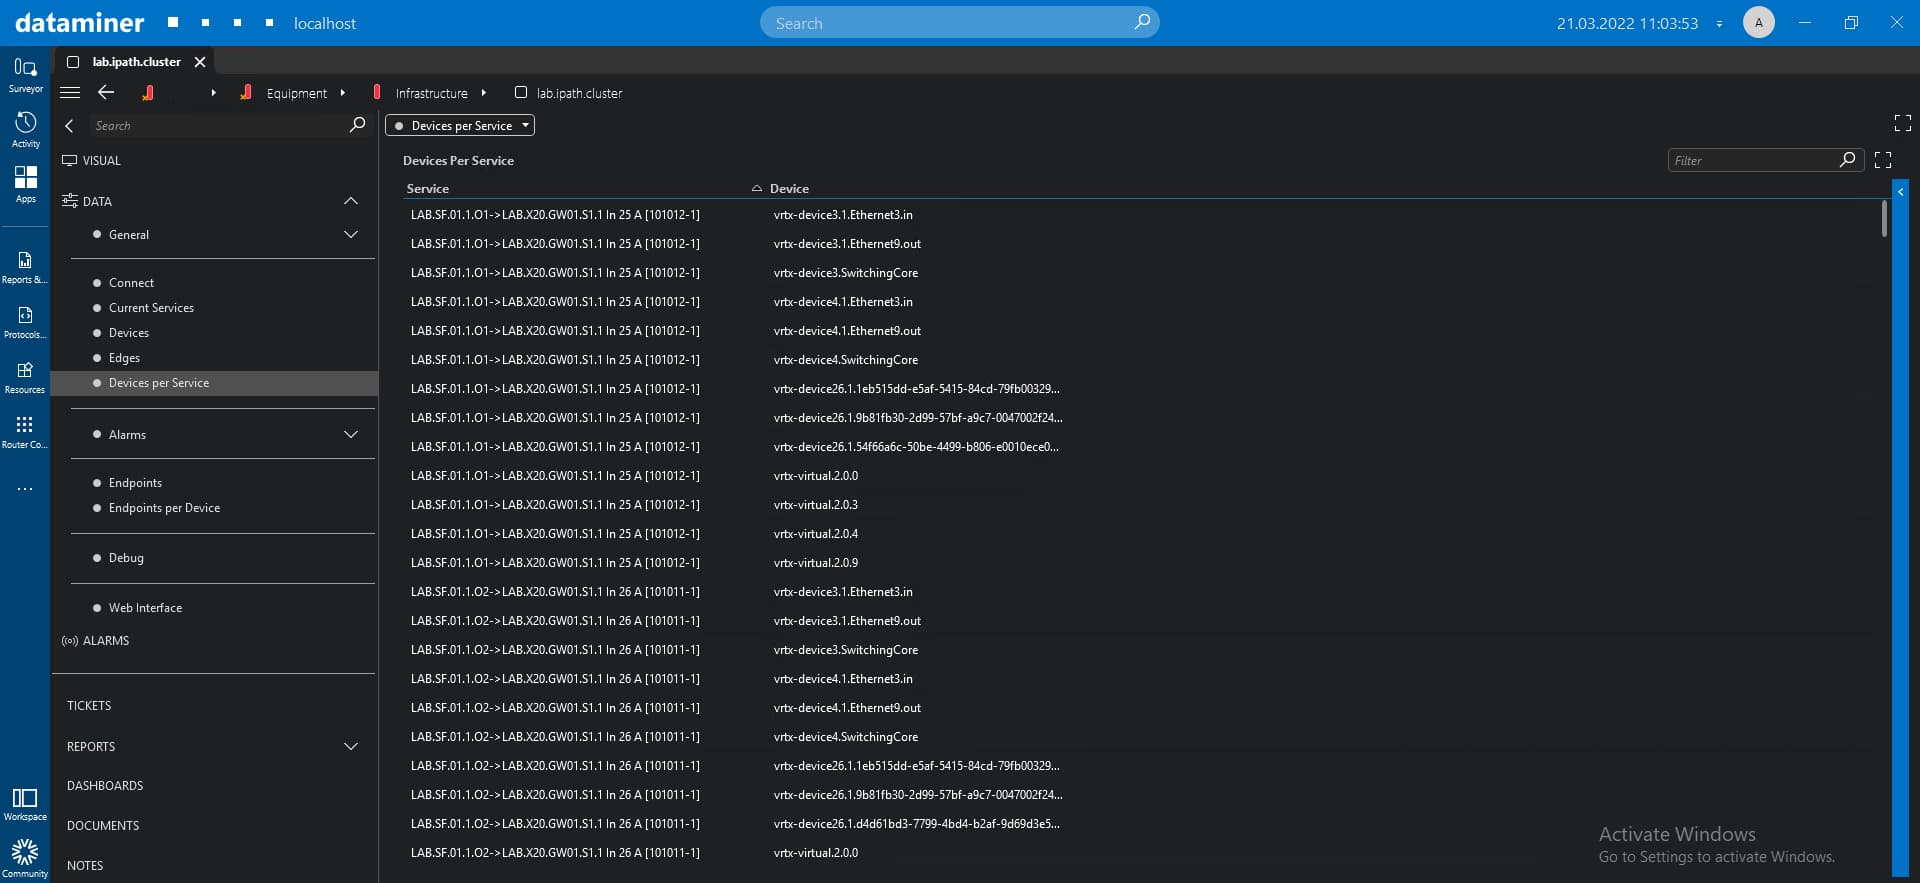 The "Devices per Service" page lists all devices used by each server.
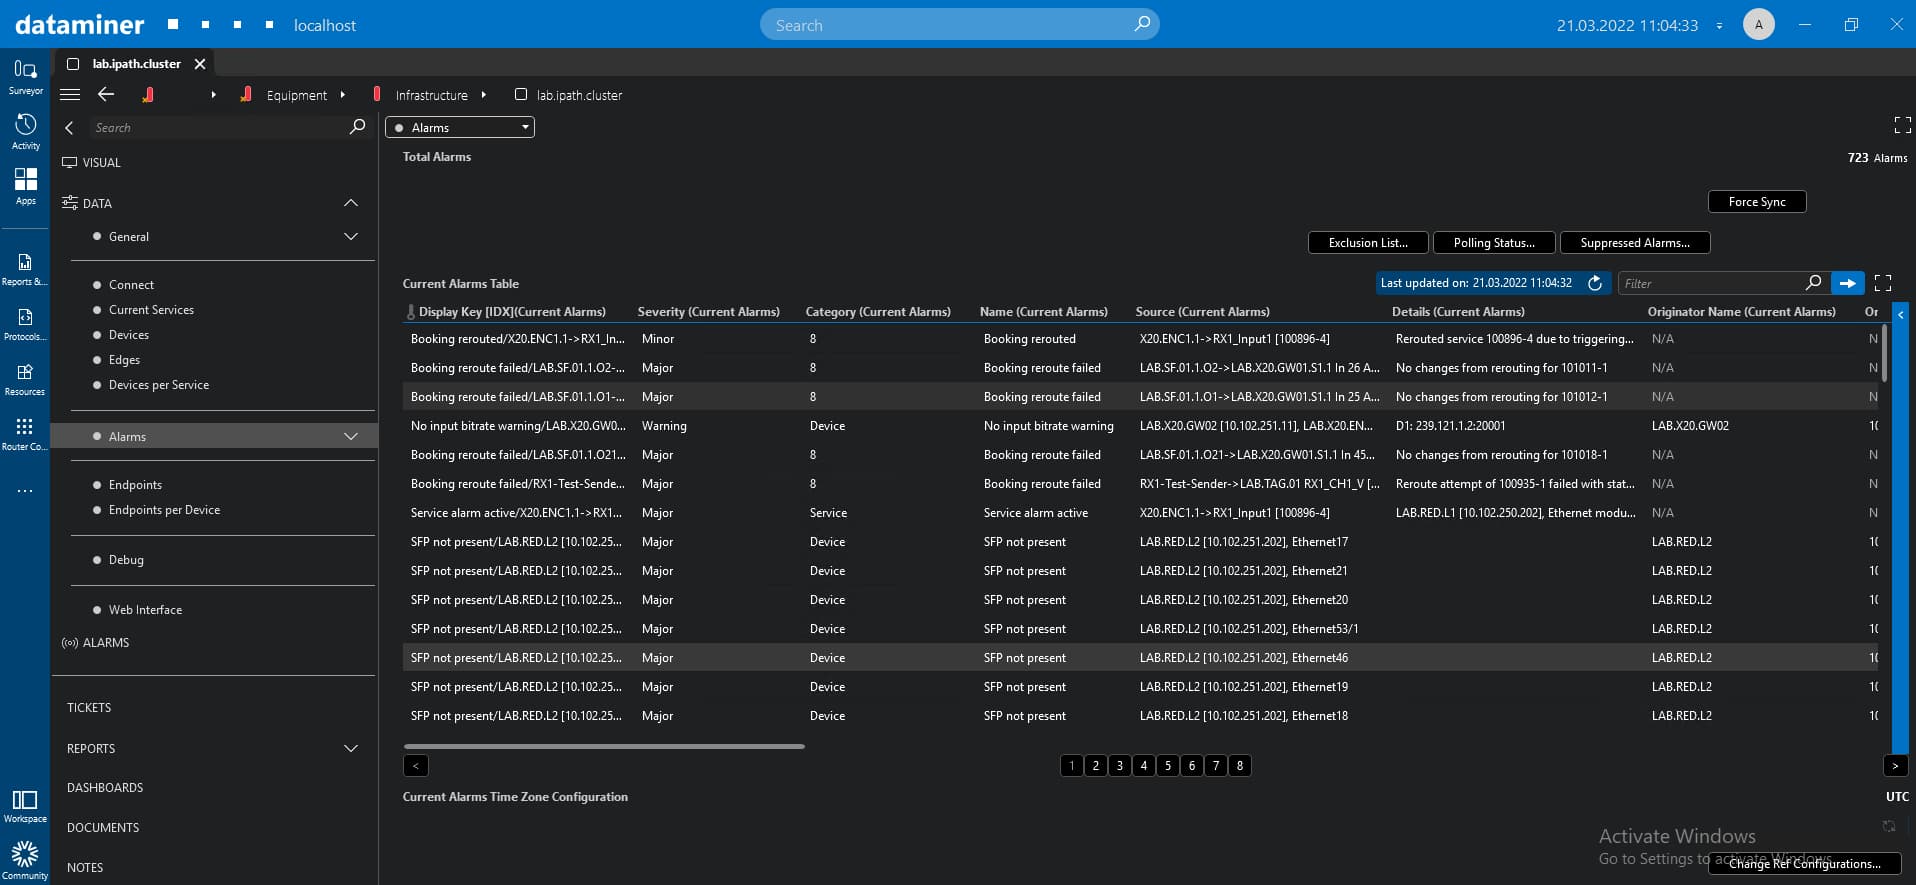 The "Alarms" page displays the alarm severity, alarm name, device IP, and alarm card parameters. Via the "Current Alarms Time Zone Configuration", you can change the time zone for the alarm data. This determines how the time information for the alarms is displayed in the alarms table. Changing this configuration will also affect the timing of the alarms generated for this connector in the Alarm Console.
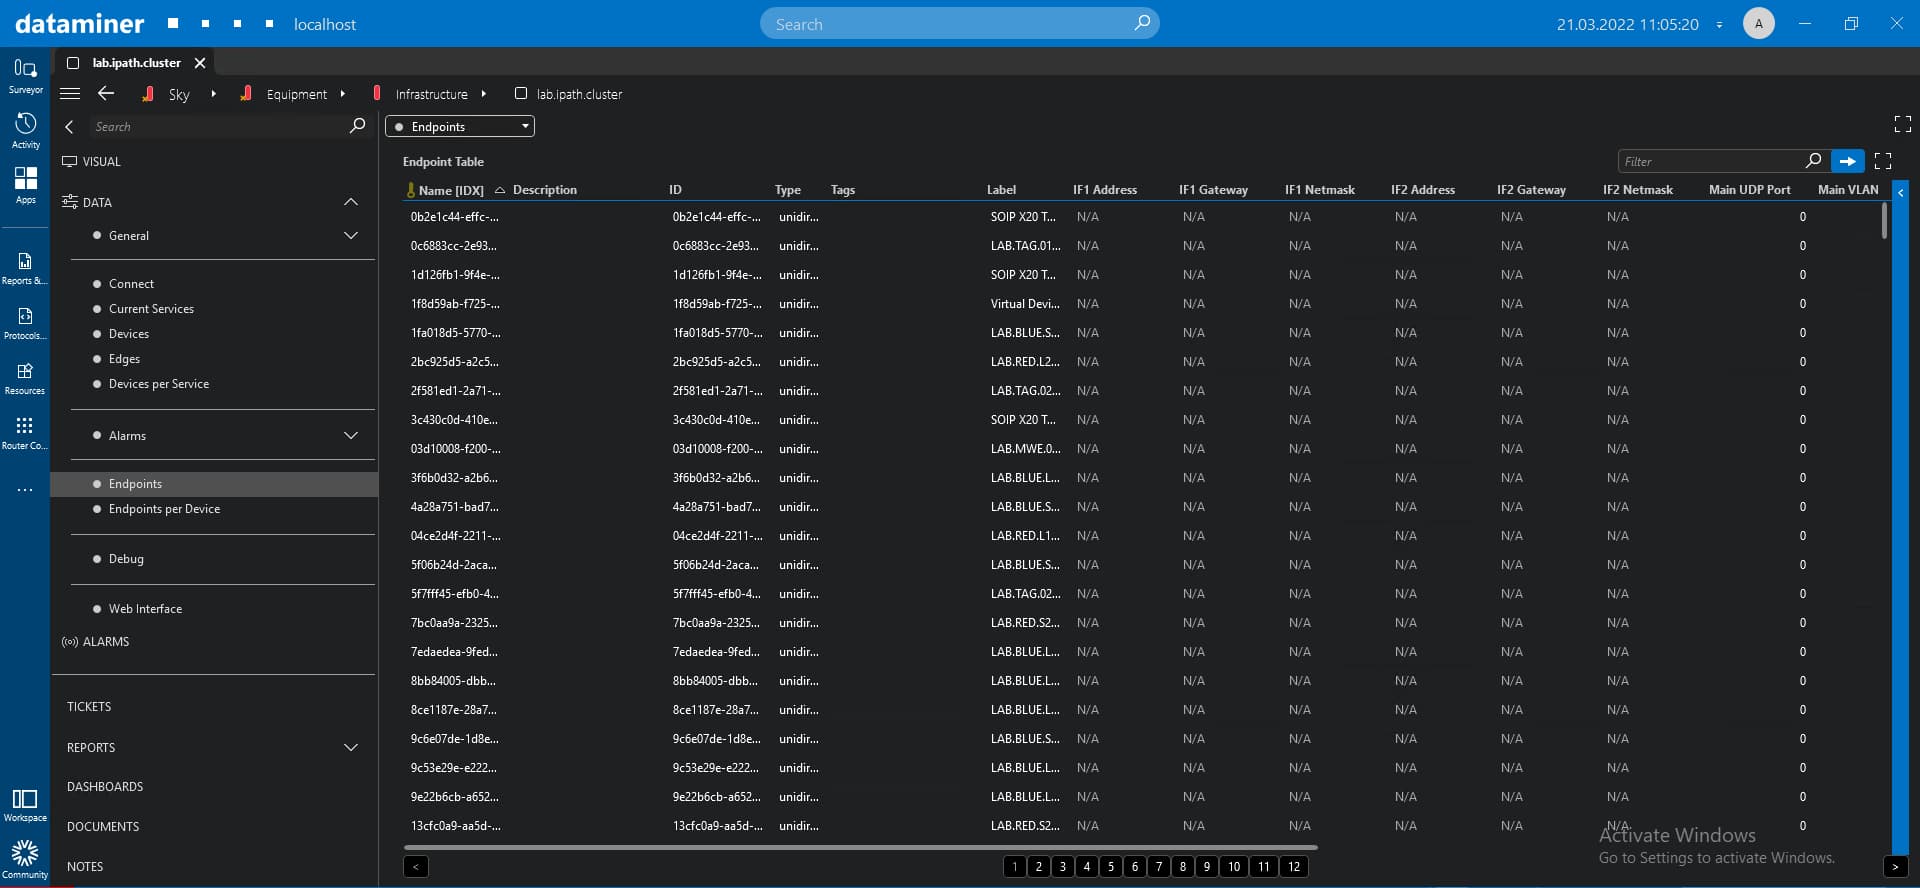 This page contains the "Endpoints Table", which displays the connection and alarm status for each endpoint, along with its severity, card, device name, number of alarms, and more.
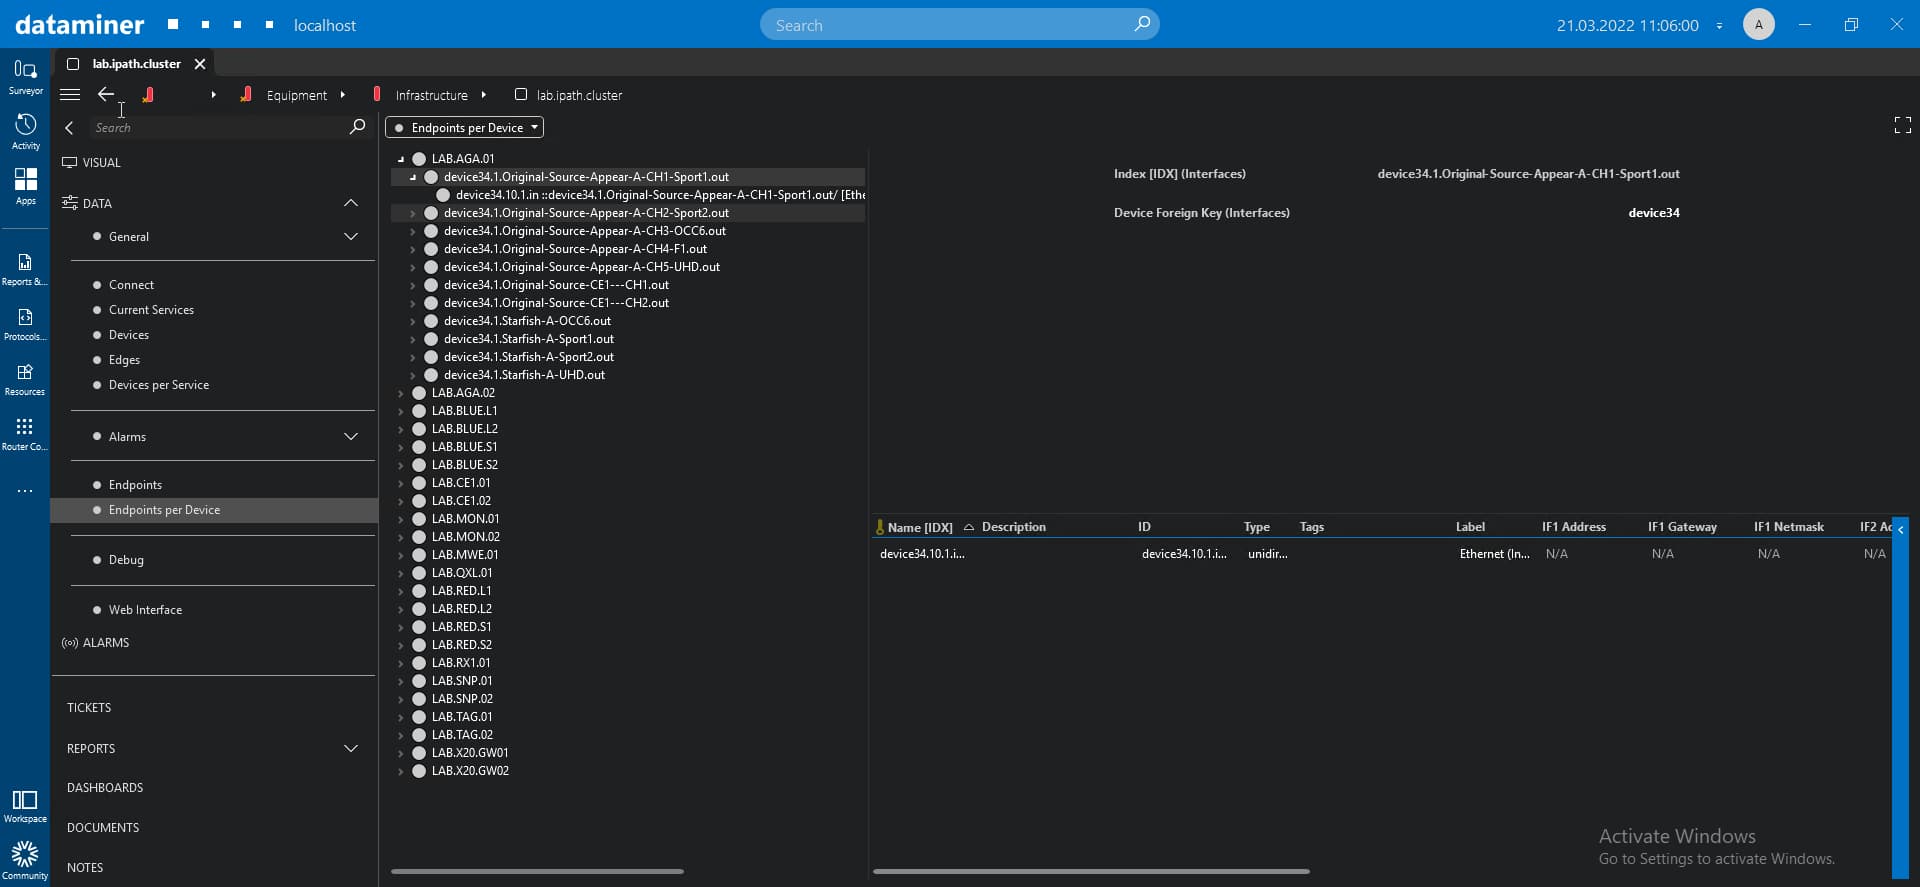 The "Endpoints per Device" page contains the "Endpoints per Device" tree view, which groups all endpoints used by each device.
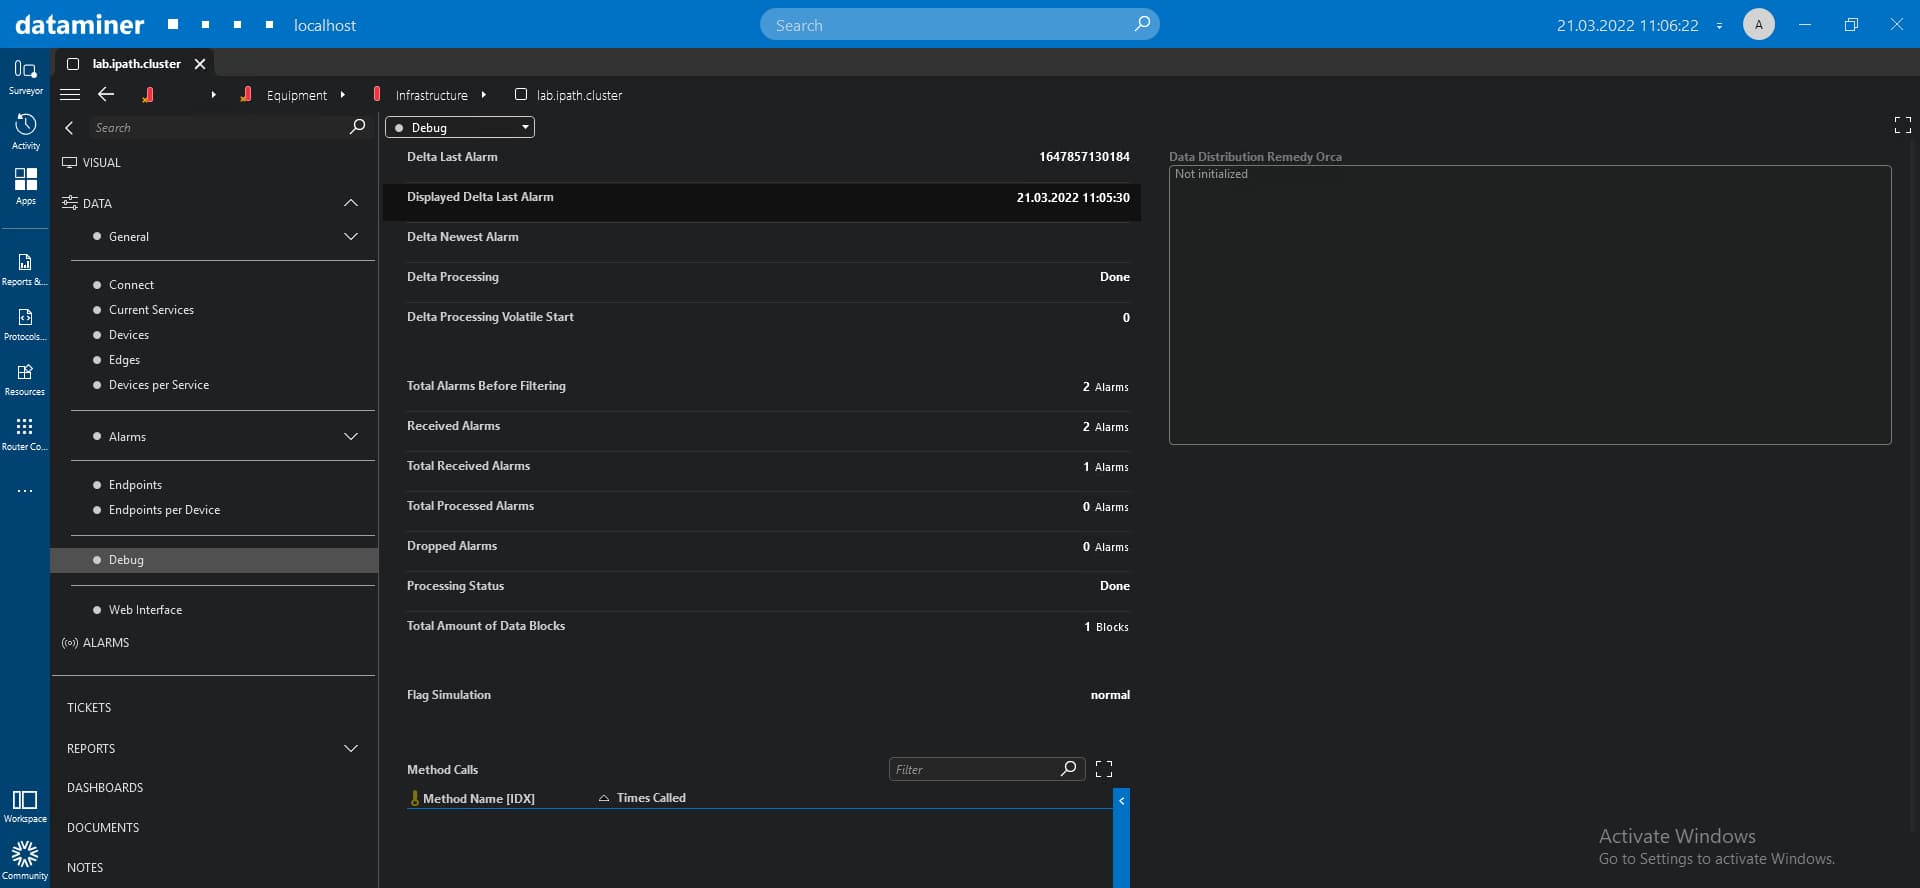 The "Debug" page summarizes the delta and alarms states.
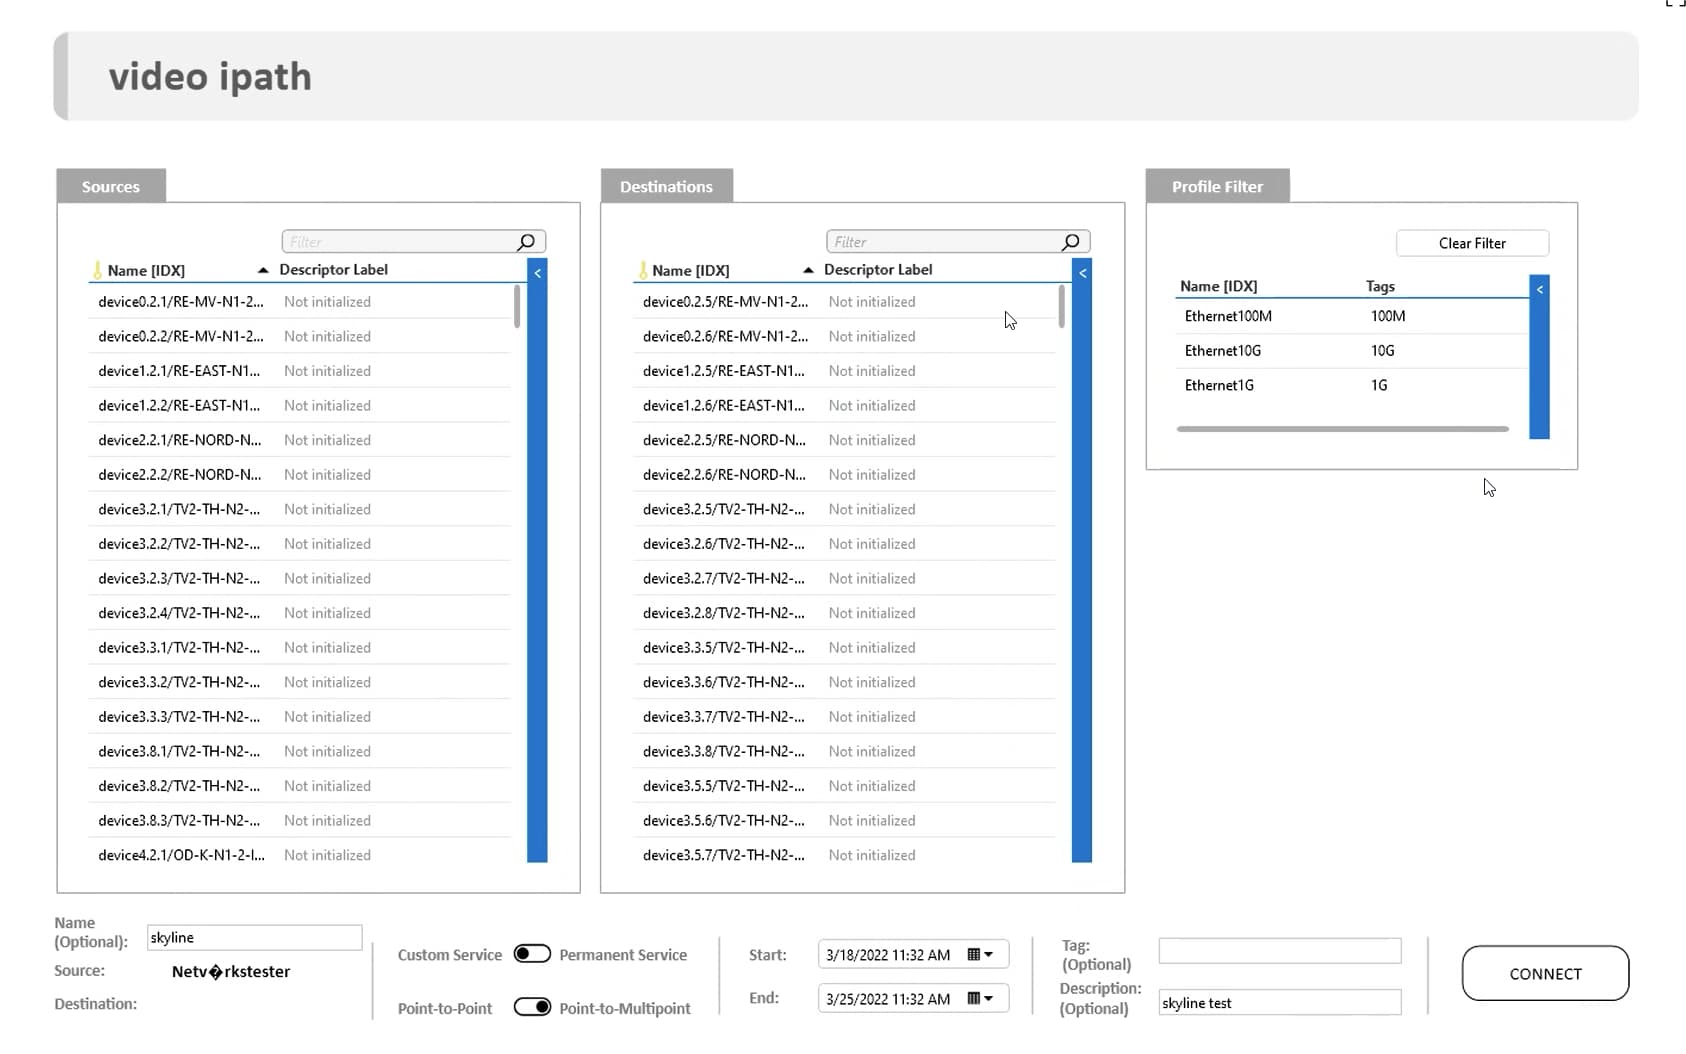
When you add a new service, you can include a Visual Overview file to improve the user experience. In this use case, the sources and destinations tables were added, plus the option to filter them by tag value. You can also give a name to the new service and decide to start it right away or at any time in the future. Other handy features include the possiblity to select whether custom or permanent service is used, and to enable point-to-point and point-to-multipoint connections.
The "Debug" page summarizes the delta and alarms states.
When you add a new service, you can include a Visual Overview file to improve the user experience. In this use case, the sources and destinations tables were added, plus the option to filter them by tag value. You can also give a name to the new service and decide to start it right away or at any time in the future. Other handy features include the possiblity to select whether custom or permanent service is used, and to enable point-to-point and point-to-multipoint connections.