example Use Case
NAB 2023 – Skyline Technology Partners
Riedel
NetInsight
Check out this use case to learn about demos we are building and showcasing together with our technology partners for NAB 2023. More will be added over the next couple of weeks, so check back soon!
USE CASE DETAILS
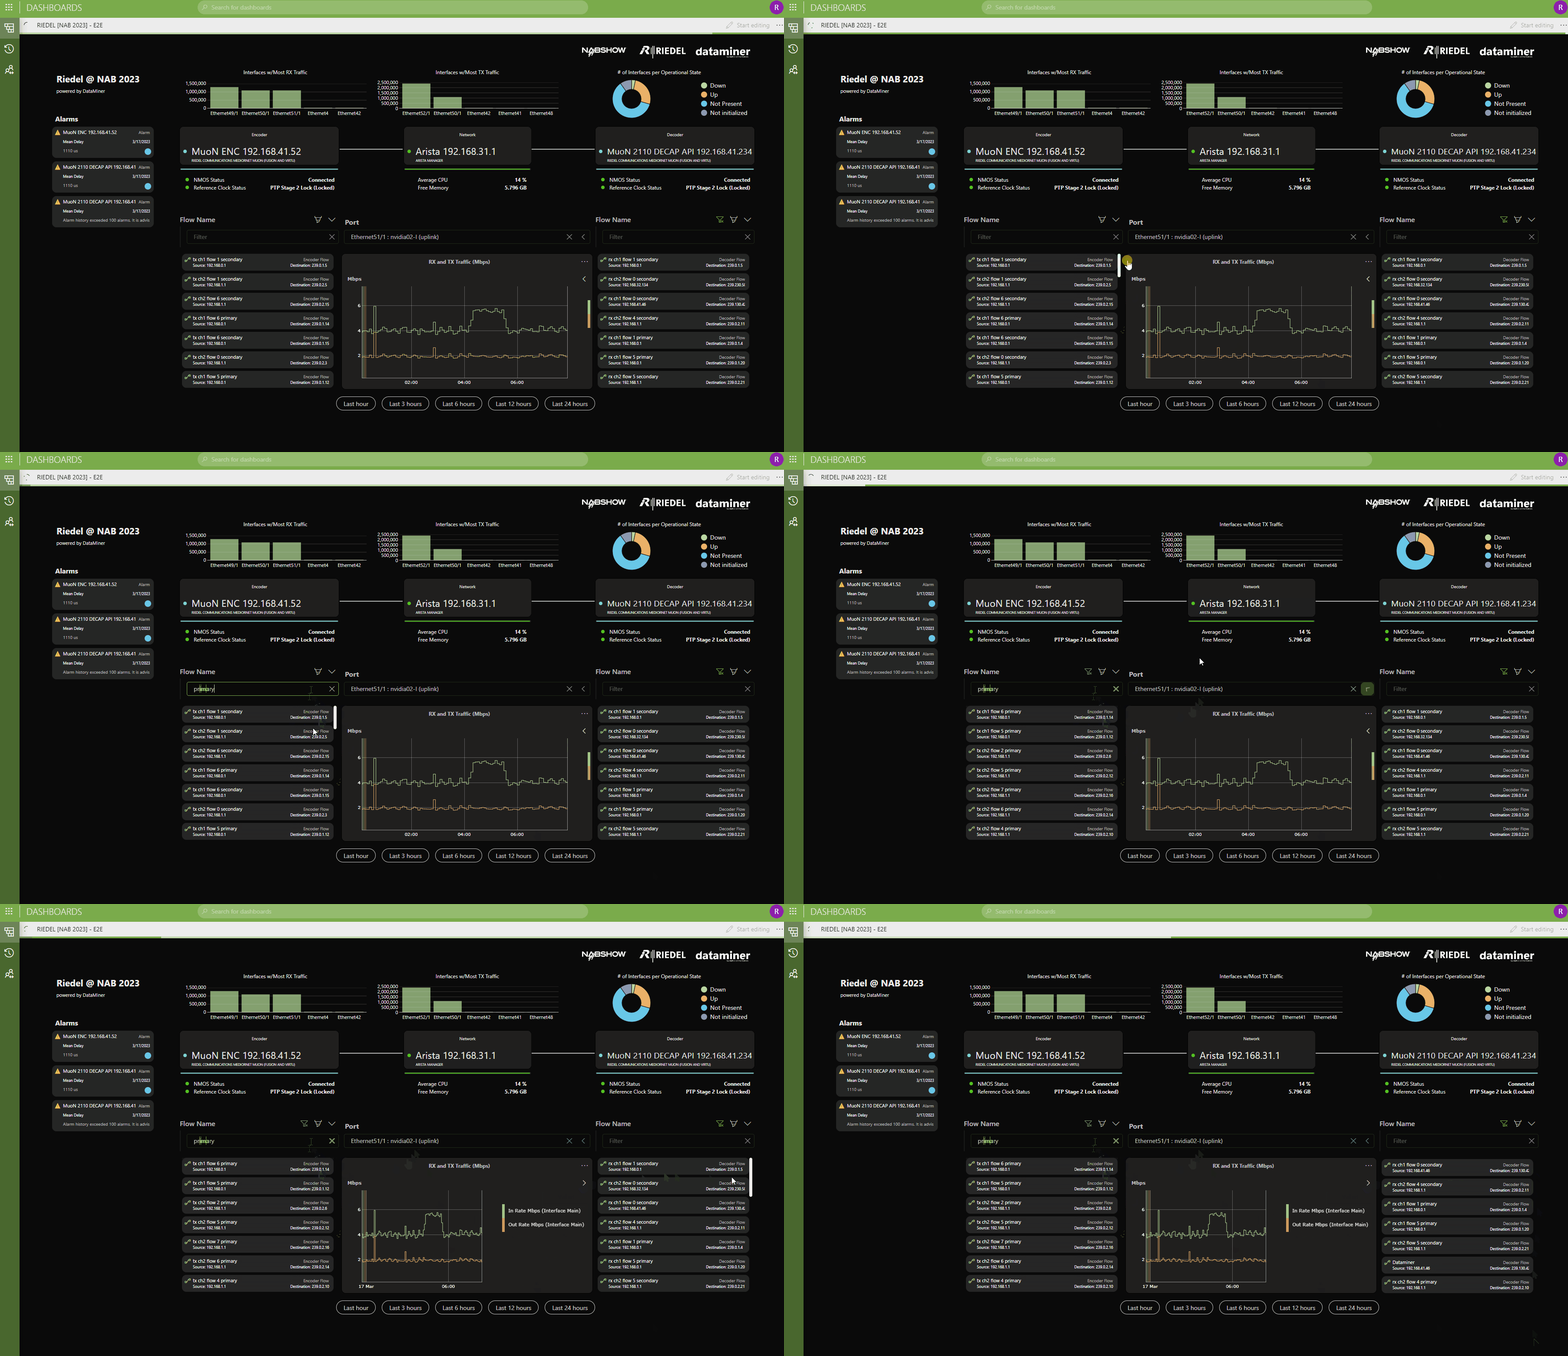 RIEDEL - Come to the Riedel booth (C4910 & C3319) to see a DataMiner integration with the Riedel MuoN family. With this dashboard, we monitor ST2110 encapsulators and decapsulators, and we also verify the network utilization across their media network (Arista).
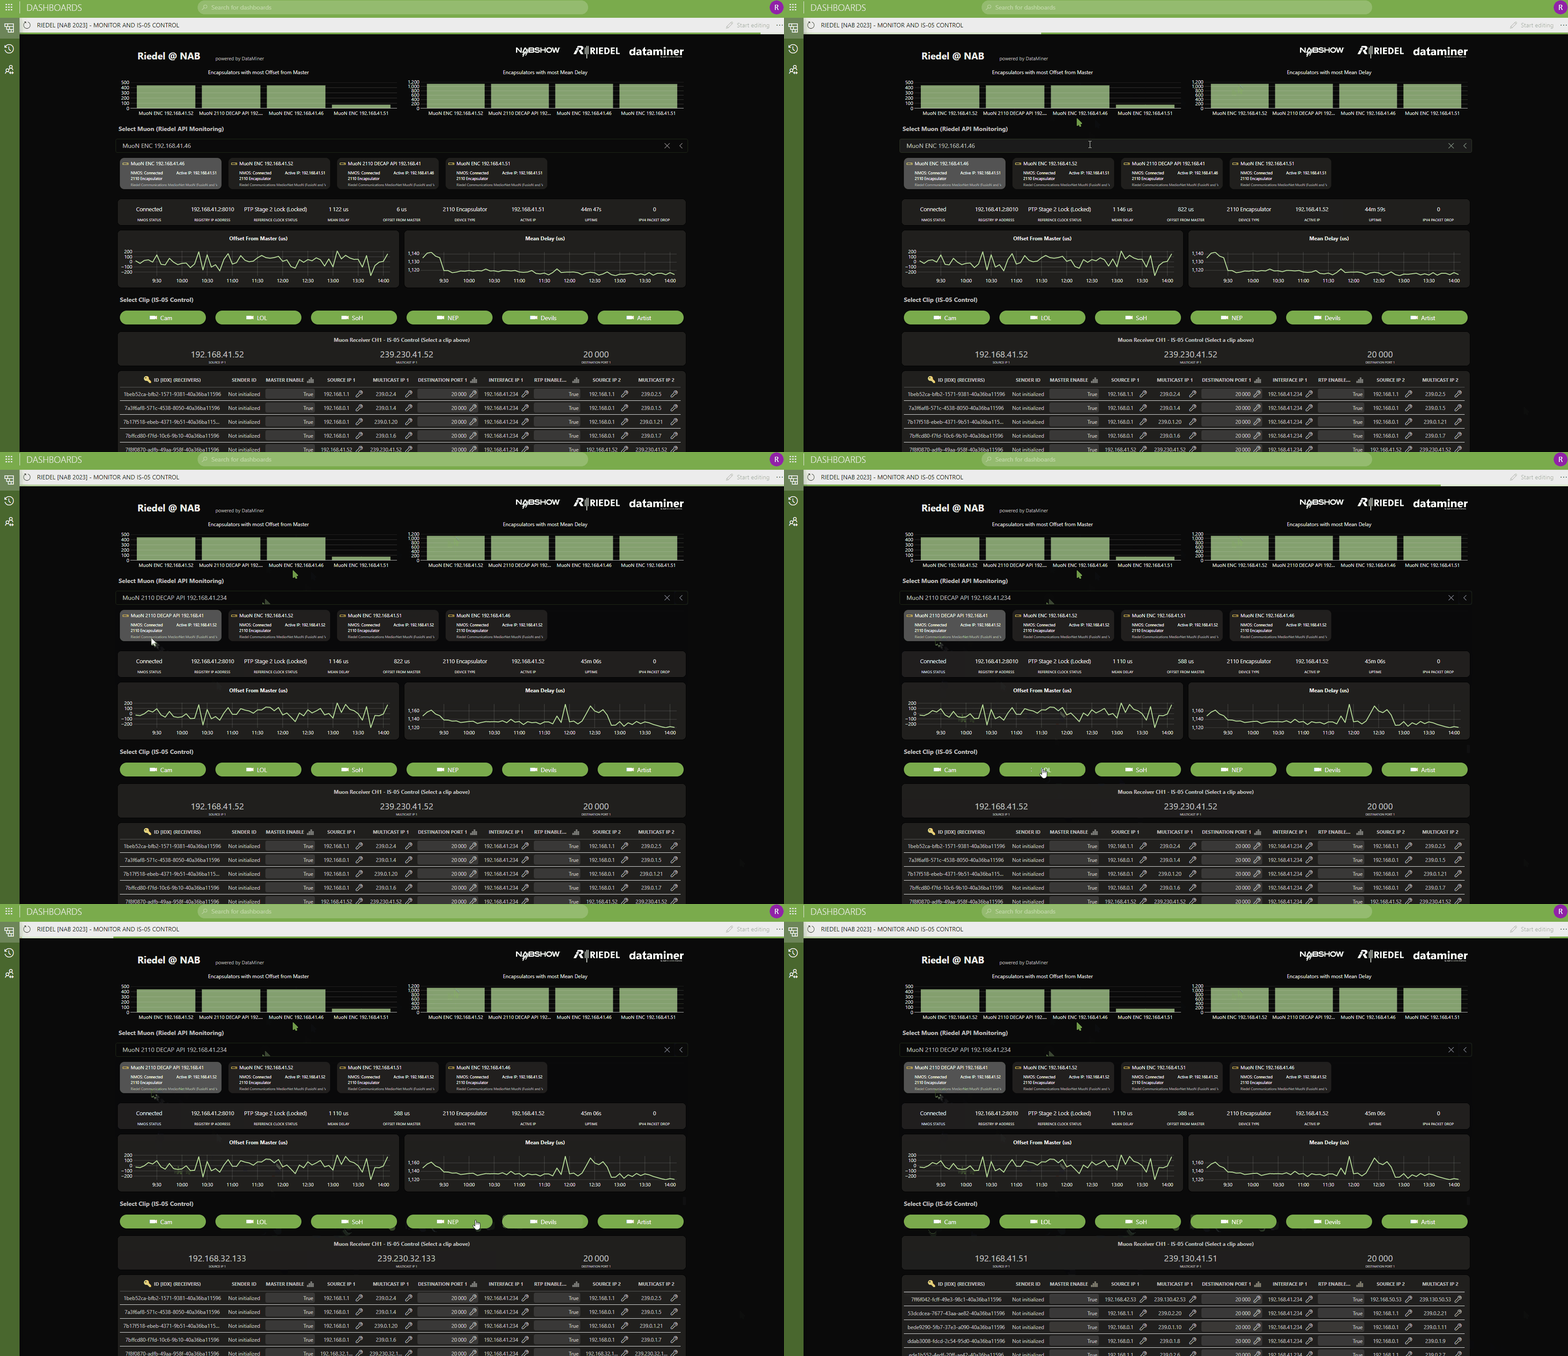 RIEDEL - This is another control surface you can find at the Riedel booth, where we showcase real-time ST2110 signal switching based on the open NMOS IS05 specifications, combined with monitoring via the Riedel MuoN. And as Riedel also shares those dashboards and control surfaces with Skyline, you will also see those at the Skyline booth in the West hall.
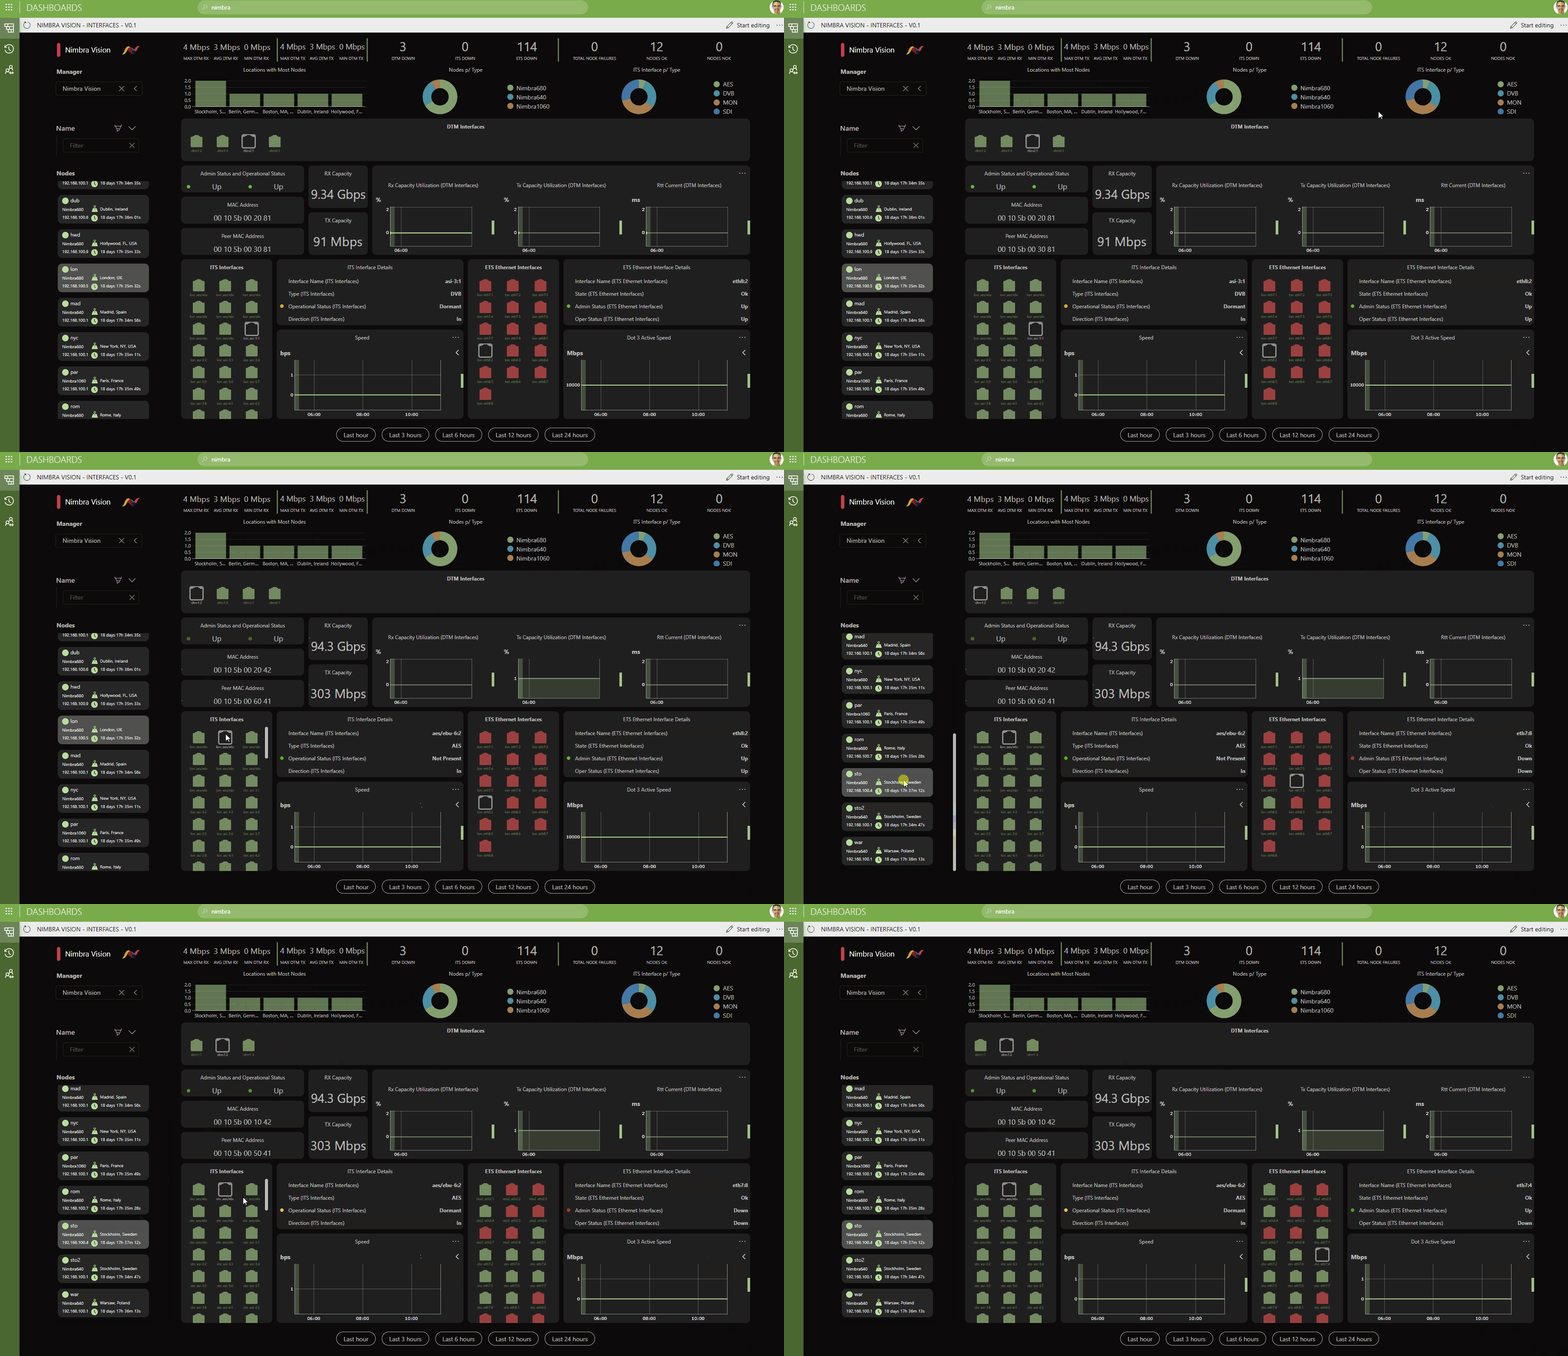 NETINSIGHT - Interfacing with NimbraVision, this dashboard allows you browse through all Nimbra nodes and check the most important metrics, parameters, and KPIs on each interface.
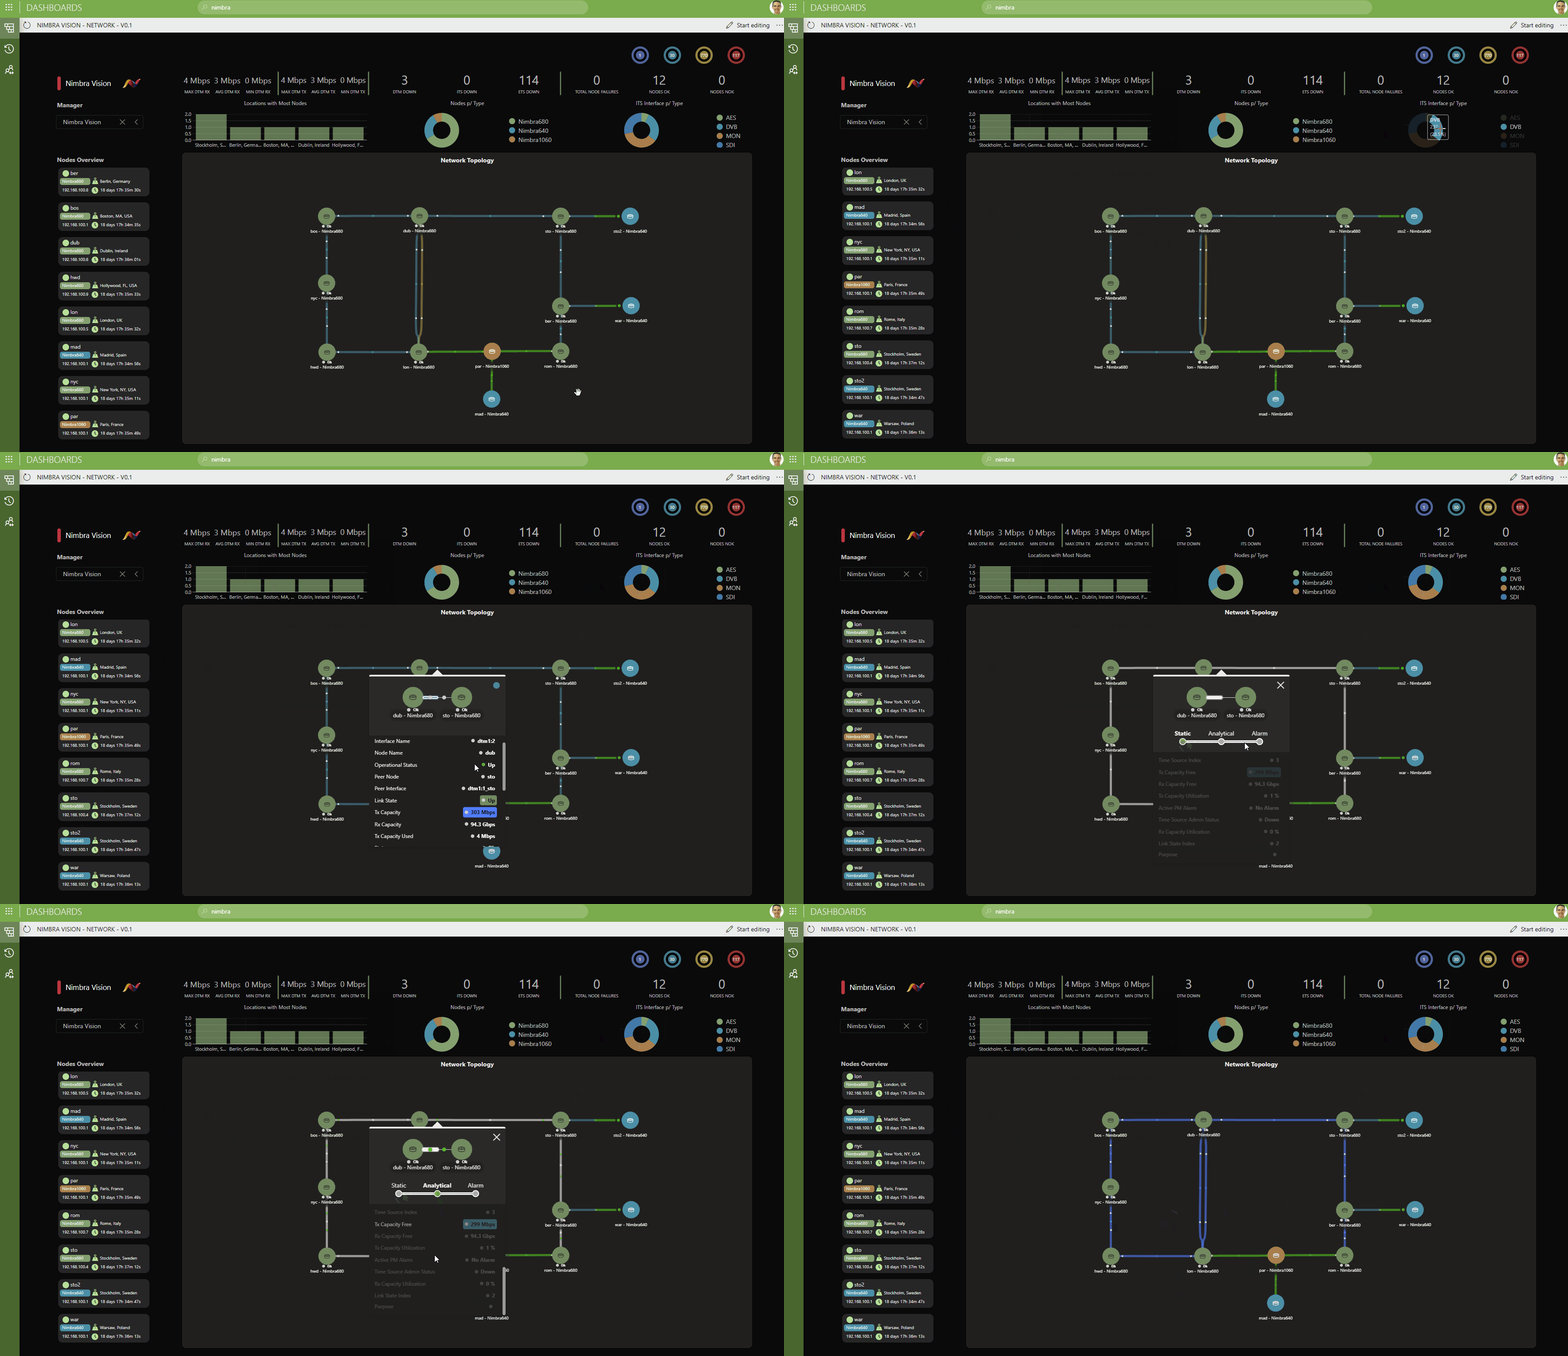 NETINSIGHT - Here is another dashboard we have built that shows a Nimbra network. Simply hover over the Nimbra nodes and connections to see real-time data. And swap between the alarm and analytics functions of our node-edge component.
 HAIVISION - This is an integration with the HaiVision (AviWest) Streamhub platform. On the left part of the screen, we monitor all inputs. Just select one of them in the dropdown to see details. And on the right, you can switch between two different inputs, plus we also decode one of the Streamhub outputs (HLS). You can also change the latency and the video capped bitrate of the incoming stream straight from this interface. By the way, the second input comes from HaiVision's MojoPro App to stream live from your phone.
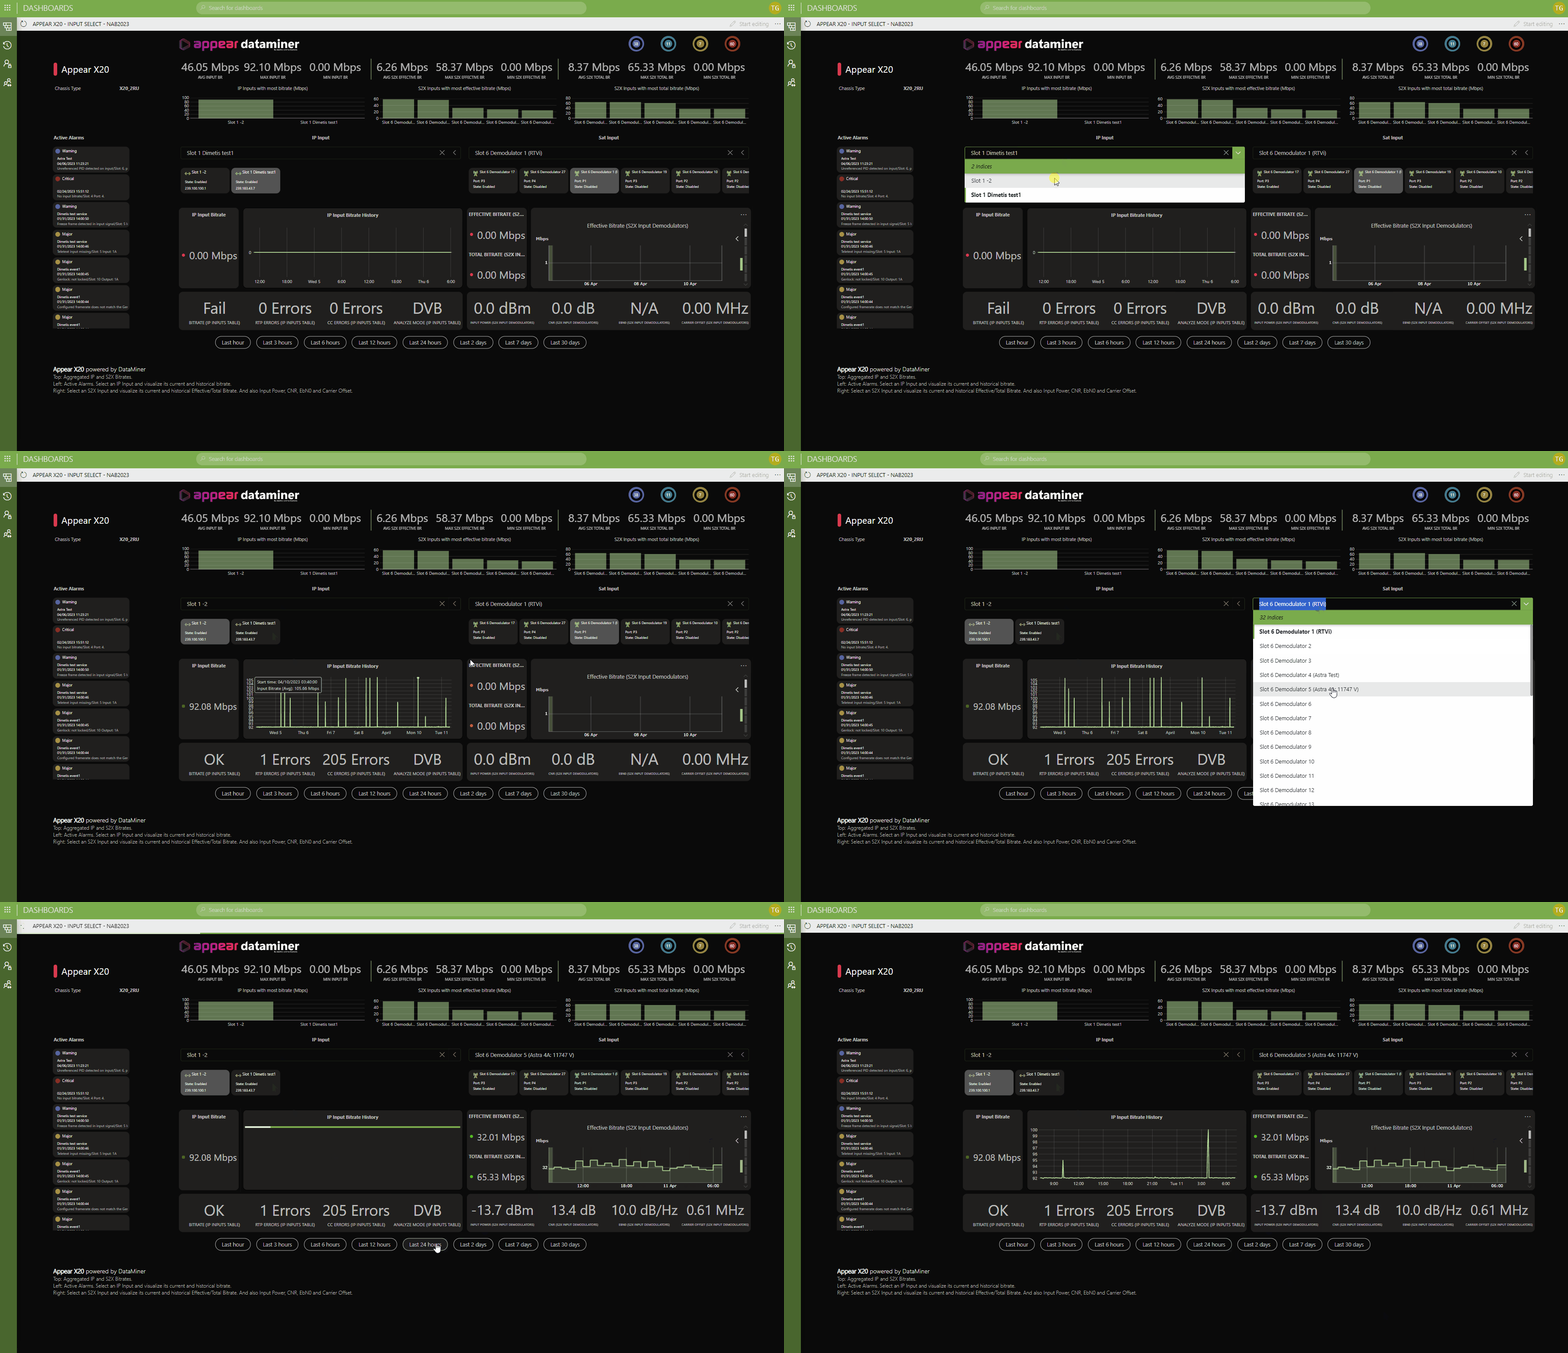 APPEAR - Integration with Appear's X20 platform to monitor IP multicast inputs and signals received via satellite.
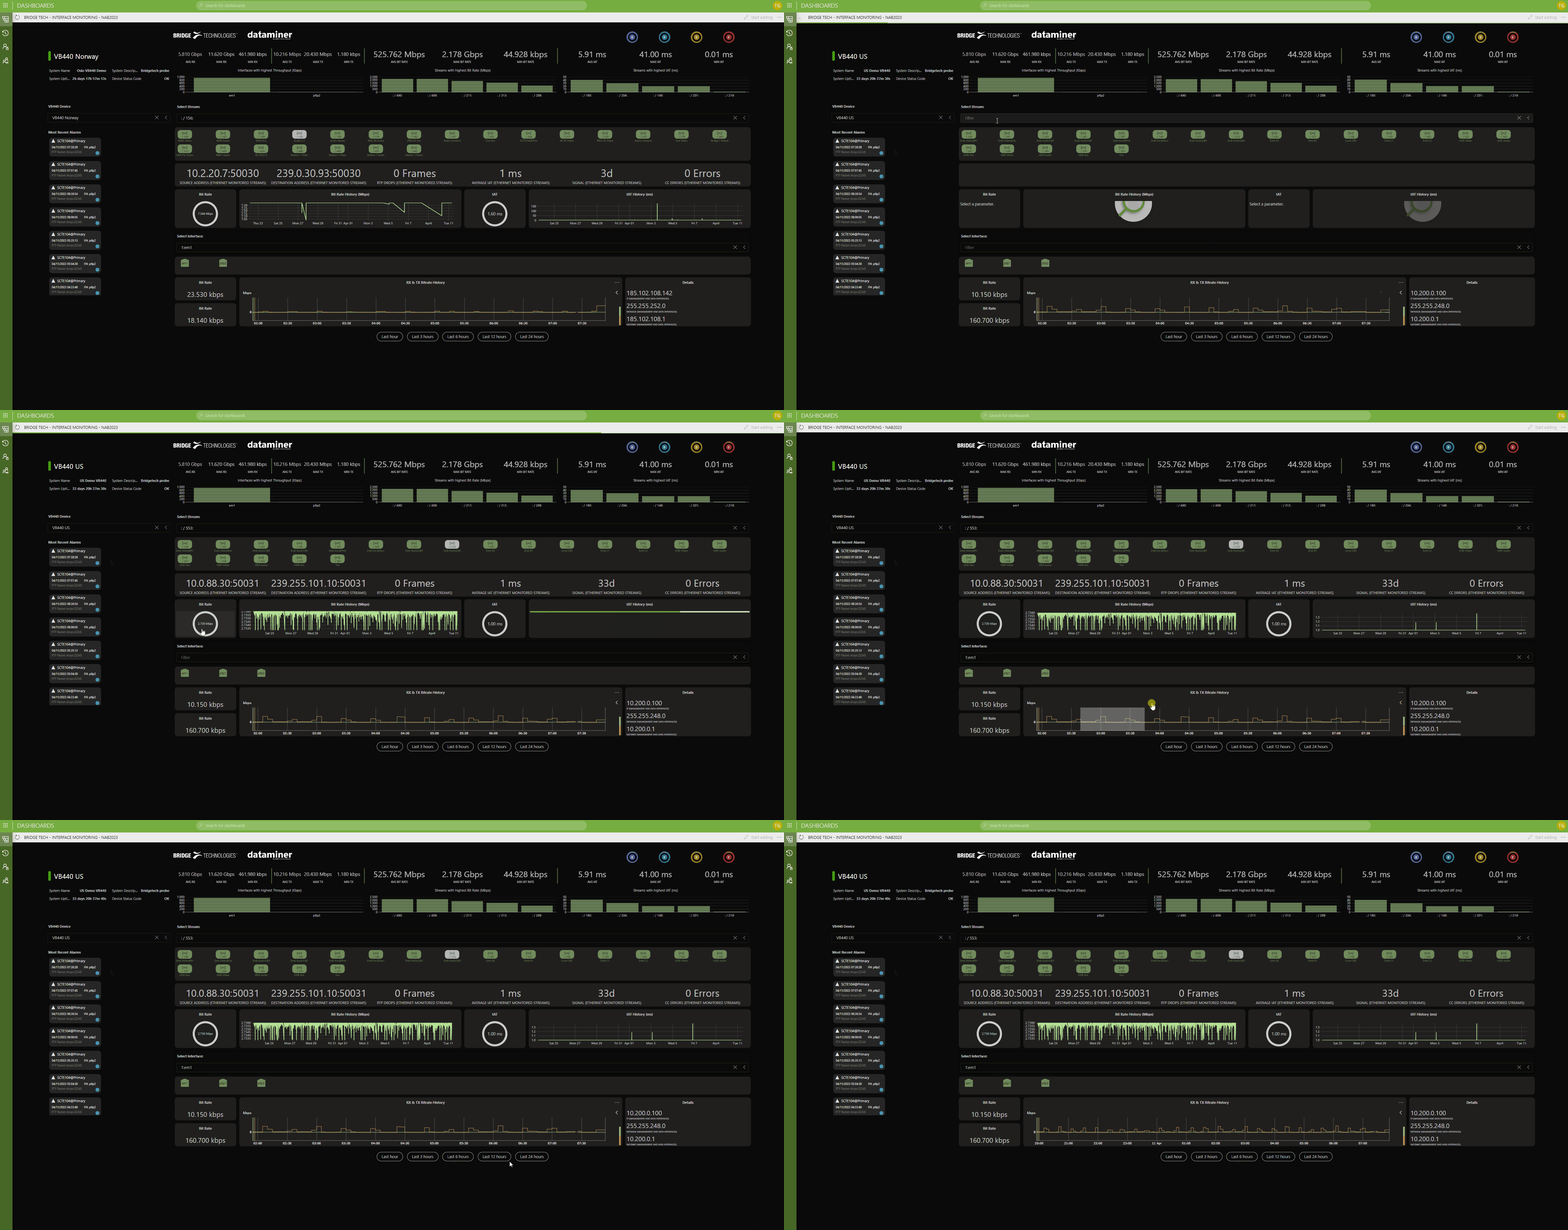 BRIDGE TECHNOLOGIES - Select one of the VB440 units first, then check out one of the available multicast streams and get details on the RX & TX bitrate of each VB440 interface. And don't forget to look after the most recent alarms the VB440 reports.
 BRIDGE TECHNOLOGIES - Here is a DataMiner live dashboard which has the new Widglets from Bridge Technologies embedded. Select a service, decode the video and pick the scope you want to see.
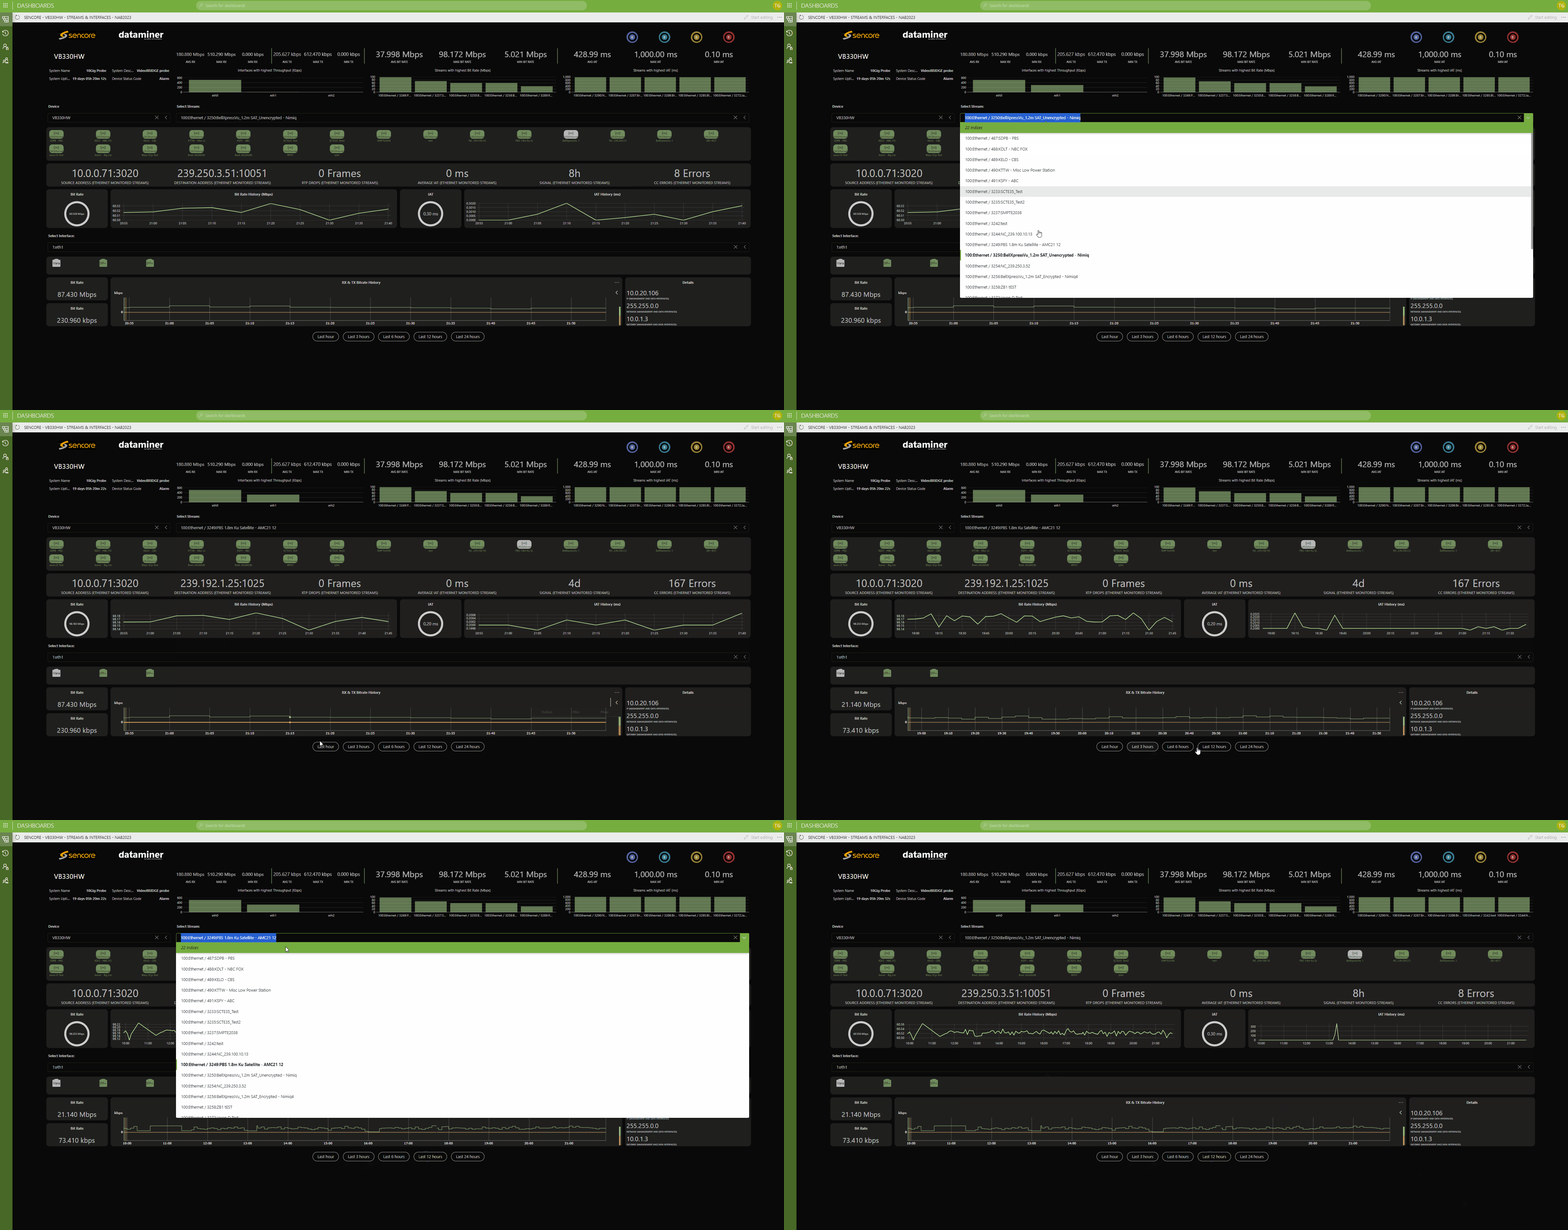 SENCORE - This dashboard shows real-time live data from a Sencore VB330 probe. Select one of the available streams from the dropdown or one of the probe's ethernet interfaces to get more details.
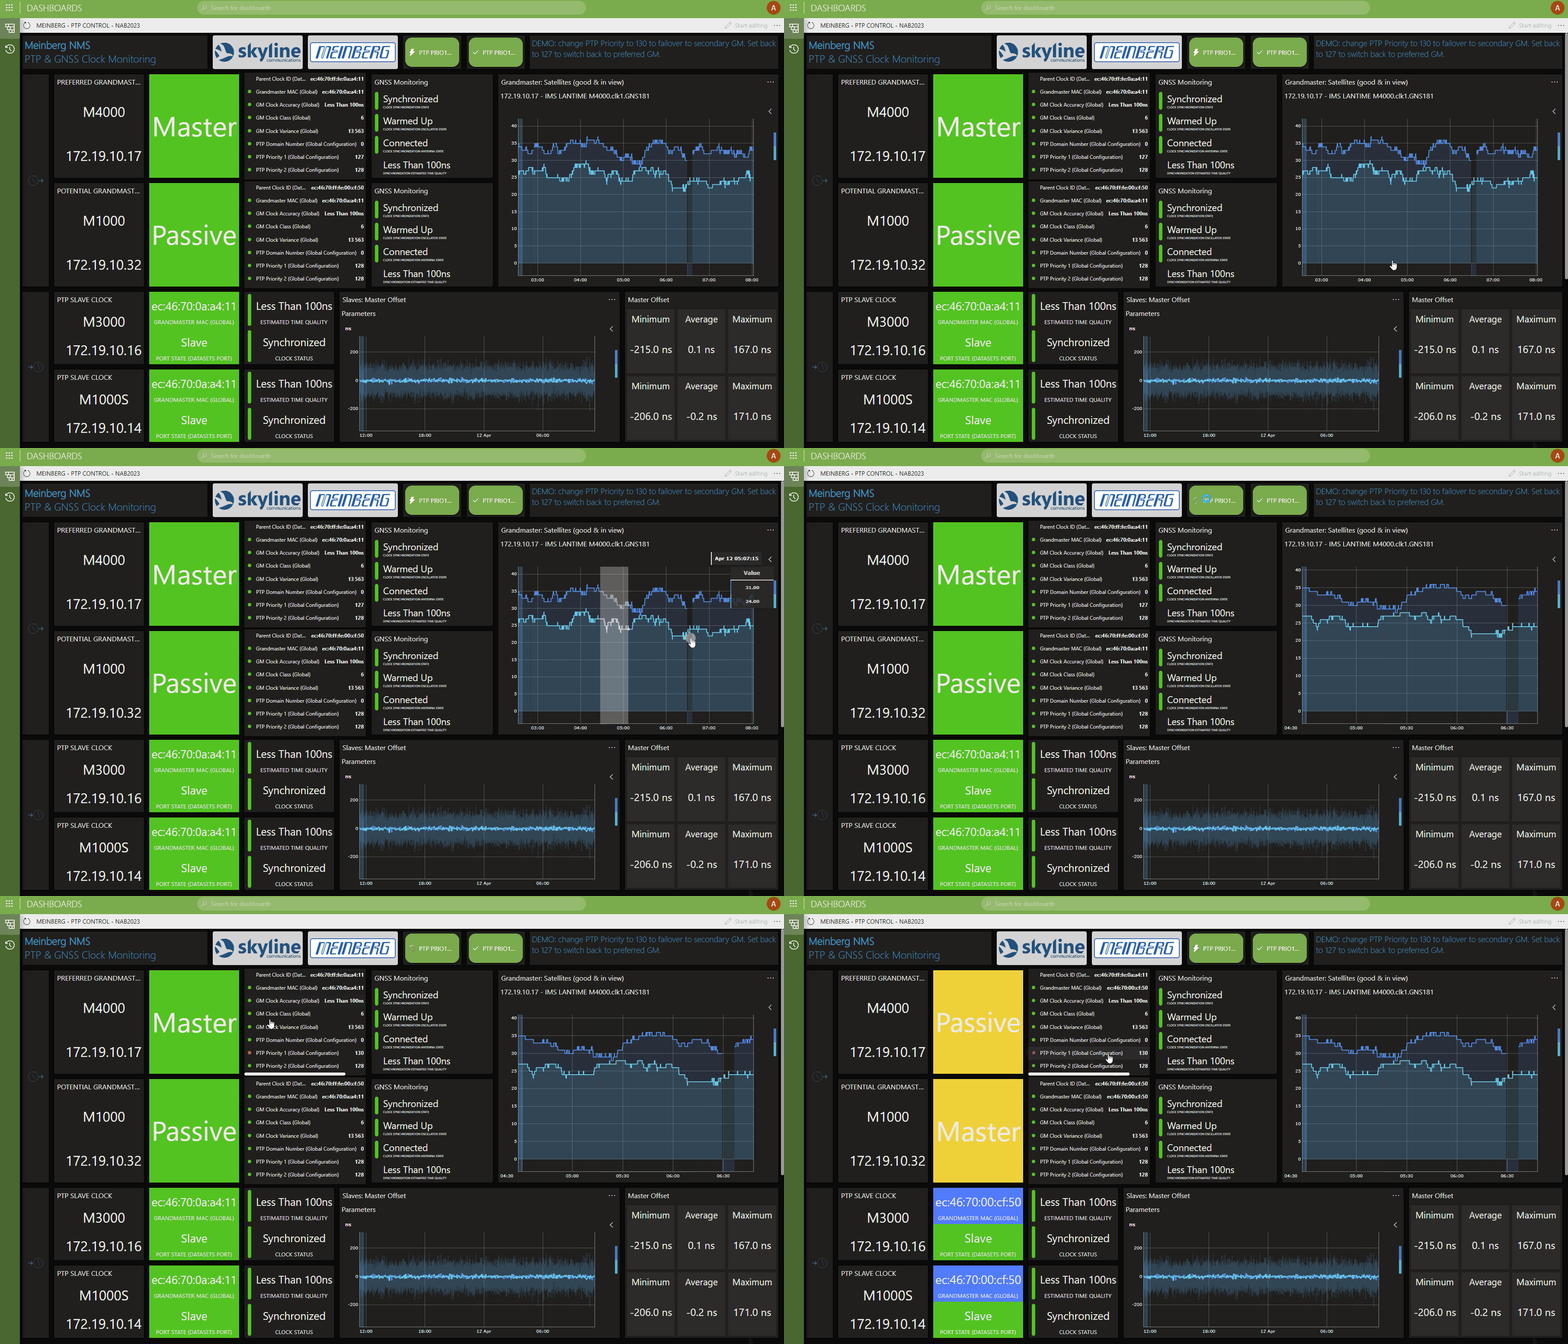 MEINBERG - On this dashboard you can see how DataMiner tracks the PTP state of two PTP Grandmasters and two PTP slave clocks. Just click on the action buttons to initiate a failover from a primary to a secondary Grandmaster. (takes around 1 min. to complete failover process). T
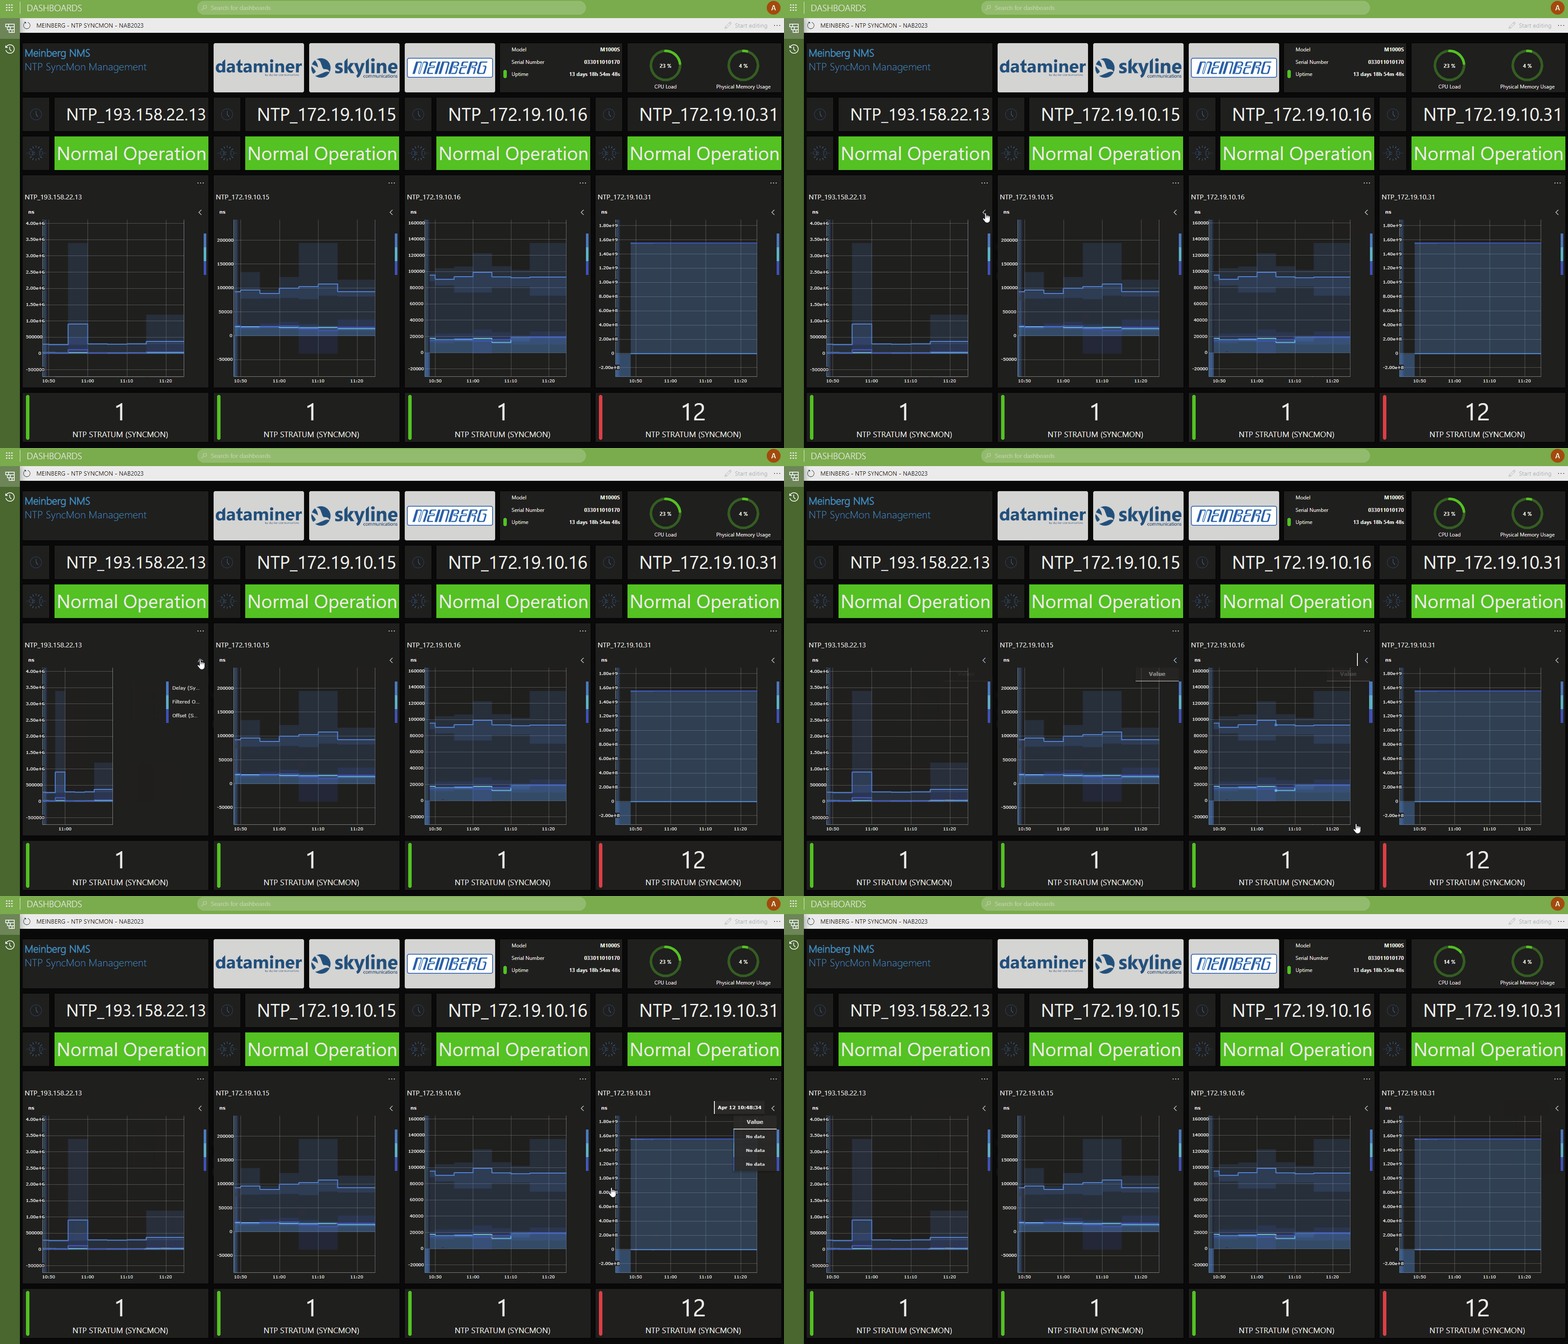 MEINBERG - This dashboard shows offset, filtered offset and delay of multiple NTP SyncMon devices - live from the Meinberg lab in Germany.
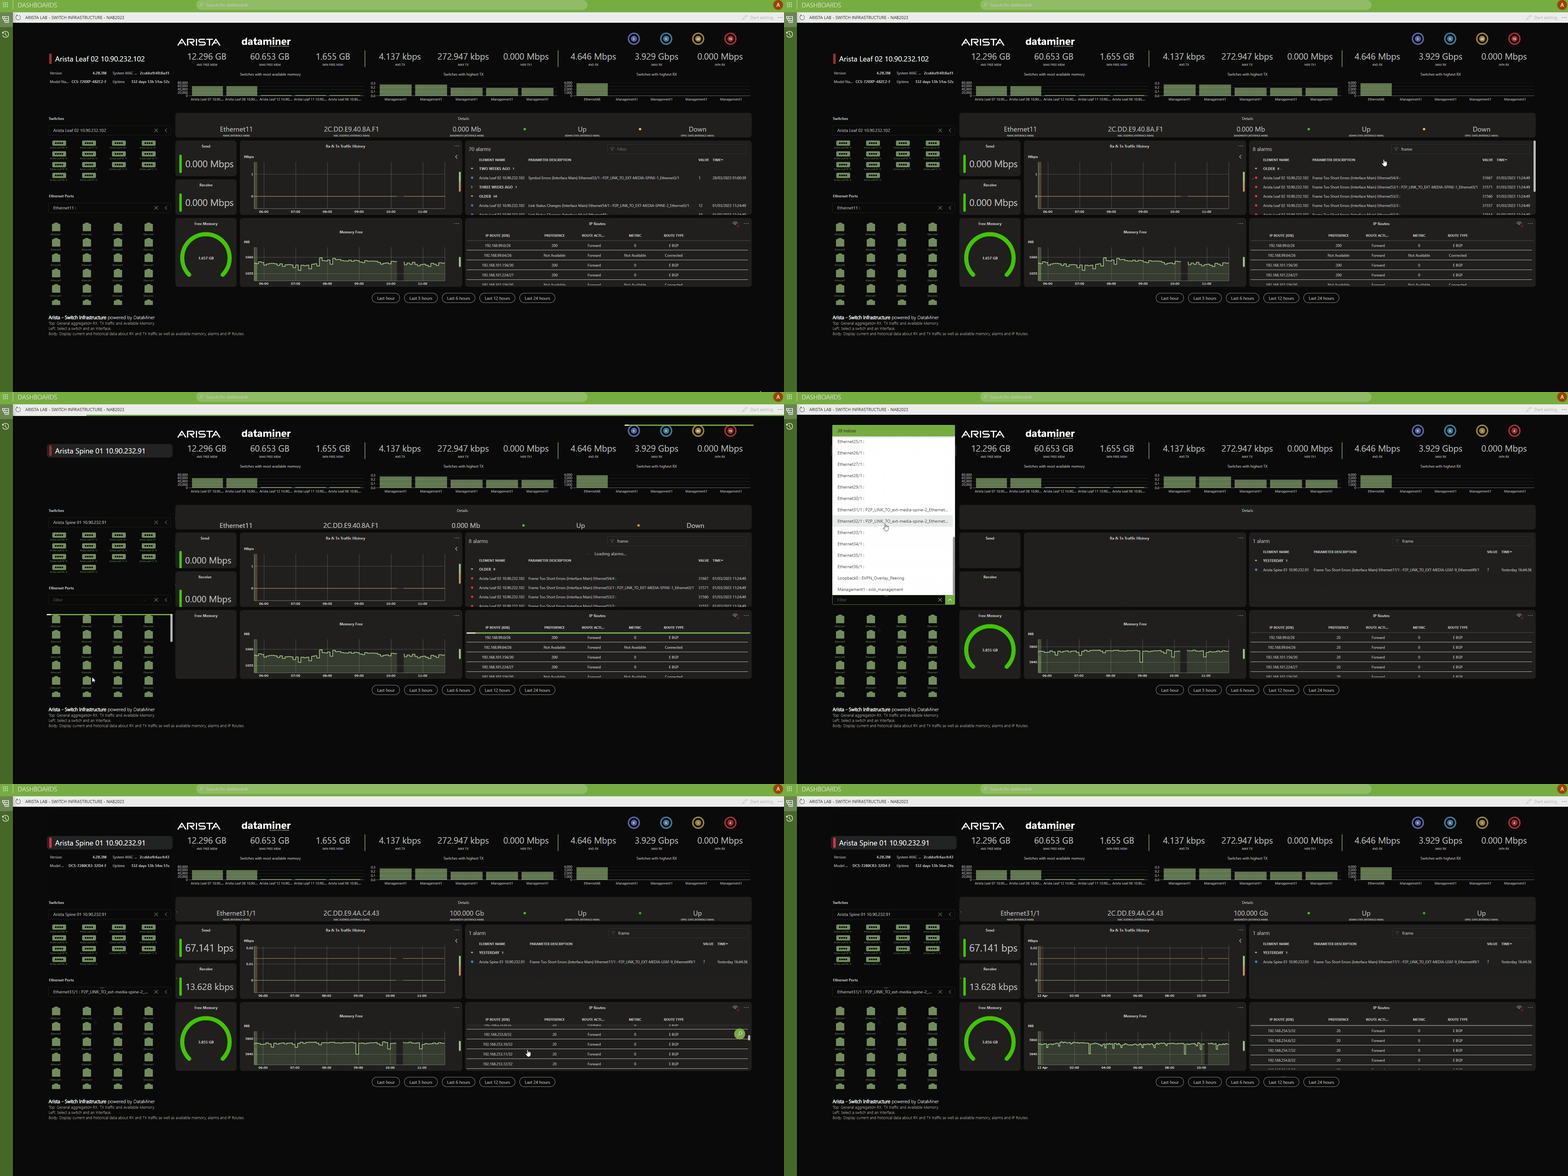 ARISTA - Check out this dashboard to monitor an Arista spine-leaf network and its most important metrics and KPIs.
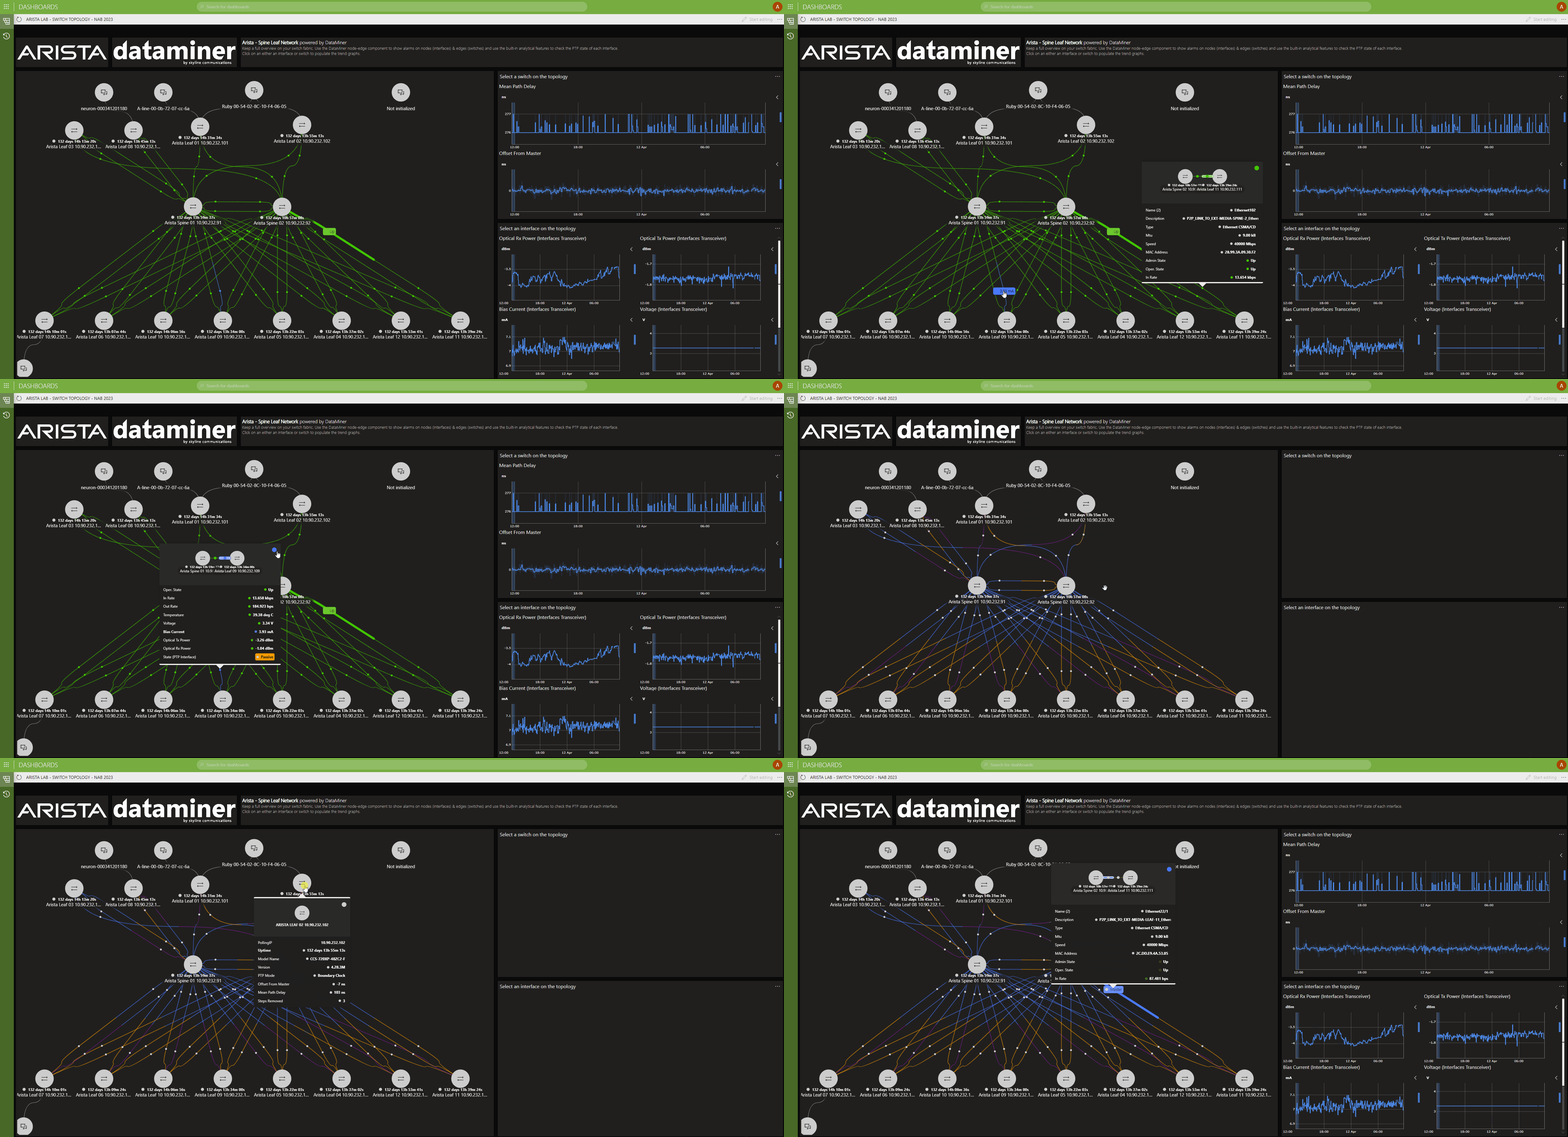 ARISTA - Keep a full overview on your Arista switch fabric. Use the DataMiner node-edge component to show alarms on nodes (interfaces) & edges (switches) and use the built-in analytical features to check the PTP state of each interface. Click on an either an interface or switch to populate the trend graphs.
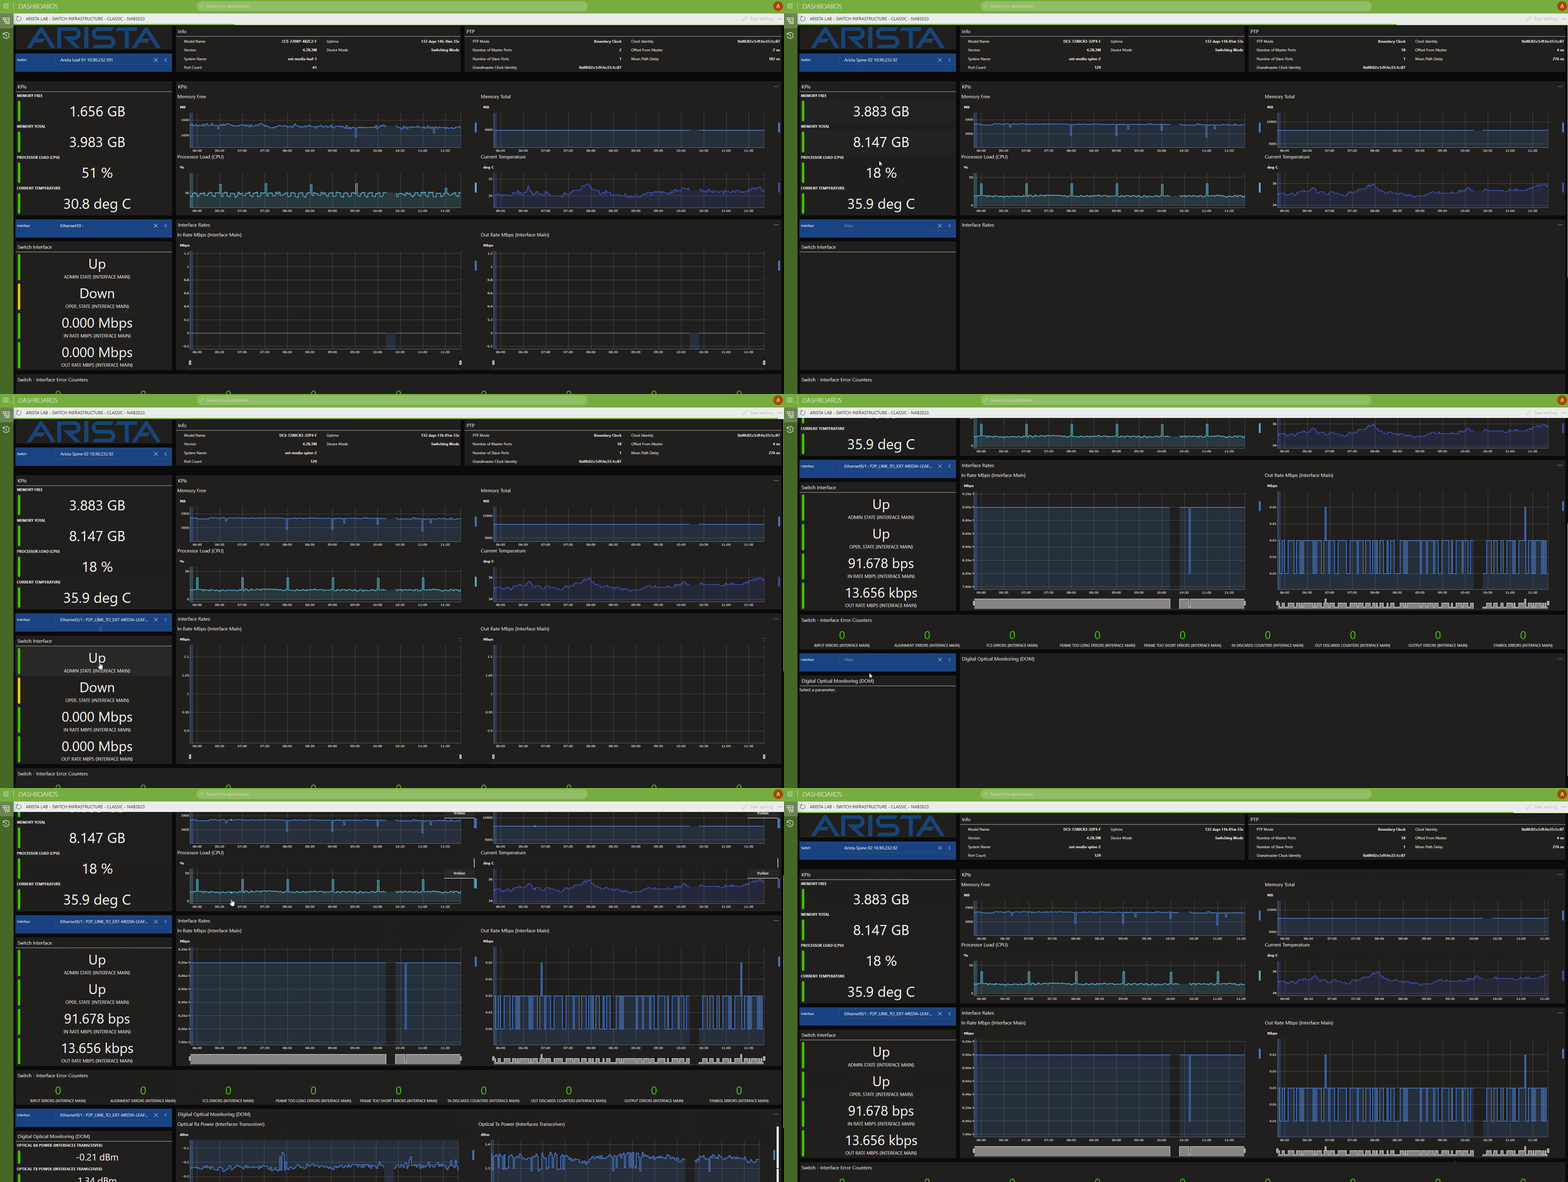 ARISTA - Use this dashboard to keep an 360° overview on your Arista spine-leaf fabric and get real-time access to interface info, SFP data, not to forget about your PTP KPIs.
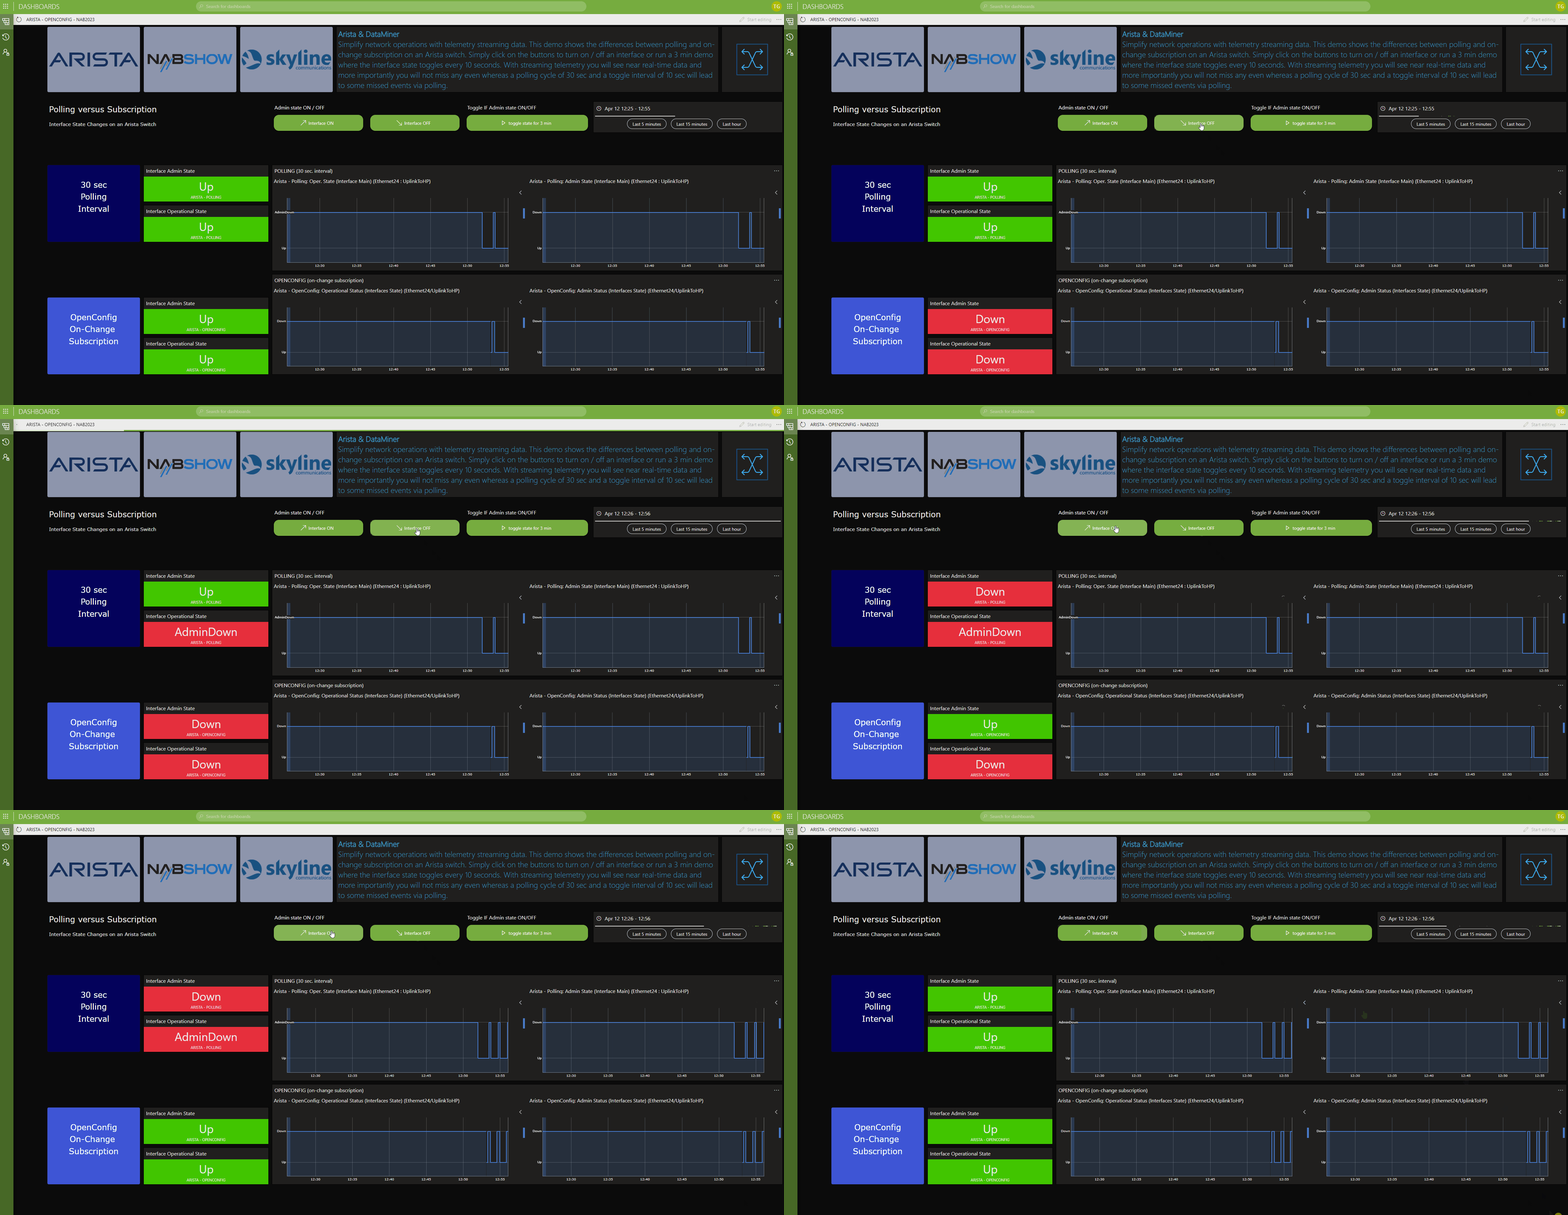 ARISTA - On this dashboard you can try out the differences between polling and OpenConfig streaming telemetry data on an Arista switch.
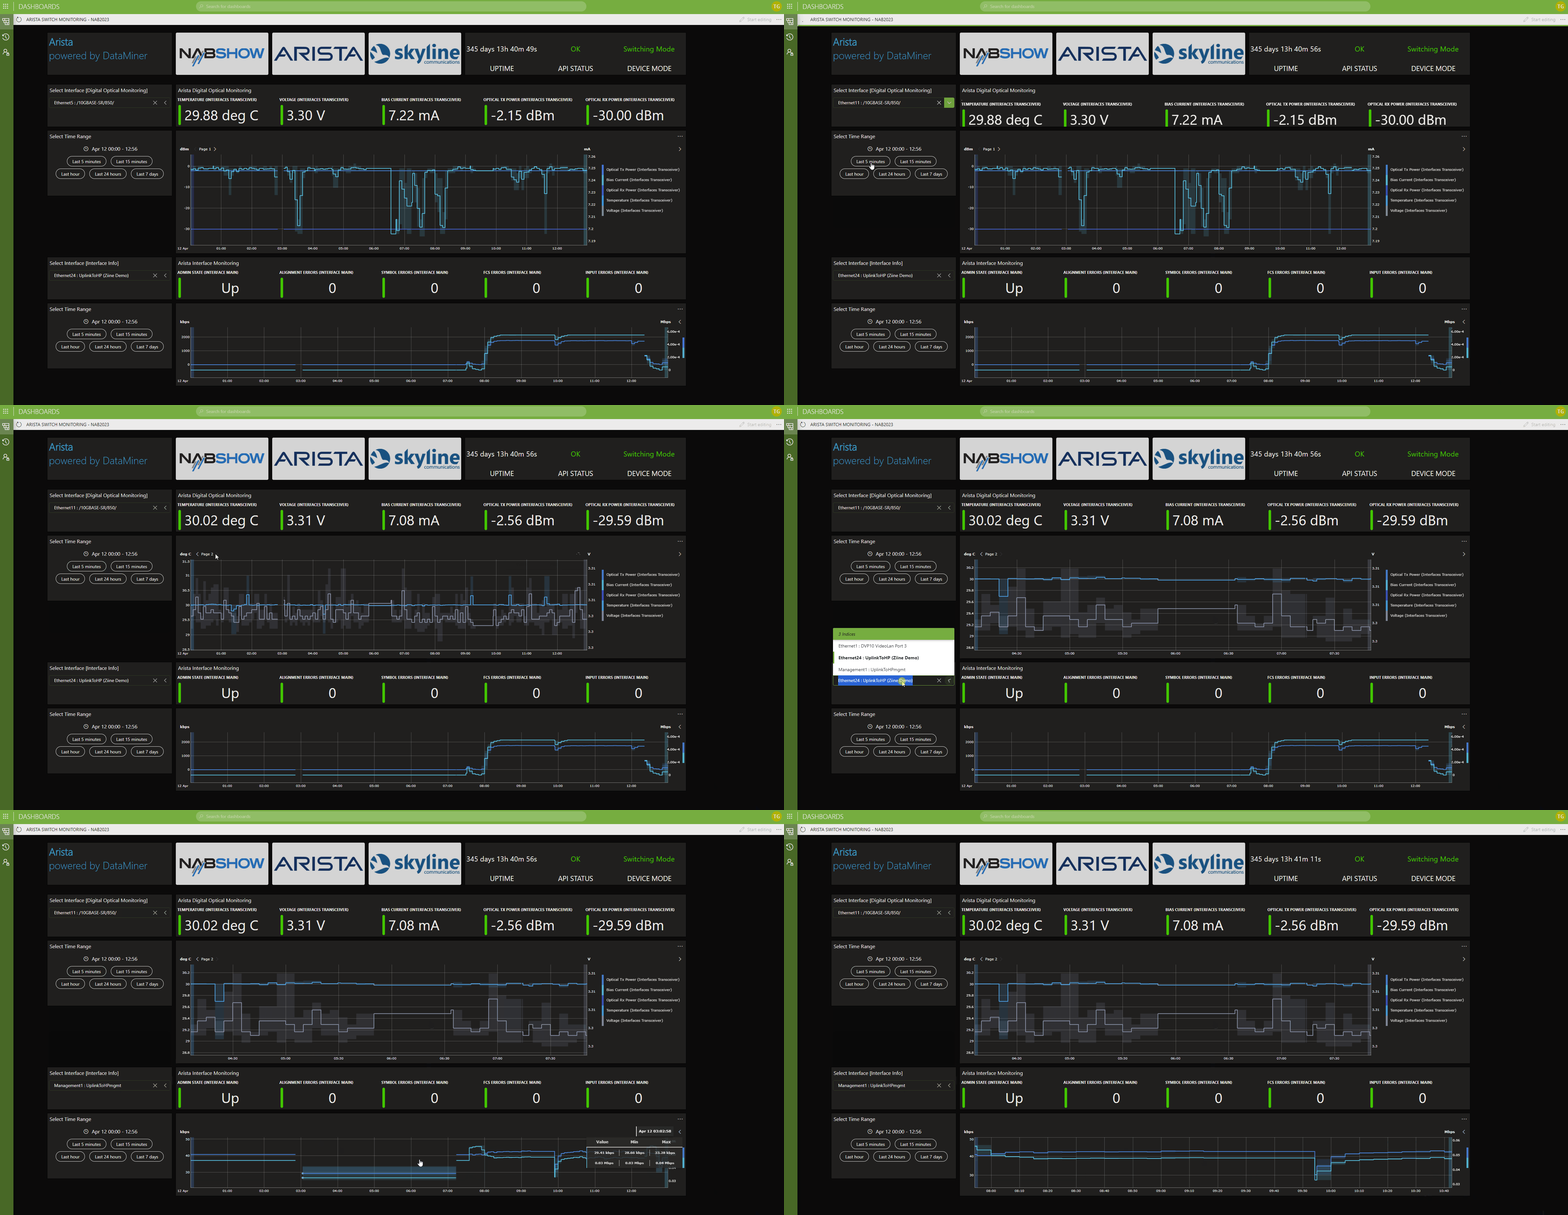 ARISTA - Use this dashboard to monitor SFP and interface data on an Arista switch.
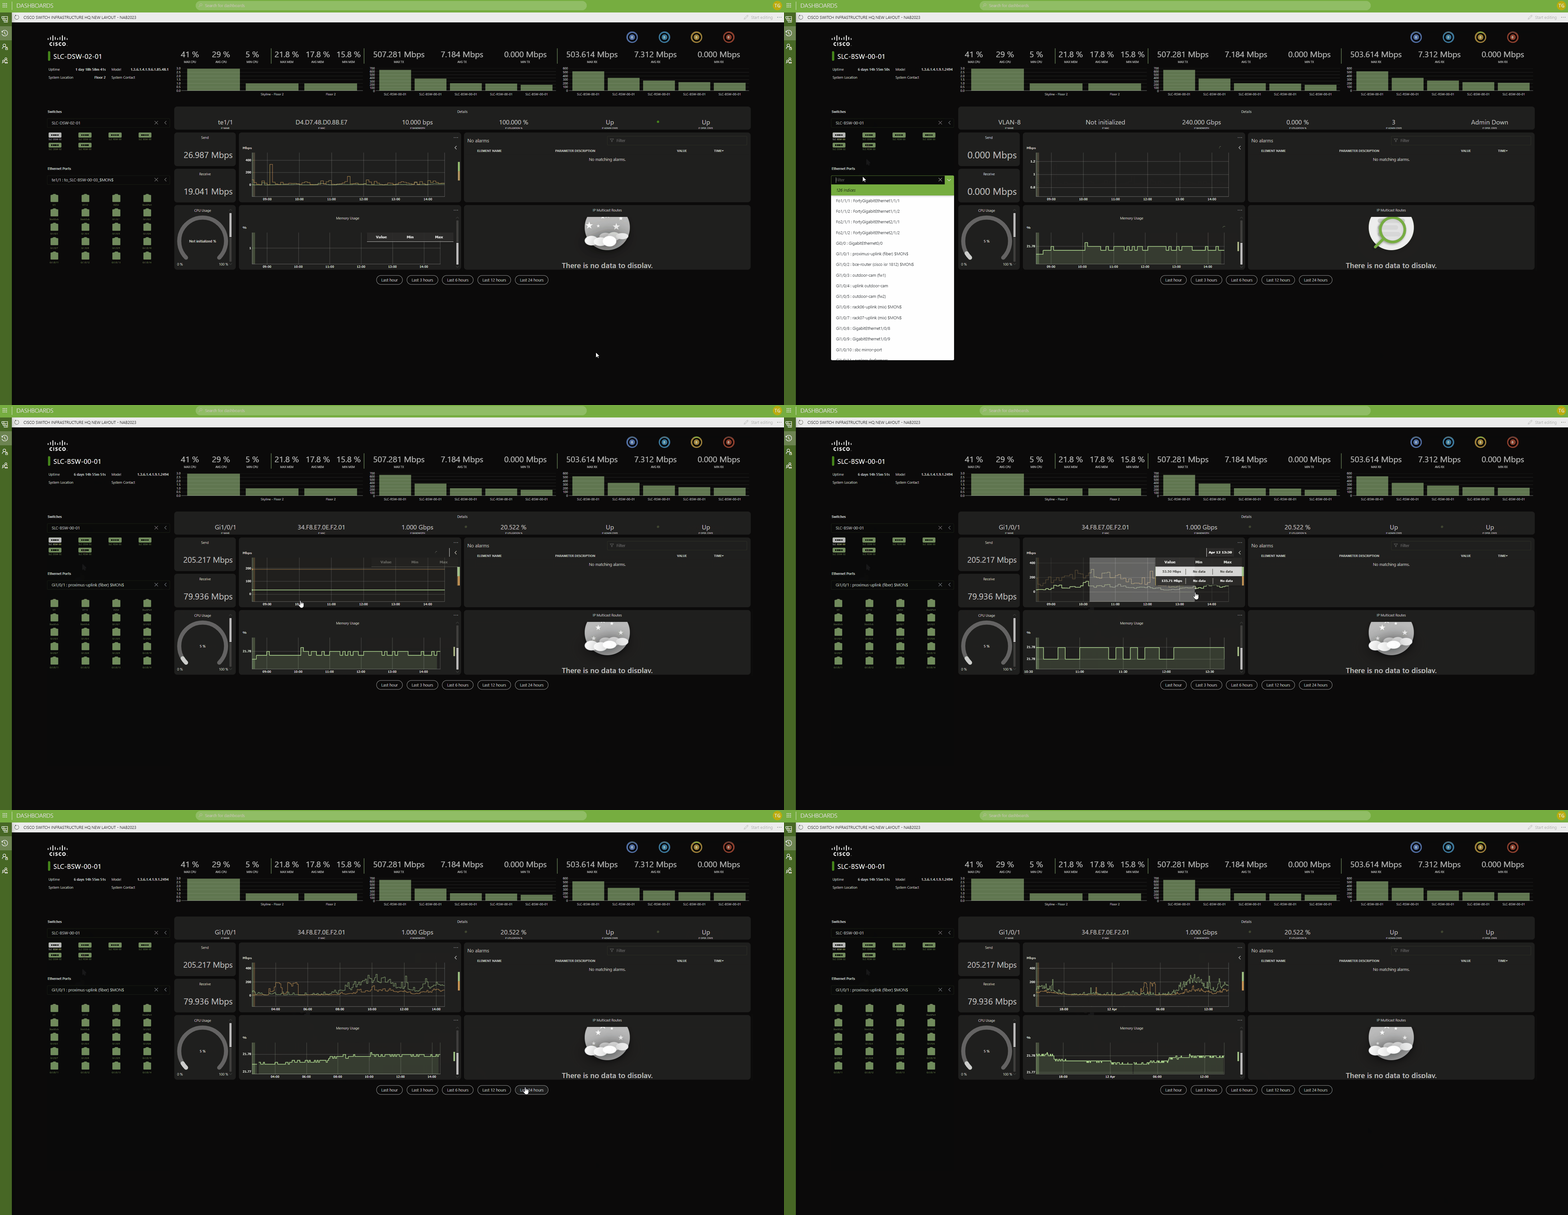 CISCO - Have a look at this dashboard to check real-time data from several Cisco Catalyst switches, live from the Skyline HQ in Belgium.
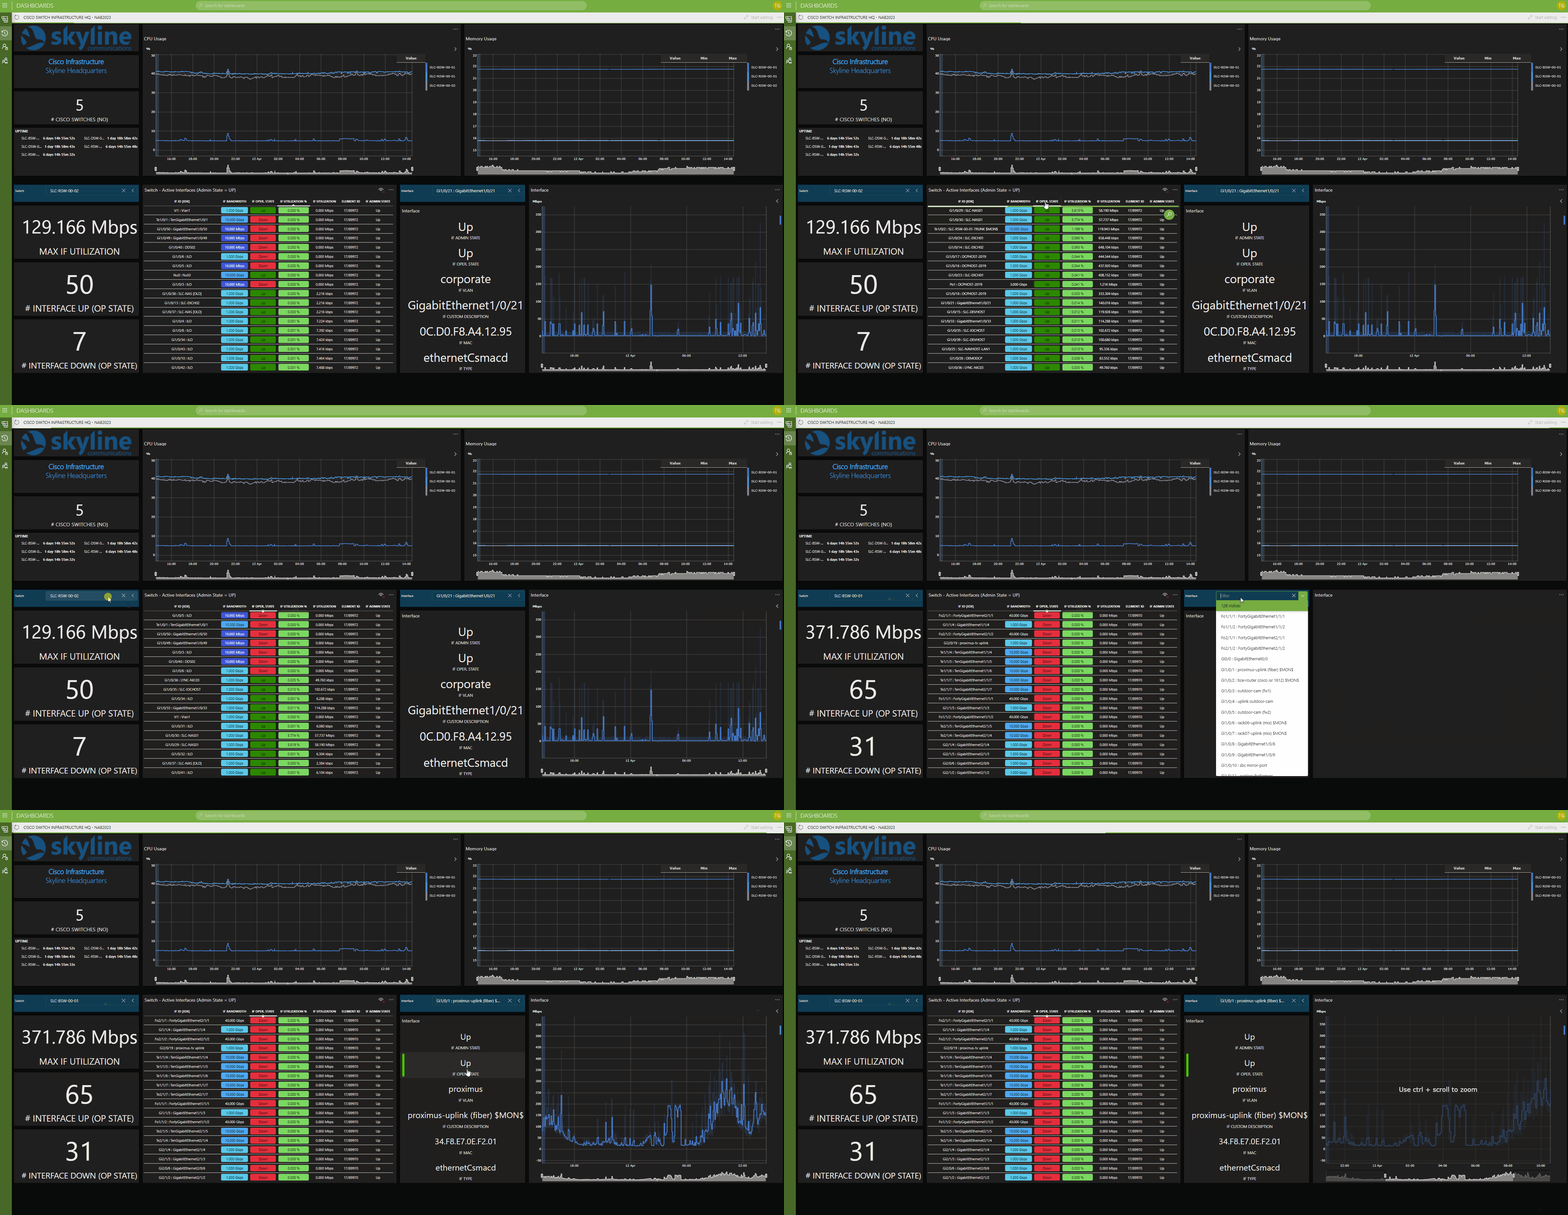 CISCO - Have a look at this dashboard to check real-time data from several Cisco Catalyst switches, live from the Skyline HQ in Belgium.
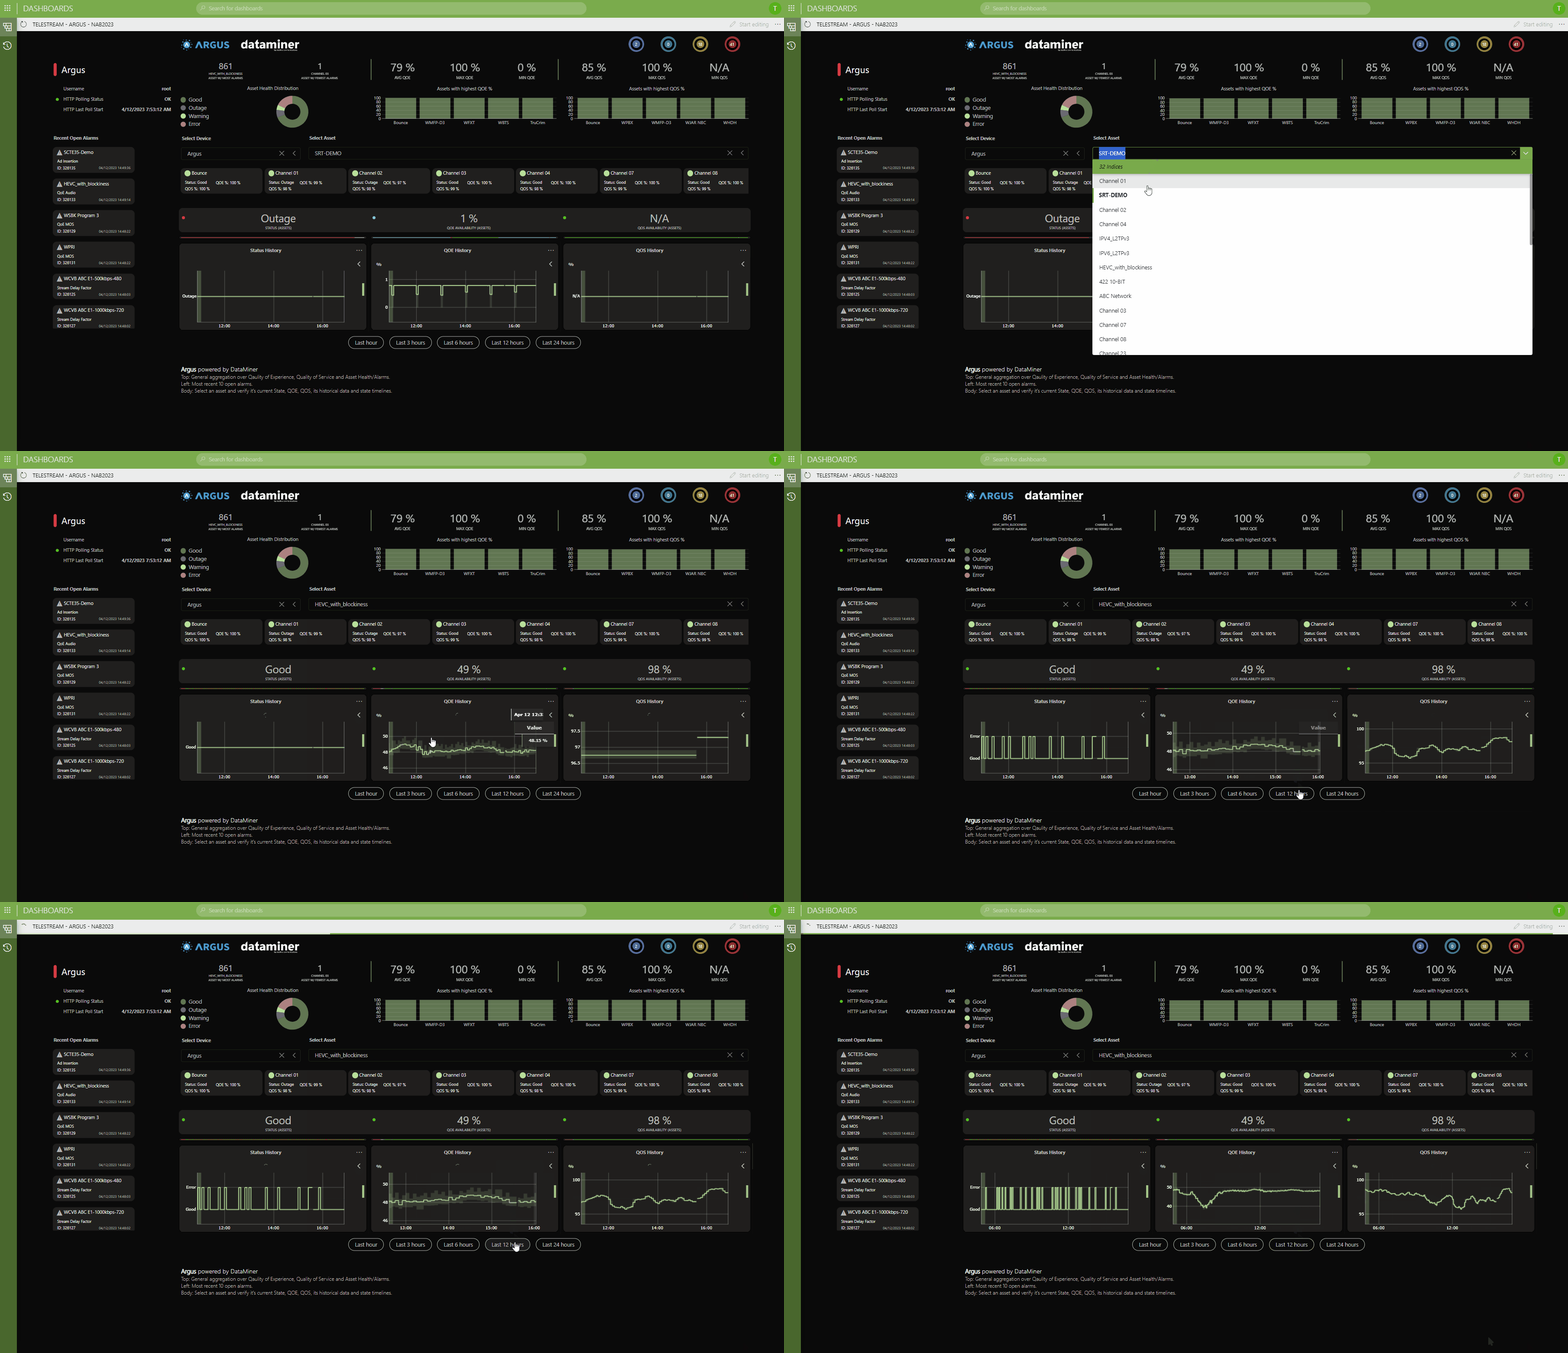 TELESTREAM - On this dashboard you can see how DataMiner interfaces with Telestream Arugs. Just pick a channel and seee the most important KPIs and alarms for the selected channel and its variants in real-time.
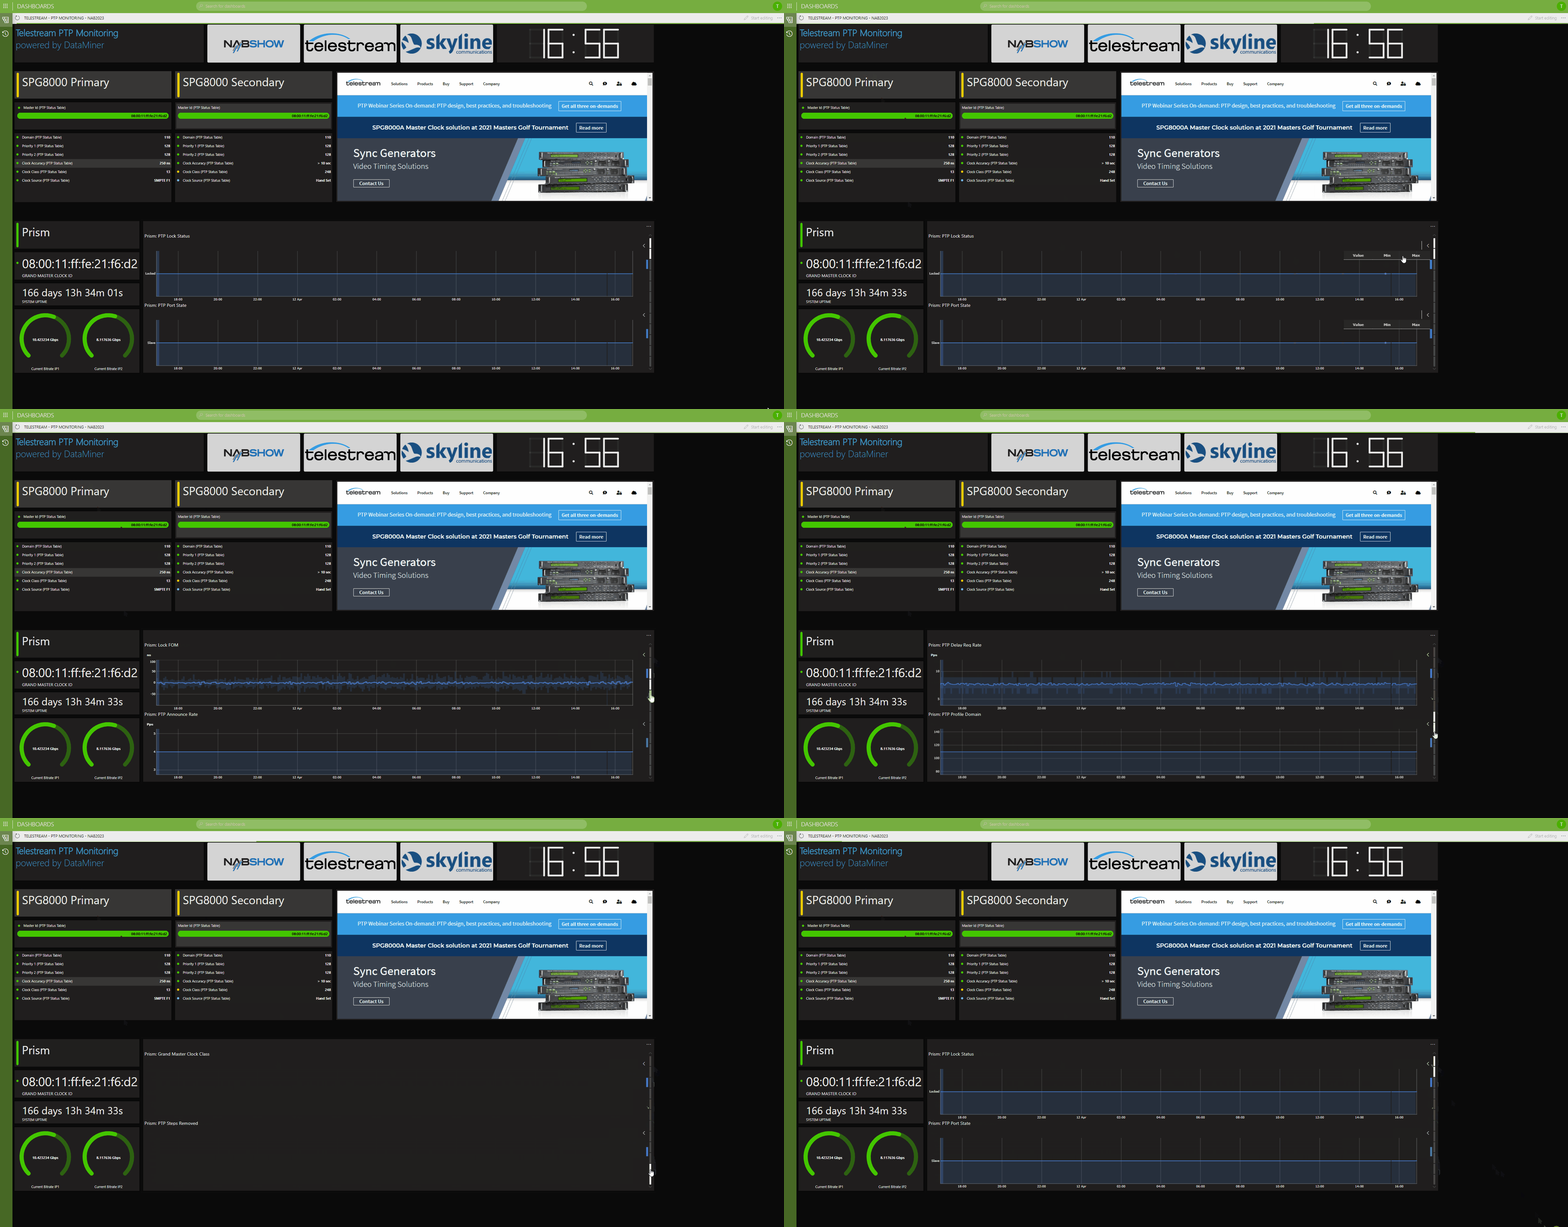 TELESTREAM - On this dashboard you can find two SPG8000 devices acting as PTP Grandmaster (primary and secondary) and a Prism analyzer (PTP Slave). Simply select some of the trended PTP parameters to monitor your PTP quality over time.
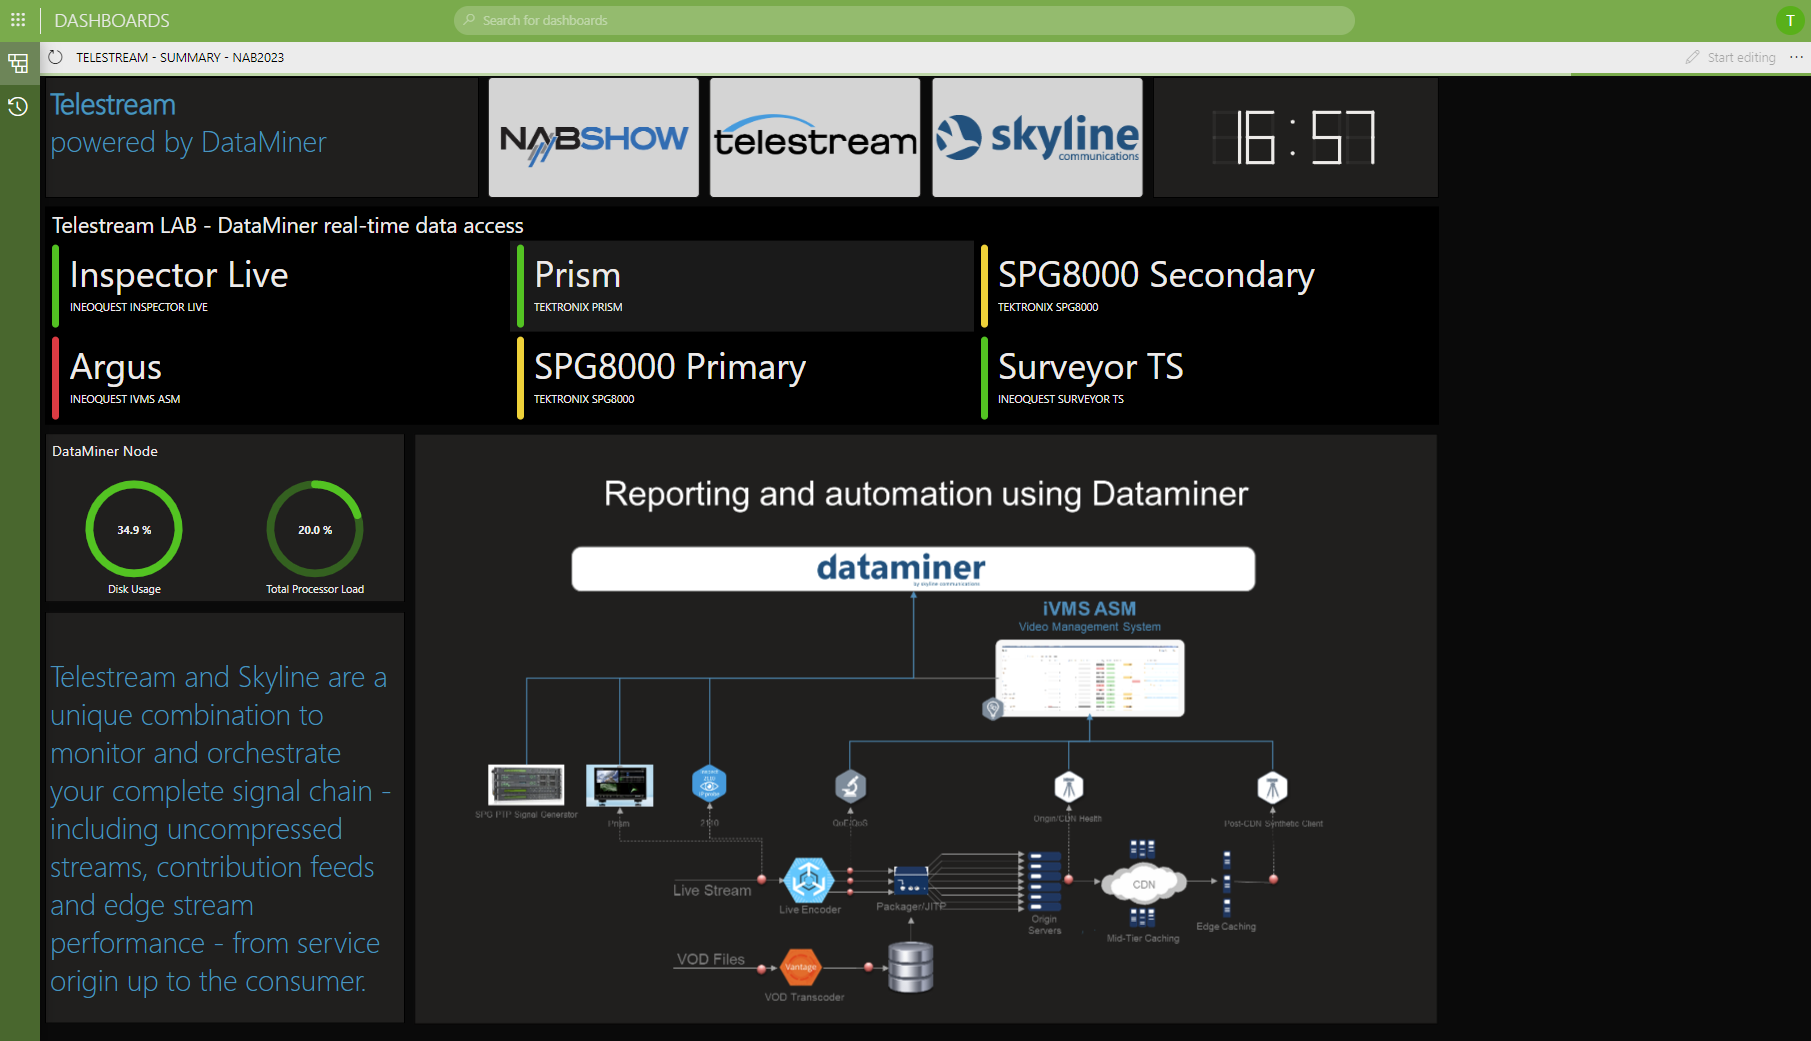 TELESTREAM - Check out how Telestream and Skyline offer joint solutions to monitor and orchestrate your complete signal chain.
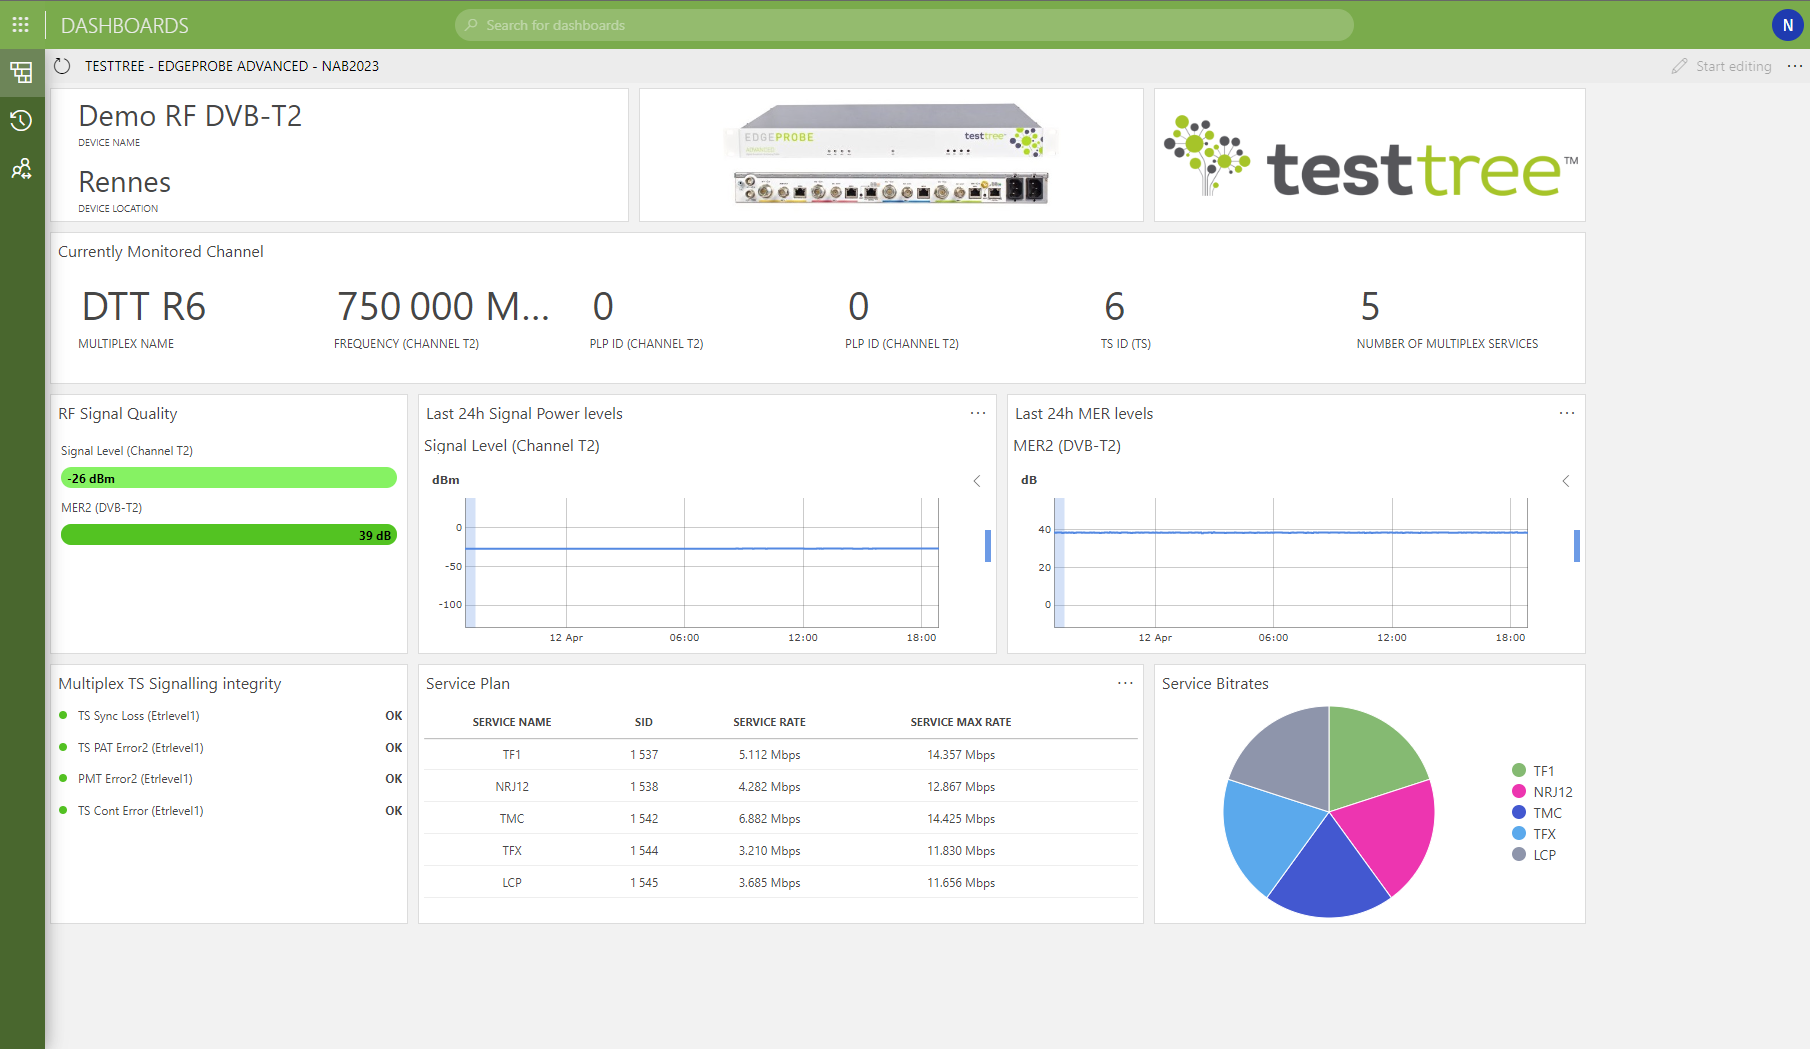 Hi. Have a look at this dashboard to see how DataMiner monitors a DTT channel via Testtree's EdgeProbe units in real-time.
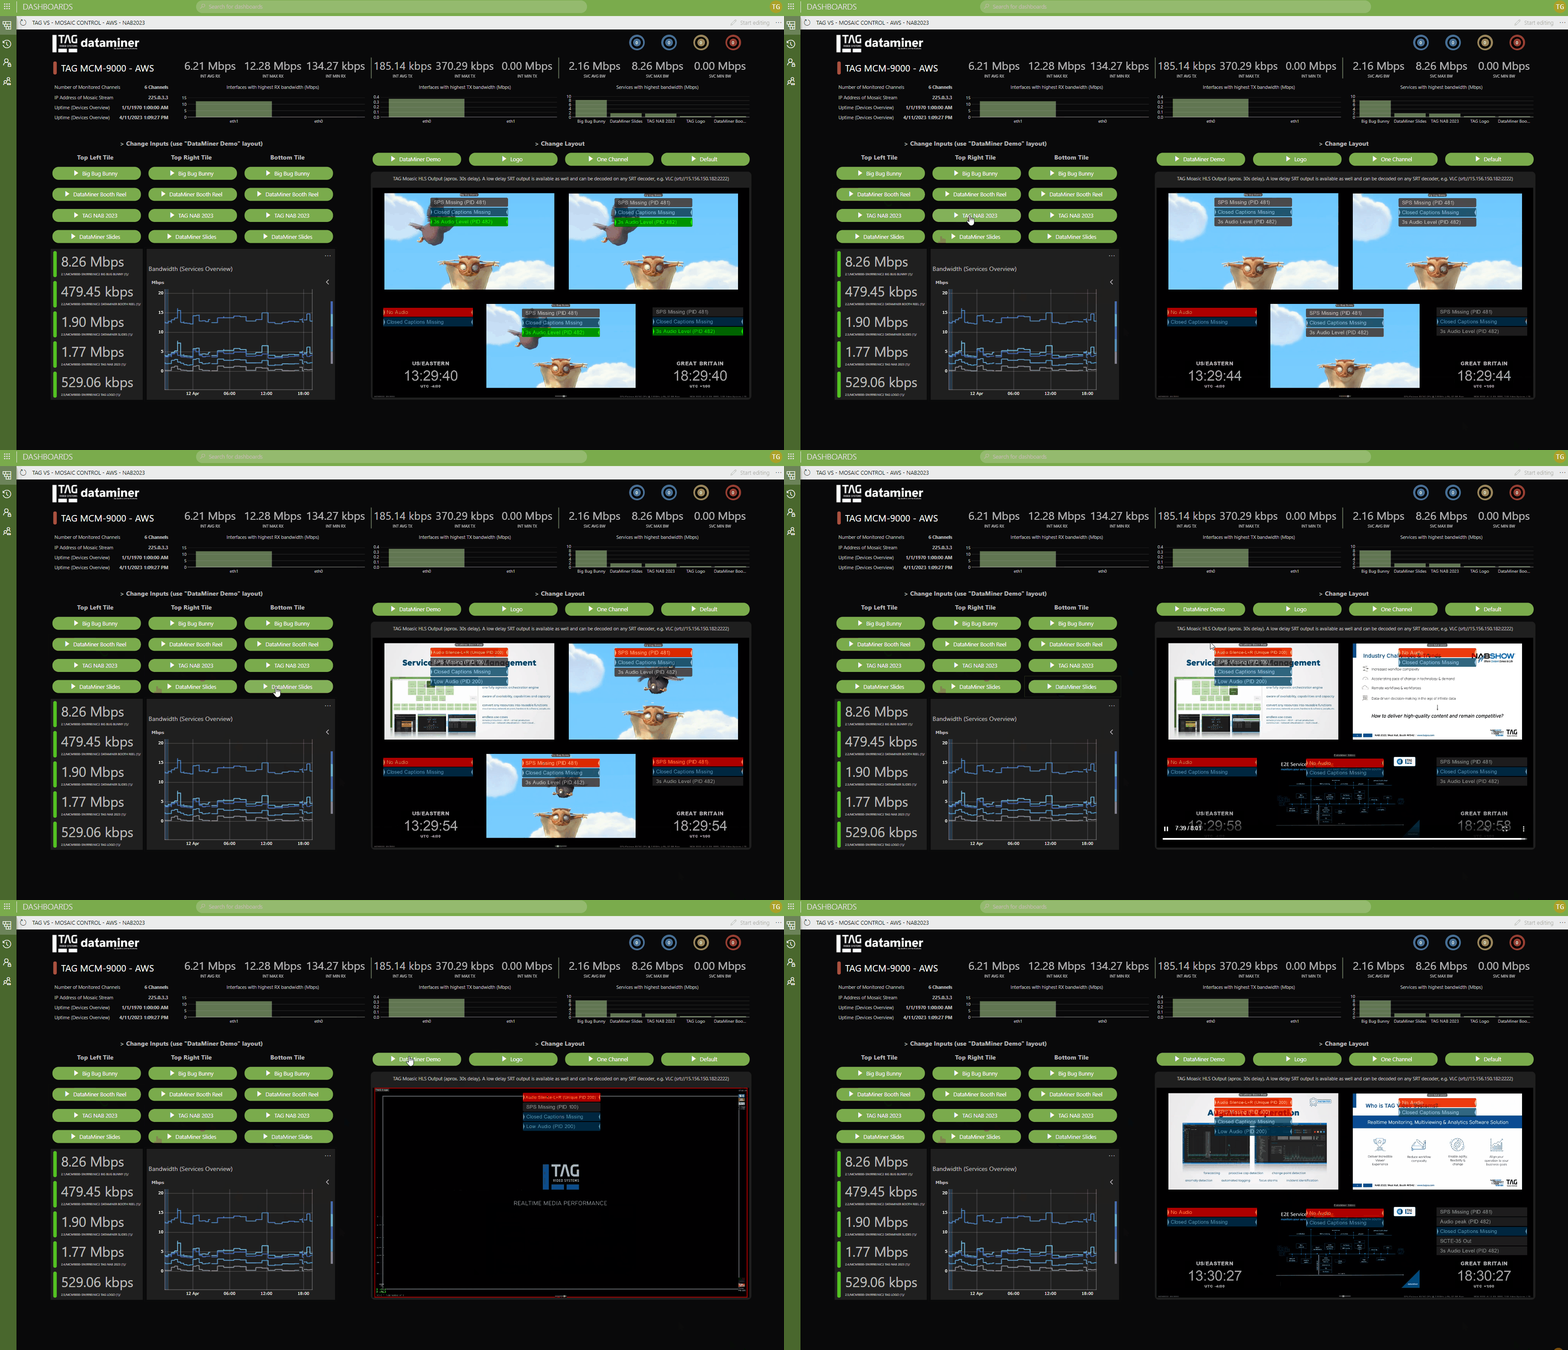 TAG VS - Use this control interface to change layouts and inputs on a TAG mosaic. Then enjoy the HLS output of that mosaic directly embedded into the UI.
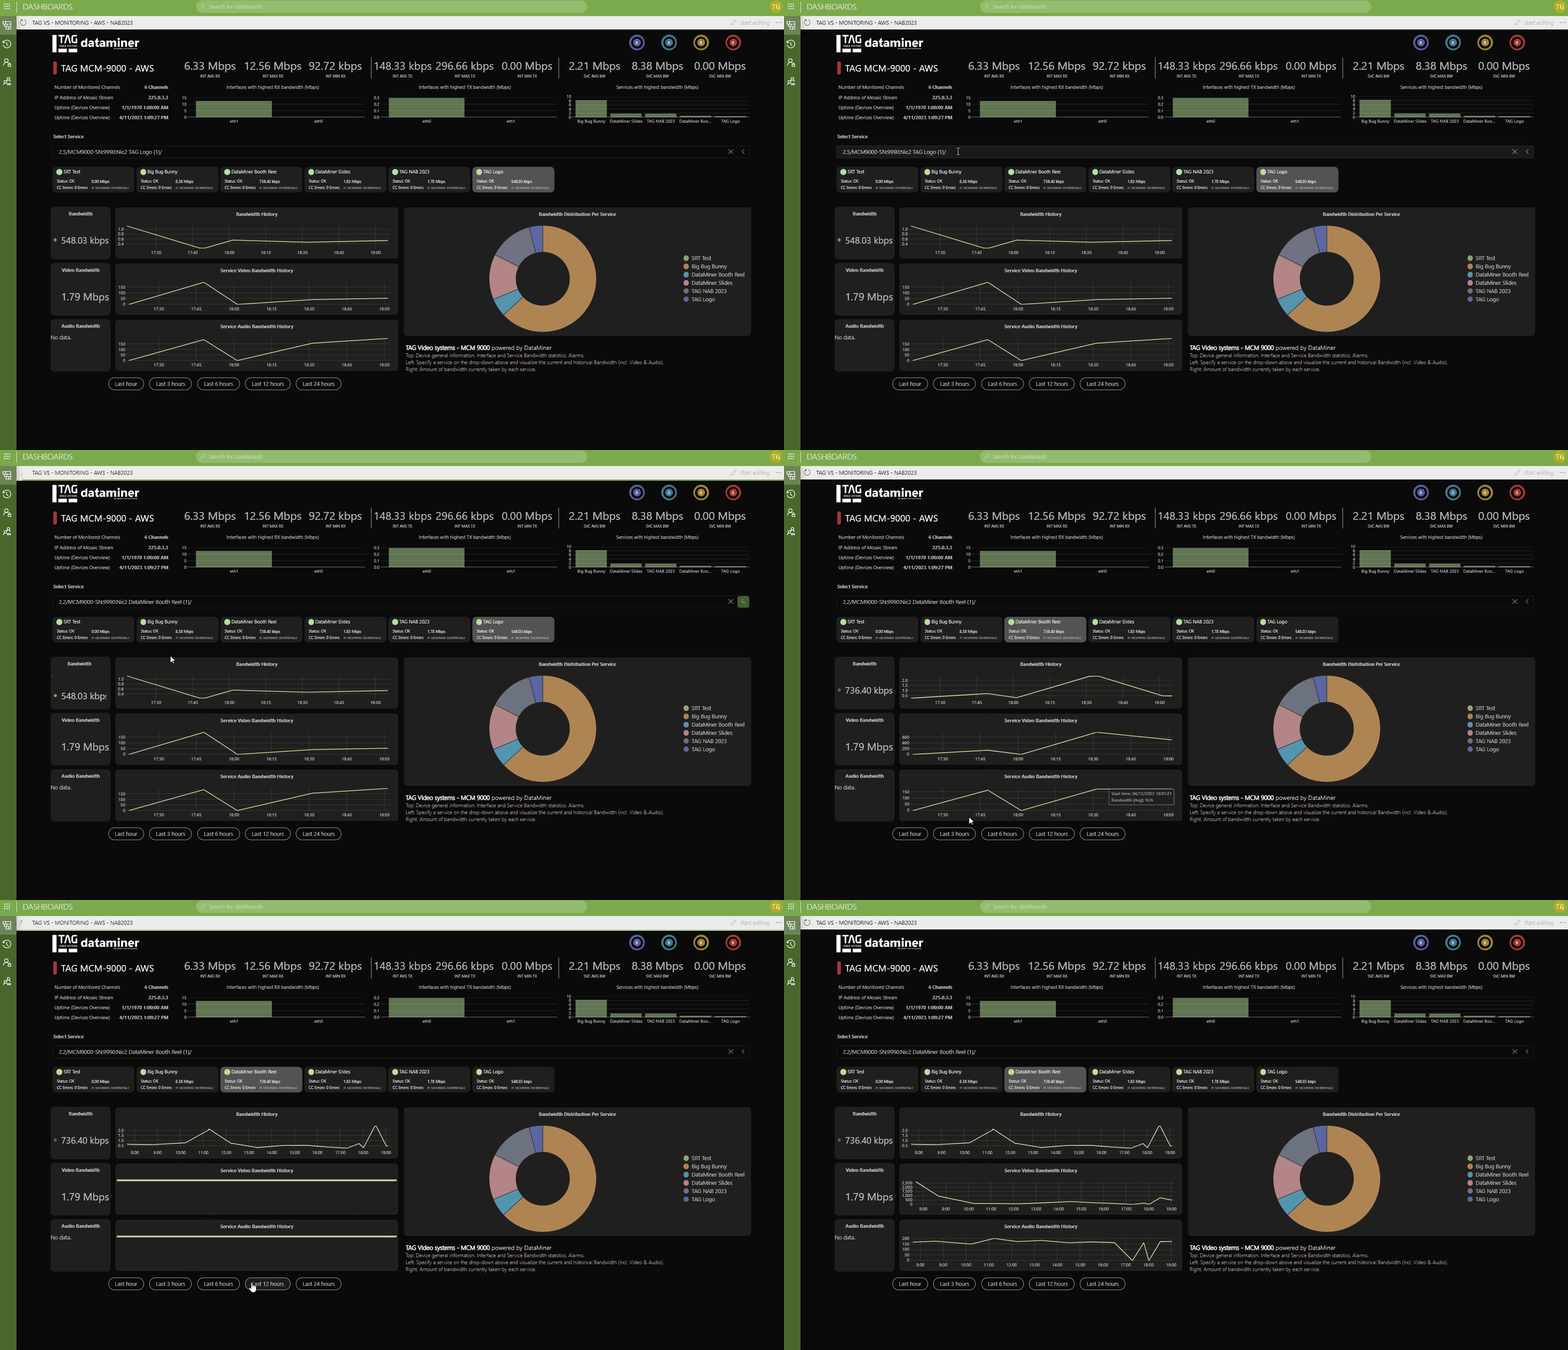 TAG VS - Check out this dashboard to see how DataMiner manages a TAG MCM-9000 instance. Get real-time access to all parameters and KPIs you want, DataMiner dashboards can be tailored to your needs.
3 thoughts on “NAB 2023 – Skyline Technology Partners”
Leave a Reply
You must be logged in to post a comment.
Great!
Fantastic real-world examples demostrating the power of Dashboards!
Fantastic real-world dashboards !!!